Improved Processor Scalability
Abstract
With z/VM 5.3, up to 32 CPUs are supported with a single VM image. Prior to this release, z/VM supported up to 24 CPUs. In addition to functional changes that enable z/VM 5.3 to run with more processors configured, a new locking infrastructure has been introduced that improves system efficiency for large n-way configurations. A performance study was conducted to compare the system efficiency of z/VM 5.3 to z/VM 5.2. While z/VM 5.3 is more efficient than z/VM 5.2 for all of the n-way measurement points included in this study, the efficiency improvement is substantial at large n-way configurations. With a 24-way LPAR configuration, a 19% throughput improvement was observed.
Introduction
This section reviews performance experiments that were conducted to verify the significant improvement in efficiency with z/VM 5.3 when running with large n-way configurations. Prior to z/VM 5.3, the VM Control Program (CP) scheduler lock had to always be held exclusive. With z/VM 5.3, a new scheduler lock infrastructure has been implemented. The new infrastructure includes a new Processor Local Dispatch Vector (PLDV) lock, one per processor. The new infrastructure enables obtaining the scheduler lock in shared mode in combination with the individual PLDV lock for a processor in exclusive mode when system conditions allow. This new lock design reduces contention for the scheduler lock, enabling z/VM to more efficiently manage large n-way configurations. A study that was done comparing z/VM 5.3 to z/VM 5.2 with the same workload using the same LPAR configurations is reviewed. The results show that processor scaling with z/VM 5.3 is much improved for large n-way configurations.
Background
Motivated by customers' needs to consolidate large numbers of guest systems onto a single VM image, the design of the scheduler lock has been incrementally enhanced to reduce lock contention. With z/VM 4.3, CP timer management scalability was improved by eliminating master processor serialization and other design changes were made to reduce large system effects. With z/VM 4.4, more scheduler lock improvements were made. A new CP timer request block lock was introduced to manage timer request serialization (TRQBK lock), removing that burden from the CP scheduler lock. With z/VM 5.1, 24-way support was announced. Now, with z/VM 5.3, scheduler lock contention has been reduced even further with the introduction of a new lock infrastructure that enables the scheduler lock to be held shared when conditions allow. With these additional enhancements, 32 CPUs are supported with a single VM image.
Method
A 2094-109 z9 system was used to conduct experiments in an LPAR configured with 10GB of central storage and 25GB of expanded storage. The breakout of central storage and expanded storage for this evaluation was arbitrary. Similar results are expected with other breakouts because the measurements were obtained in a non-paging environment.
The LPAR's n-way configuration was varied for the evaluation. The hardware configuration included shared processors and processor capping for all measurements. z/VM 5.2 measurements were used as the baseline for the comparison. z/VM 5.2 baseline measurements were done with the LPAR configured as a 6-way, 12-way, 18-way, 24-way, and 30-way. z/VM 5.3 measurements were done for each of these n-way environments. In addition, a 32-way measurement was done, since that is the largest configuration supported by z/VM 5.3.
Processor capping creates a maximum limit for system processing power allocated to the LPAR. By running with processor capping enabled, any effects that are measured as the n-way is varied can be attributed to the n-way changes rather than a combination of n-way effects and large system effects. Processing capacity was held at approximately 6 full processors for this study.
The software application workload used for this evaluation was a version of the Apache workload without storage constraints. The Linux guests that were acting as clients were configured as virtual uniprocessor machines with 1GB of storage. The Linux guests that were acting as web servers were configured as virtual 5-way machines with 128MB of storage. The number of Linux web clients and web servers was increased as the n-way was increased in order to generate enough dispatchable units of work to keep the processors busy.
The Application Workload Modeler (AWM) was used to simulate client requests for the Apache workload measurements. Hardware instrumentation data, AWM data, and Performance Toolkit for VM data were collected for each measurement.
Results and Discussion
For this study, if system efficiency is not affected by the n-way changes, the expected result for the Internal Throughput Rate Ratio (ITRR) is that it will increase proportionally as the n-way increases. For example, if the number of CPUs is doubled, the ITRR would double if system efficiency is not affected by the n-way change.
Figure 1. Large N-Way Effects on ITR Ratio
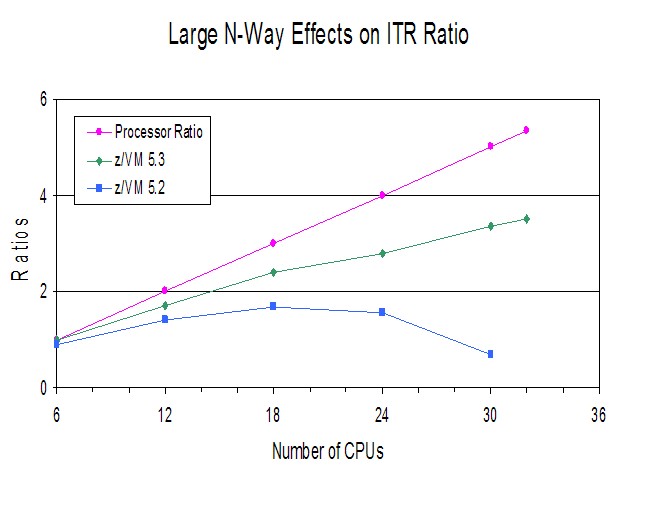 |
Figure 1 shows the comparison of ITRR between z/VM 5.2 and z/VM 5.3. It also shows the line for processor scaling, using the 6-way 5.3 measurement as the baseline.
Figure 1 illustrates the dramatic improvement with z/VM 5.3 scalability with larger n-way configurations. The processor ratio line shows the line for perfect scaling. While the z/VM 5.3 system does not scale perfectly, this is expected as software multi-processor locking will always have some impact on system efficiency. The loss of system efficiency is more pronounced for larger n-way configurations because that is where scheduler lock contention is the greatest.
It should be noted that z/VM 5.2 only supports up to 24 CPUs for a single VM image. The chart shows a 30-way configuration to illustrate the dramatic improvement in efficiency with z/VM 5.3. This also explains why support was limited to 24 CPUs with z/VM 5.2.
Table 1 shows a summary of the measurement data
collected when
running with z/VM 5.3 with LPAR n-way configurations of 6-way, 12-way,
18-way, 24-way, 30-way, and 32-way.
Table 1. Comparison of System Efficiency with z/VM 5.3 as N-Way Increases
| Shared CPUs | 6 | 12 | 18 | 24 | 30 | 32 |
| AWM Clients | 3 | 5 | 7 | 9 | 11 | 12 |
| AWM Servers | 5 | 9 | 13 | 17 | 21 | 23 |
| Run ID | AVPK5187 | AVPK5184 | AVPK5183 | AVPK5182 | AVPK5188 | AVPK5186 |
| Tx/sec (p) | 4674.21 | 4120.00 | 3841.05 | 3315.00 | 3177.00 | 3117.00 |
| ITR (p) | 4697.70 | 8015.56 | 11297.21 | 13102.77 | 15805.97 | 16492.06 |
| Total Util/Proc (p) | 99.5 | 51.4 | 34.0 | 25.3 | 20.1 | 18.9 |
| Processors (p) | 6 | 12 | 18 | 24 | 30 | 32 |
| Total CPU/Tx (p) | 1.277 | 1.497 | 1.593 | 1.832 | 1.898 | 1.940 |
| CP CPU/Tx (p) | 0.290 | 0.341 | 0.417 | 0.485 | 0.482 | 0.462 |
| Emul CPU/Tx (p) | 0.987 | 1.156 | 1.176 | 1.347 | 1.416 | 1.478 |
| Pct Spin Time (p) | .371 | 5.233 | 9.883 | 13.08 | 16.48 | 14.53 |
| Sch Pct Spin Time (p) | .315 | 4.763 | 9.034 | 12.58 | 16.05 | 14.08 |
| TRQ Pct Spin Time (p) | .054 | .463 | .833 | .488 | .433 | .442 |
| Privops/Tx (p) | 50.818 | 54.376 | 52.766 | 54.109 | 53.331 | 52.557 |
| Diagnoses/Tx (p) | 1.840 | 4.631 | 2.022 | 2.172 | 2.339 | 2.069 |
| RATIOS | ||||||
| Tx/sec (p) | 1.000 | 0.881 | 0.822 | 0.709 | 0.680 | 0.667 |
| ITR (p) | 1.000 | 1.706 | 2.405 | 2.789 | 3.365 | 3.511 |
| Total Util/Proc (p) | 1.000 | 0.517 | 0.342 | 0.254 | 0.202 | 0.190 |
| Processors (p) | 1.000 | 2.000 | 3.000 | 4.000 | 5.000 | 5.333 |
| Total CPU/Tx (p) | 1.000 | 1.172 | 1.247 | 1.435 | 1.486 | 1.519 |
| CP CPU/Tx (p) | 1.000 | 1.176 | 1.438 | 1.672 | 1.662 | 1.593 |
| Emul CPU/Tx (p) | 1.000 | 1.171 | 1.191 | 1.365 | 1.435 | 1.497 |
| Pct Spin Time (p) | 1.000 | 14.105 | 26.639 | 35.256 | 44.420 | 39.164 |
| Sch Pct Spin Time (p) | 1.000 | 15.121 | 28.679 | 39.937 | 50.952 | 44.698 |
| TRQ Pct Spin Time (p) | 1.000 | 8.574 | 15.426 | 9.037 | 8.019 | 8.185 |
| Privops/Tx (p) | 1.000 | 1.070 | 1.038 | 1.065 | 1.049 | 1.034 |
| Diagnoses/Tx (p) | 1.000 | 2.517 | 1.099 | 1.180 | 1.271 | 1.124 |
| Notes: z9 machine; 10GB central storage; 25GB expanded storage; Apache web serving workload with uniprocessor clients and 5-way servers; Non-paging environment with processor capping in effect to maintain processing capacity constant. (h) hardware instrumentation data; (p) Performance Toolkit data | ||||||
Table 1 highlights the key measurement points that were used in this performance study. Some of the same trends found here were also found in the 24-Way Support evaluated in the z/VM 5.1 performance report. Reference the z/VM 5.1 table comparison of system efficiency.
The CPU time per transaction (Total CPU/Tx) increases as the n-way increases. Both CP and the Linux guests (represented by emulation) contribute to the increase. However, the CP CPU/Tx numbers are lower than they were with z/VM 5.1 (although this metric was not included in the z/VM 5.1 table). In fact, there is a slight downward trend in the z/VM 5.3 numbers with the 30-way and 32-way configurations. The reduction in CP's CPU time per transaction is a result of the improvements to the scheduler lock design and other enhancements incorporated into z/VM 5.3.
Another trend discussed in the 24-Way Support with z/VM 5.1 is the fact that the Linux guest virtual MP machines are spinning on locks within the Linux system. This spinning results in Diagnose X'44's being generated. For further information concerning Diagnose X'44's, please refer to the discussion in the 24-Way Support section in the z/VM 5.1 Performance Report.
Finally, the 24-Way Support in the z/VM 5.1 Performance Report discusses the make up of the CP CPU time per transaction. Two components that are included there are formal spin time and non-formal spin time. With z/VM 5.3, a breakout by lock type of formal spin time is included in monitor records and is now presented in the Performance Toolkit with new screen FCX265 - Spin Lock Log By Time. A snapshot of the ">>Mean>>" portion of that screen is shown below.
The scheduler lock is "SRMSLOCK" in the Spin Lock Log screen shown below. The new lock infrastructure discussed in the Introduction of this section is used for all of the formal locks. However, at this time, only the scheduler lock exploits the shared mode enabled by the new design. The new infrastructure may be exploited for other locks in the future as appropriate.
FCX265  Run 2007/05/21 14:33:24         LOCKLOG
                                        Spin Lock Log, by Time
_____________________________________________________________________________________

                      <------------------- Spin Lock Activity -------------------->
                      <----- Total ----->  <--- Exclusive --->  <----- Shared ---->
 Interval             Locks Average   Pct  Locks Average   Pct  Locks Average   Pct
 End Time LockName     /sec    usec  Spin   /sec    usec  Spin   /sec    usec  Spin
 >>Mean>> SRMATDLK     61.0   48.39  .009   61.0   48.39  .009     .0    .000  .000
 >>Mean>> RSAAVCLK       .0    .000  .000     .0    .000  .000     .0    .000  .000
 >>Mean>> RSA2GCLK       .0   3.563  .000     .0   3.563  .000     .0    .000  .000
 >>Mean>> BUTDLKEY       .0    .000  .000     .0    .000  .000     .0    .000  .000
 >>Mean>> HCPTMFLK       .0    .000  .000     .0    .000  .000     .0    .000  .000
 >>Mean>> RSA2GLCK       .0    .551  .000     .0    .551  .000     .0    .000  .000
 >>Mean>> HCPRCCSL       .0    .000  .000     .0    .000  .000     .0    .000  .000
 >>Mean>> RSASXQLK       .0   1.867  .000     .0   1.867  .000     .0    .000  .000
 >>Mean>> HCPRCCMA       .0    .000  .000     .0    .000  .000     .0    .000  .000
 >>Mean>> RCCSFQL        .0    .000  .000     .0    .000  .000     .0    .000  .000
 >>Mean>> RSANOQLK       .0    .000  .000     .0    .000  .000     .0    .000  .000
 >>Mean>> NSUNLSLK       .0    .000  .000     .0    .000  .000     .0    .000  .000
 >>Mean>> HCPPGDML       .0    .000  .000     .0    .000  .000     .0    .000  .000
 >>Mean>> NSUIMGLK       .0    .000  .000     .0    .000  .000     .0    .000  .000
 >>Mean>> FSDVMLK        .0    .000  .000     .0    .000  .000     .0    .000  .000
 >>Mean>> DCTLLOK        .0    .000  .000     .0    .000  .000     .0    .000  .000
 >>Mean>> SYSDATLK       .0    .000  .000     .0    .000  .000     .0    .000  .000
 >>Mean>> RSACALLK       .0    .000  .000     .0    .000  .000     .0    .000  .000
 >>Mean>> RSAAVLLK       .0    .328  .000     .0    .328  .000     .0    .000  .000
 >>Mean>> HCPPGDAL       .0    .000  .000     .0    .000  .000     .0    .000  .000
 >>Mean>> HCPPGDTL       .0    .000  .000     .0    .000  .000     .0    .000  .000
 >>Mean>> HCPPGDSL       .0    .000  .000     .0    .000  .000     .0    .000  .000
 >>Mean>> HCPPGDPL       .0    .000  .000     .0    .000  .000     .0    .000  .000
 >>Mean>> SRMALOCK       .0    .000  .000     .0    .000  .000     .0    .000  .000
 >>Mean>> HCPTRQLK    675.5   209.2  .442  675.5   209.2  .442     .0    .000  .000
 >>Mean>> SRMSLOCK    30992   145.4 14.08  30991   145.4 14.08     .7   949.1  .002
Summary and Conclusions
With the workload used for this evaluation, there is a gradual decrease in system efficiency which is more pronounced at large n-way configurations.
The specific workload used will have a significant effect on the efficiency with which z/VM can manage large numbers of processor engines. As stated in the 24-Way Support section in the z/VM 5.1 report, when z/VM is running in large n-way LPAR configurations, z/VM overhead will be lower for workloads with fewer, more CPU-intensive guests than for workloads with many lightly loaded guests. Some workloads (such as CMS workloads) require master processor serialization. Workloads of this type will not be able to fully utilize as many CPUs because of master processor serialization. Also, application workloads that use a single virtual machine and are not capable of using multiple processors (such as DB2 for VM and VSE, SFS, and RACF) may not be able to take full advantage of a large n-way configuration.
This evaluation focused on analyzing the effects of increasing the n-way
configuration while holding CPU processing capacity relatively constant. In
production environments, n-way increases will typically also result in
processing capacity increases. Before exploiting large n-way configurations,
the specific workload characteristics should be considered in terms of how it
will perform with the work dispatched across more CPUs as well as utilizing the
larger processing capacity.