Improved Real Storage Scalability
Abstract
z/VM 5.3 includes several important enhancements to CP storage management. Page management blocks (PGMBKs) can now reside above the real storage 2G line, contiguous frame management has been further improved, and fast available list searching has been implemented. These improvements collectively resulted in improved performance in storage-constrained environments (throughput increased from 10.3% to 21.6% for example configurations), greatly increased the amount of in-use virtual storage that z/VM can support, and allowed the maximum real storage size supported by z/VM to be increased from 128 GB to 256 GB.
Introduction
In z/VM 5.2, substantial changes were made to CP storage management so that most pages could reside in real (central) storage frames above the 2G line. These changes greatly improved CP's ability to effectively use large real storage sizes (see Enhanced Large Real Storage Exploitation for results and discussion).
With z/VM 5.3, additional CP storage management changes have been made to further improve real storage scalability. The most important of these changes is to allow CP's page management blocks (PGMBKs) to reside above the 2G line in real storage. In addition, the management of contiguous frames has been further improved and the search for single and contiguous frames on the available list is now much more efficient. These changes have resulted in the following three benefits:
- The performance of storage-constrained environments has been improved.
- The amount of in-use virtual storage that can be supported by z/VM has been greatly increased.
- The amount of real storage supported by z/VM has been increased from 128G to 256G.
This section provides performance results that illustrate and quantify each of these three benefits.
Improved Performance for Storage-Constrained Environments
The z/VM 5.3 storage management changes have resulted in improved performance relative to z/VM 5.2 for storage-constrained environments. This is illustrated by the measurement results provided in this section.
Method
The Apache Workload was measured on both z/VM 5.2 and z/VM 5.3 in a number of different configurations that include examples of low and high storage contention and examples of small and large real storage sizes. The amount of storage referenced by the workload was controlled by adjusting the number of Apache servers, the virtual storage size of those servers, and the size/number of URL files being randomly requested from those servers.
Results and Discussion
The results are summarized in Table 1 as percentage changes from z/VM 5.2. For each measurement pair, the number of expanded storage plus DASD pageins per CPU-second for the z/VM 5.2 measurement is used as a measure of real storage contention.
Table 1. Performance Relative to z/VM 5.2
| Configuration | 1 | 2 | 3 | 4 |
| Real Storage | 3G | 64G | 64G | 128G |
| Contention (z/VM 5.2 Pageins/CPU-sec) | 2159 | 0 | 352 | 291 |
| Expanded Storage | 4G | 2G | 2G | 2G |
| Processor Type/Model | 2084-B16 | 2094-S38 | 2094-S38 | 2094-S38 |
| Processors | 3 | 3 | 3 | 6 |
| Apache Clients/Servers | 2/12 | 3/6 | 3/6 | 4/13 |
| Apache Server Virtual Size | 1G | 10G | 10G | 10G |
| Apache Files | 600 | 2 | 10000 | 10000 |
| Apache File Size | 1M | small | 1M | 1M |
| Minidisk Cache | off | default | default | default |
| 520 Runid | APMTA193 | APT064G2 | APT064G1 | APT128G0 |
| 530 Runid | APMU5180 | APU064G2 | APU064G1 | APU128G0 |
| Throughput | 10.3% | 1.0% | 15.5% | 21.6% |
| Total CPU/tx | -9.5% | -0.9% | -12.7% | -19.4% |
| Virtual CPU/tx | -0.6% | 0.7% | -2.5% | -3.0% |
| CP CPU/tx | -18.8% | -4.8% | -24.6% | -36.3% |
| Notes: Apache workload; SLES8 Clients; SLES9 SP2 Servers; z/VM 5.2 GA; z/VM 5.3 GA + RSU1 | ||||
From these results, we see that whenever there is storage contention, we see a significant performance improvement both in terms of increased throughput and reduced CPU requirements. Some of these improvements may also be experienced by z/VM 5.2 systems that have service applied.
In configuration 2, which has no storage contention, we see only a small performance improvement. That improvement is due to the VM guest LAN QDIO simulation improvement rather than the storage management improvements. Indeed, we have observed a slight performance decrease relative to z/VM 5.2 for non-constrained workloads that do not happen to exercise any offsetting improvements.
As a general rule, you can expect the amount of improvement to increase as the amount of real storage contention increases and as the real storage size increases. This is supported by these results. Comparing configurations 3 and 4, we see that when we double real storage while holding the amount of contention roughly constant, performance relative to z/VM 5.2 shows a larger improvement. As another example, compare configurations 1 and 3. Both configurations show a large performance improvement relative to z/VM 5.2. Configuration 1 has high contention but a small real storage size while configuration 3 has low contention but a large real storage size.
Maximum In-use Virtual Storage Increased
With z/VM 5.3, the maximum amount of in-use virtual storage supported by z/VM has been greatly increased. This section discusses this in detail and then provides some illustrative measurement results and Performance Toolkit for VM data.
Before any page can be referenced in a given 1-megabyte segment of virtual storage, CP has to create a mapping structure for it called a page management block (PGMBK), which is 8KB in size. Each PGMBK is pageable but must be resident in real storage whenever one or more of the 256 pages in the 1 MB virtual storage segment it represents reside in real storage. For the purposes of this discussion, we'll refer to such a 1 MB segment as being "in-use". When resident in real storage, a PGMBK resides in 2 contiguous frames.
With z/VM 5.2, these resident PGMBKs had to located below the 2 GB line. This limited the total amount of in-use virtual storage that any given z/VM system could support. If the entire first 2 GB of real storage could be devoted to resident PGMBKs, this limit would be 256 GB of in-use virtual storage. (See calculation). Because there are certain other structures that must also reside below the 2 GB line, the practical limit is somewhat less.) Bear in mind that this limit is for in-use virtual storage. Since virtual pages and PGMBKs can be paged out, the total amount of ever-used virtual storage can be higher but only at the expense of degraded performance due to paging. So think of this is a "soft" limit.
Since, with z/VM 5.3, PGMBKs can reside anywhere in real storage, this limit has been removed and therefore z/VM can now support much larger amounts of in-use virtual storage. So what is the next limit?
In most cases, the next limit will be determined by the total real storage size of the z/VM system. The maximum real storage size supported by z/VM is now 256 GB (increased from 128 GB in z/VM 5.2) so let us consider examples for such a system. The number of real storage frames taken up by each in-use 1 MB segment of virtual storage is 2 frames for the PGMBK itself plus 1 frame multiplied by the average number of the 256 virtual pages in that segment that map to real storage. For example, suppose that the average number of resident pages per in-use segment is 50. In that case, each in-use segment requires a total of 52 real storage frames and therefore a 256 GB z/VM 5.3 system can support up to about 1260 GB of in-use virtual storage (see calculation), which is 1.23 TB (Terabytes). Again, this is a soft limit in that such a system can support more virtual storage but only at the expense of degraded performance due to paging.
As our next example, let us consider the limiting case where there there is just one resident page in each in-use segment. What happens then? In that case, each in-use segment requires only 3 real storage frames and, if we just consider real storage, a 256 GB system should be able to support 21.3 TB of virtual storage. However, that won't happen because we would first encounter a CP storage management design limit at 8 TB.
So where does this 8 TB design limit come from? Since PGMBKs are pageable, they also need to be implemented in virtual storage. This special virtual storage is implemented in CP as 1 to 16 4G shared data spaces named PTRM0000 through PTRM000F. These are created as needed. Consequently, on most of today's systems you will just see the PTRM0000 data space. Information about these data spaces is provided on the DSPACESH screen (FCX134) in Performance Toolkit. Since each PTRM data space is 4G and since each PGMBK is 8K, each PTRM data space can contain up to (4*1024*1024)/8 = 524288 PGMBKs, which collectively map 524288 MB of virtual storage, which is 524288/(1024*1024) = 0.5 TB. So the 16 PTRM data spaces can map 8 TB. Unlike the other limits previously discussed, this is a hard limit. When exceeded, CP will abend.
It turns out that, for a system with 256 GB of real memory, the smallest average number of pages per in-use virtual storage segment before you reach the 8 TB limit is 6 pages per segment. Few, if any, real world workloads have that sparse of a reference pattern. Therefore, maximum in-use virtual storage will be limited by available real storage instead of the 8 TB design limit for nearly all configurations and workloads.
Now that we have this background information, let us take a look at some example measurement results.
Method
Measurements were obtained using a segment thrasher program. This program loops through all but the first 2 GB of the virtual machine's address space and updates just the first virtual page in each 1 MB segment. As such, it implements the limiting case of 1 resident page per segment discussed above.
Three measurements were obtained that cover z/VM 5.2 and z/VM 5.3 at selected numbers of users concurrently running this thrasher program. For all runs, each user virtual machine was configured as a 64G 1-way. The runs were done on a 2094-S38 z9 system with 120 GB of real storage. This was sufficiently large that there was no paging for any of the runs. Performance Toolkit data were collected.
Results and Discussion
The results are summarized in Table 2. The PTRM data are extracted from the DSPACESH (FCX134) screens in the Performance Toolkit report. The remaining numbers are from calculations based on the characteristics of the segment thrasher workload.
Table 2. Improved Virtual Storage Capacity
| z/VM Release | 5.2 | 5.3 | 5.3 |
| Segment Thrasher Users | 4 | 5 | 128 |
| Run ID | ST4TA190 | ST5U5180 | STMU5180 |
| PTRM Data Spaces | 1 | 1 | 16 |
| PTRM Total pages (p) | 1049000 | 1049000 | 16784000 |
| PTRM Resid pages (p) | 508000 | 635000 | 16216000 |
| PTRM <2G Resid pages (p) | 508000 | 0 | 0 |
| Pages Touched/User | 63488 | 63488 | 63488 |
| Total User Pages Touched | 253952 | 317440 | 8126464 |
| Total GB Virtual Touched | 248 | 310 | 7936 |
| PTRM GB Real Storage Used | 2.0 | 2.4 | 62.0 |
| User GB Real Storage Used | 1.0 | 1.2 | 31.0 |
| Total GB Real Stg Used | 3.0 | 3.6 | 93.0 |
| Notes: Segment thrasher workload; 64G thrasher users; thrasher updates 1 page/MB in last 62G; 2094-S38; 120G central storage; no expanded storage; z/VM 5.2 GA; z/VM 5.3 GA + RSU1 | |||
For z/VM 5.2, PTRM Total Pages is incorrect due to an error in CP monitor that has been corrected in z/VM 5.3. The correct value for PTRM Total Pages is shown in Table 2.
The first measurement is for z/VM 5.2 at the highest number of these 64 GB segment thrasher users that z/VM 5.2 can support. Note that PTRM Resid Pages is 508000 (rounded by Performance Tookit to the nearest thousand) and they all reside below the 2 GB line. Since there are 524288 frames in 2 GB, this means that PGMBKs are occupying 97% of real storage below the 2 GB line. Given this, it is not surprising that when a 5 user measurement was tried, the result was a soft hang condition due to extremely high paging and we were unable to collect any performance data.
Here is what the DSPACESH screen looks like for the first run. Of most interest are Total Pages (total pages in the data space) and Resid Pages (number of those pages that are resident in real storage). As mentioned above, Total Pages is incorrect for z/VM 5.2. It is reported as 524k but should be 1049k. For this, and the following DSPACESH screen shots, the other (unrelated) data spaces shown on this screen have been deleted.
FCX134  Run 2007/05/21 21:22:26         DSPACESH
                                        Shared Data Spaces Paging Activity
From 2007/05/21 21:12:47
To   2007/05/21 21:22:17
For    570 Secs 00:09:30                This is a performance report for GDLS
_____________________________________________________________________________
                                          <--------- Rate per Sec. --------->
 Owning                             Users
 Userid    Data Space Name          Permt Pgstl Pgrds Pgwrt X-rds X-wrt X-mig
 SYSTEM    PTRM0000                     0  .000  .000  .000  .000  .000  .000


(Report split for formatting reasons.  Ed.)


                                GDLSPRF1
                                CPU 2094-733   SN 46A8D
PRF1                            z/VM   V.5.2.0 SLU 0000
_______________________________________________________
 <------------------Number of Pages------------------>
       <--Resid--> <-Locked--> <-Aliases->
 Total Resid R<2GB  Lock L<2GB Count Lockd XSTOR  DASD
  524k  508k  508k     0     0     0     0     0     0
The second measurement shows results for z/VM 5.3 at 5 users. Note that all of the PGMBKs are now above 2 GB. Here is the DSPACESH screen for the second run:
FCX134  Run 2007/05/21 22:16:56         DSPACESH
                                        Shared Data Spaces Paging Activity
From 2007/05/21 22:07:14
To   2007/05/21 22:16:44
For    570 Secs 00:09:30                This is a performance report for GDLS
_____________________________________________________________________________
                                          <--------- Rate per Sec. --------->
 Owning                             Users
 Userid    Data Space Name          Permt Pgstl Pgrds Pgwrt X-rds X-wrt X-mig
 SYSTEM    PTRM0000                     0  .000  .000  .000  .000  .000  .000


(Report split for formatting reasons.  Ed.)


                                GDLSPRF1
                                CPU 2094-733   SN 46A8D
PRF1                            z/VM   V.5.3.0 SLU 0000
_______________________________________________________
 <------------------Number of Pages------------------>
       <--Resid--> <-Locked--> <-Aliases->
 Total Resid R<2GB  Lock L<2GB Count Lockd XSTOR  DASD
 1049k  635k     0     0     0     0     0     0     0
The third measurement shows results for z/VM 5.3 at 128 users. This puts in-use virtual storage almost up to the 8 TB design limit. Note that now all 16 PTRM data spaces are in use. Because only 1 page is updated per segment, all the PGMBK and user pages fit into the configured 120 GB of real storage. For this configuration, an equivalent measurement with just 2 updated pages per segment would have resulted in very high paging. Here is the DSPACESH screen for the third run. You can see the 16 PTRM data spaces and that all but 2 of them are full.
FCX134  Run 2007/05/21 23:01:03         DSPACESH
                                        Shared Data Spaces Paging Activity
From 2007/05/21 22:51:14
To   2007/05/21 23:00:44
For    570 Secs 00:09:30                This is a performance report for GDLS
_____________________________________________________________________________
                                          <--------- Rate per Sec. --------->
 Owning                             Users
 Userid    Data Space Name          Permt Pgstl Pgrds Pgwrt X-rds X-wrt X-mig
 SYSTEM    PTRM000A                     0  .000  .000  .000  .000  .000  .000
 SYSTEM    PTRM000B                     0  .000  .000  .000  .000  .000  .000
 SYSTEM    PTRM000C                     0  .000  .000  .000  .000  .000  .000
 SYSTEM    PTRM000D                     0  .000  .000  .000  .000  .000  .000
 SYSTEM    PTRM000E                     0  .000  .000  .000  .000  .000  .000
 SYSTEM    PTRM000F                     0  .000  .000  .000  .000  .000  .000
 SYSTEM    PTRM0000                     0  .000  .000  .000  .000  .000  .000
 SYSTEM    PTRM0001                     0  .000  .000  .000  .000  .000  .000
 SYSTEM    PTRM0002                     0  .000  .000  .000  .000  .000  .000
 SYSTEM    PTRM0003                     0  .000  .000  .000  .000  .000  .000
 SYSTEM    PTRM0004                     0  .000  .000  .000  .000  .000  .000
 SYSTEM    PTRM0005                     0  .000  .000  .000  .000  .000  .000
 SYSTEM    PTRM0006                     0  .000  .000  .000  .000  .000  .000
 SYSTEM    PTRM0007                     0  .000  .000  .000  .000  .000  .000
 SYSTEM    PTRM0008                     0  .000  .000  .000  .000  .000  .000
 SYSTEM    PTRM0009                     0  .000  .000  .000  .000  .000  .000


(Report split for formatting reasons.  Ed.)


                                GDLSPRF1
                                CPU 2094-733   SN 46A8D
PRF1                            z/VM   V.5.3.0 SLU 0000
_______________________________________________________
 <------------------Number of Pages------------------>
       <--Resid--> <-Locked--> <-Aliases->
 Total Resid R<2GB  Lock L<2GB Count Lockd XSTOR  DASD
 1049k 1049k     0     0     0     0     0     0     0
 1049k 1049k     0     0     0     0     0     0     0
 1049k 1049k     0     0     0     0     0     0     0
 1049k 1049k     0     0     0     0     0     0     0
 1049k 1049k     0     0     0     0     0     0     0
 1049k  505k     0     0     0     0     0     0     0
 1049k 1049k     0     0     0     0     0     0     0
 1049k 1049k     0     0     0     0     0     0     0
 1049k 1049k     0     0     0     0     0     0     0
 1049k 1049k     0     0     0     0     0     0     0
 1049k 1025k     0     0     0     0     0     0     0
 1049k 1049k     0     0     0     0     0     0     0
 1049k 1049k     0     0     0     0     0     0     0
 1049k 1049k     0     0     0     0     0     0     0
 1049k 1049k     0     0     0     0     0     0     0
 1049k 1049k     0     0     0     0     0     0     0
Maximum Supported Real Storage Increased to 256G
Because of the improved storage scalability that results from these storage management improvements, the maximum amount of real storage that z/VM supports has been raised from 128 GB to 256 GB. This section provides measurement results that illustrate z/VM 5.3's real storage scalability characteristics and compares them to z/VM 5.2.
Method
A pair of Apache Workload measurements was obtained on z/VM 5.2 in 64 GB and 128 GB of real storage. A corresponding pair of measurements was obtained on z/VM 5.3 plus additional measurements in 160 GB, 200 GB, and 239 GB (the largest size we could configure on our 256 GB 2094-S38 z9 system). The number of processors used for each measurement was chosen so as to be proportional to the real storage size, starting with 3 processors for the 64 GB runs. For each run, the number of Apache clients and servers were chosen such that workload could fully utilize all processors and all real storage would be used with a low level of storage overcommitment. AWM and z/VM Performance Toolkit data were collected for each measurement. Processor instrumentation data (not shown) were collected for some of the measurements.
Results and Discussion
The z/VM 5.2 results are summarized in Table 3 while the z/VM 5.3 results are summarized in Table 4. The following notes apply to both tables:
Table 3. Storage and Processor Scaling: z/VM 5.2
| Real Storage (GB) | 64 | 128 |
| Expanded Storage (GB) | 2 | 2 |
| Processors | 3 | 6 |
| Client Guests | 3 | 4 |
| Server Guests | 6 | 13 |
| AWM Sample Size | 500 | 500 |
| Run ID | APT064G1 | APT128G0 |
| Tx/sec (p) | 137.04 | 254.35 |
| Total CPU Util/Proc (p) | 98.6 | 97.7 |
| ITR (p) | 138.99 | 260.34 |
| Processor Ratio | 1.000 | 2.000 |
| Real Storage Ratio | 1.000 | 2.000 |
| ITR Ratio | 1.000 | 1.873 |
| ITR Ratio; base = 530 64G | 0.873 | 1.634 |
| Total CPU/Tx (p) | 21.585 | 23.047 |
| Emul CPU/Tx (p) | 12.921 | 14.053 |
| CP CPU/Tx (p) | 8.664 | 8.994 |
| Total CPU/Tx Ratio | 1.000 | 1.067 |
| Emul CPU/Tx Ratio | 1.000 | 1.088 |
| CP CPU/Tx Ratio | 1.000 | 1.038 |
| Pageins/CPU-sec (p) | 352 | 291 |
| Notes: Apache workload; 1G, 1-way SLES8 clients; 10G, 1-way SLES9 SP2 servers; random requests to 10000 1M webpage files; 2094-S38; z/VM 5.2 GA | ||
Table 4. Storage and Processor Scaling: z/VM 5.3
| Real Storage (GB) | 64 | 128 | 160 | 200 | 239 |
| Expanded Storage (GB) | 2 | 2 | 2 | 2 | 2 |
| Processors | 3 | 6 | 8 | 10 | 12 |
| Client Guests | 3 | 4 | 5 | 6 | 7 |
| Server Guests | 6 | 13 | 15 | 19 | 23 |
| AWM Sample Size | 500 | 500 | 500 | 700 | 700 |
| Run ID | APU064G1 | APU128G0 | APU160G2 | APU200G0 | APU239G2 |
| Tx/sec (p) | 158.33 | 292.36 | 409.78 | 462.61 | 531.81 |
| Total CPU Util/Proc (p) | 99.4 | 90.5 | 94.9 | 96.3 | 93.1 |
| ITR (p) | 159.29 | 323.05 | 431.80 | 480.38 | 571.22 |
| Processor Ratio | 1.000 | 2.000 | 2.667 | 3.333 | 4.000 |
| Real Storage Ratio | 1.000 | 2.000 | 2.500 | 3.125 | 3.734 |
| ITR Ratio | 1.000 | 2.028 | 2.711 | 3.016 | 3.586 |
| Total CPU/Tx (p) | 18.834 | 18.573 | 18.527 | 20.817 | 21.008 |
| Emul CPU/Tx (p) | 11.274 | 11.328 | 11.870 | 12.927 | 13.245 |
| CP CPU/Tx (p) | 7.560 | 7.245 | 6.657 | 7.890 | 7.763 |
| Total CPU/Tx Ratio | 1.000 | 0.986 | 0.984 | 1.105 | 1.115 |
| Emul CPU/Tx Ratio | 1.000 | 1.005 | 1.053 | 1.147 | 1.175 |
| CP CPU/Tx Ratio | 1.000 | 0.958 | 0.881 | 1.044 | 1.027 |
| Pageins/CPU-sec (p) | 441 | 517 | 49 | 19 | 95 |
| Notes: Apache workload; 1G, 1-way SLES8 clients; 10G, 1-way SLES9 SP2 servers; random requests to 10000 1M webpage files; 2094-S38; z/VM 5.3 GA + RSU1 | |||||
Figure 1 is based upon the measurements summarized in Table 3 and Table 4. It shows a plot of z/VM 5.2 internal throughput rate (ITR) ratio, z/VM 5.3 ITR ratio, and processor ratio as a function of real storage size. All ITR ratios are relative to the ITR measured for z/VM 5.3 in 64 GB. Likewise, the processor ratios are relative to the number of processors (3) used for the 64 GB measurements.
Figure 1. Storage and Processor Scaling
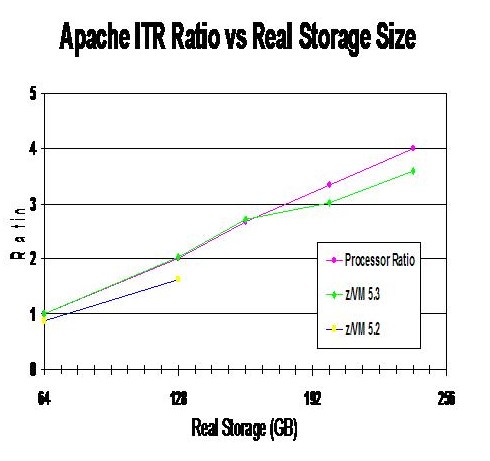 |
The ITR ratio results at 64 GB and 128G reflect the improved performance of z/VM 5.3 due to the storage management improvements. These same measurements also appear in Table 1.
If an ITR ratio curve were to exactly match the processor ratio
curve, that would represent perfect scaling of internal throughput
with number of processors. The z/VM 5.3 ITR ratio curve comes close
to that. Analysis of the hardware instrumentation data indicates that
z/VM 5.3's departure from perfect scaling is due to a combination of
normal MP lock contention and longer minidisk cache searches.