z/VM Two-Speed Monitoring
Abstract
With z/VM 7.4 Feature Pack 1 Fix Pack 0 (or higher) applied, the z/VM Two-Speed Monitoring feature provides a mechanism for collecting z/VM monitor data at two different sampling rates. It allows some monitor users to collect detailed data for a relatively brief period so it can be preserved if a situation arises that requires it for analysis, while allowing other guests to collect data less frequently and over longer periods for customary purposes such as real-time monitoring, capacity planning or feeding the z/VM Performance Data Pump. This avoids disrupting existing client processes that rely on Monitoring data collection.
Introduction
The z/VM Two-Speed Monitoring feature introduces a new operand, SUBINTERVAL to the MONITOR SAMPLE command. This enhancement allows multiple monitor data samples to be collected within a single monitoring interval and delivered to an enabled monitor user via the *MONITOR IUCV system service. The SUBINTERVAL option specifies the duration(in seconds) of the monitor sample subinterval. A monitor user connected to *MONITOR IUCV can request delivery of these subinterval samples; otherwise, they only receive data from the major interval samples. Applying z/VM 7.4 CP Feature Pack 1 Fix Pack 0 (or higher) will install new CPLOAD and MONWRITE modules. This feature lets the MONWRITE utility capture subinterval data when invoked with the SUBINT option.
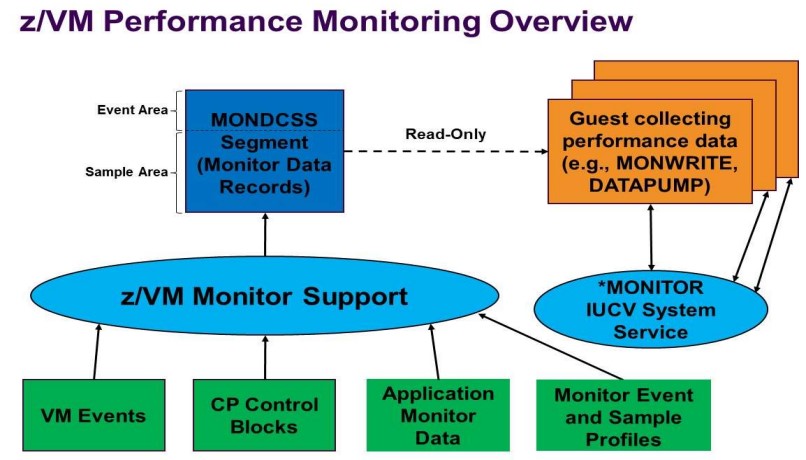
Figure 1 below shows the architecture of the z/VM Control Program performance monitoring facility. Users can configure more than one user/guest to collect the monitor data, any of which can be configured to collect the data at subinterval durations.
|
| Figure 1: z/VM Performance Monitoring architecture. |
The z/VM Two-Speed Monitoring facility lets multiple monitor users connected to the *MONITOR IUCV system service, to collect the metrics data at SUBINTERVAL level in addition to the default INTERVAL level. For instance, with MONITOR INTERVAL 1 MINUTE and MONITOR SUBINTERVAL 15, a sample is collected every 15 seconds. The monitor users that enables for SUBINTERVAL samples will receive the additional data, while other monitor users will receive only the once-per-minute interval sample. With a 60-second interval and a one-second RATE, permissible SUBINTERVAL values include 60, 30, 20, 15, 12, 10, 6, 5, 4, 3, 2, and 1 second. If the specified INTERVAL is not evenly divisible by the SUBINTERVAL or results in more than 255 subintervals in an interval, the SUBINTERVAL value is automatically set to match the INTERVAL. If a SAMPLE domain is enabled for the INTERVAL operand, monitor users can further retain or disable the domain explicitly using the SUBINTERVAL operand of the MONITOR SAMPLE ENABLE and MONITOR SAMPLE DISABLE commands.
In the example below, user domain data will not be included on SUBINTERVAL samples. USER domain data will be captured only every minute and not for the 15-second subintervals MONITOR SAMPLE ENABLE USER MONITOR SAMPLE INTERVAL 1 MINUTE MONITOR SAMPLE DISABLE SUBINTERVAL USER MONITOR SAMPLE SUBINTERVAL 15 SECONDRefer to Monitor Sample documentation for more details on use of SUBINTERVAL operand.
With SUBINTERVAL in effect, Due to increased sample rate we can expect more sample data collected in MONWRITE files of the monitor users enabled to collect the subinterval data. More frequent data may lead to more resource use by the monitor user, as shown in Table 1
Measurement methodology
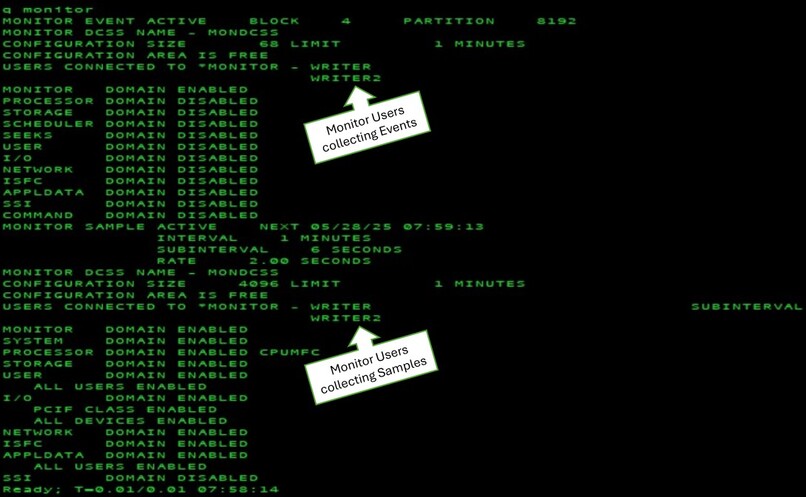
To view which monitor users have enabled SUBINTERVAL and INTERVAL, issue a "q monitor" command and look for the "USERS CONNECTED TO *MONITOR" section. It will list the monitor users that are connected to *MONITOR IUCV system service as showns in Figure 2
|
| Figure 2: Command output of "q monitor". |
The INTERIM report section of PerfKit, generated using a MONWRITE file collected by a user enabled to collect subinterval data will show the metrics duration with the configured SUBINTERVAL value.
The records count subsection of PerfKit report FCX155 (count and size of processed Monitor Records) will show higher numbers of records captured, compared to the number when subinterval data is not captured.
Workload Details
APACHE workload have been used to evaluate the z/VM Two-Speed Monitoring feature.System Setup: 1 LPAR with 9 IFLs 36GB central memory 10TB ECKD DASD
Workload configurations: Runtime: 600 sec. 9 Clients, 36 Servers
2 Monitor Users:WRITER & WRITER2
MONWRITE data is collected by both users and PerfKit is used to evaluate the runs as shown below.
Observations
Table 1 shows the runs that were identified for execution and analysis of z/VM Two-Speed Monitoring feature with feature pack applied.
| Table 1. Two-Speed Monitoring Performance Evaluation Table: | ||||||||||
| Scenario Number | 1 | 2 | 3 | 4 | 5* | 6* | 7 | |||
| (Without | ||||||||||
| PerfKit | feature | WRITER | WRITER2 | WRITER | WRITER2 | |||||
| Report(FCXxxx) | pack) | SUBINT | INTERVAL | INTERVAL | SUBINT | |||||
| Run Name/MONWRITE File Name | Sub-Section | RA6SC052 | RA1M6SF8 | RA5M10SL | RA1M1S10 | RA1M6SWR | W21M6SWR | RA1M6SWL | W21M6SWL | RA1M6SF6 |
| monitor user count | 1 | 1 | 1 | 1 | 2 | 2 | 2 | 2 | 1 | |
| INTERVAL Duration | 6 sec. | 1 min. | 5 min. | 1 min. | Disabled | 1 min. | 1 min. | Disabled | 1 min. | |
| SUBINTERVAL Duration | N/A | 6 sec. | 10 sec. | 1 sec. | 6 sec. | Disabled | Disabled | 6 sec. | 6 sec. | |
| HF Rate | 2 sec. | 2 sec. | 2 sec. | .03 sec. | 2 sec. | 2 sec. | 2 sec. | 2 sec. | 2 sec. | |
| Monitor user | WRITER | WRITER | WRITER | WRITER | WRITER | WRITER2 | WRITER | WRITER2 | WRITER | |
| ETR(External Throughput Rate) | 117033.06 | 117535.73 | 117305.77 | 117157.66 | 116831.04 | 118414.8 | 117307.26 | 117307.26 | 117865.71 | |
| ITR(Internal Throughput Rate) | 117976.9 | 117653.4 | 117423.2 | 117628.2 | 117773.2 | 121575.8 | 117307.3 | 117424.7 | 117983.7 | |
| SAMPLE Count | 102 | 102 | 62 | 610 | 102 | 12 | 12 | 102 | 102 | |
| FCX155 | Domain | overall | overall | overall | overall | overall | overall | overall | overall | IO & USER |
| (Count and Size of | Records (Count) | 504019 | 504445 | 306346 | 2972855 | 505028 | 61264 | 60274 | 505004 | 456195 |
| Processed Monitor Records) | Total Bytes (Count) | 168272630 | 168386828 | 102210912 | 993198347 | 168732360 | 20216680 | 19914773 | 168731364 | 150800132 |
| FCX112 | %CPU | .02 | .02 | .01 | .12 | .02 | 0 | 0 | .02 | .02 |
| (General User Resource Utilization) | Virtual IO/s DASD | 27.3 | 27.3 | 16.4 | 162 | 27.4 | 3.8 | 3.7 | 27.4 | 24.7 |
| Notes: *5th and 6th scenario has two MONWRITE files as WRITER and WRITER2 monitor users are capturing the metrics. | ||||||||||
Table 1 shows the experiments of different scenarios show that the variance of the ETR and ITR numbers are within ~5% compared to runs without the use of the feature.
Additionally, we performed monitor user specific metrics analysis using z/VM PerfKit. Below is the summary of observations:
A comparison of data of the runs without and with the use of SUBINTERVAL (scenarios 1 & 2 respectively) does not show a significant impact of using SUBINTERVAL on ETR, Virtual IO/s DASD, number of records, or CPU consumption, as shown in the table above.
Further, in the case of scenarios 3 & 4, the sample counts are 62 & 610 respectively (i.e. total runtime/subinterval => 600/10 & 600/1). The virtual IO/s DASD, records count, total bytes count are proportional to the number of samples collected.
In all scenarios, CPU utilization by monitor users remains proportional to the sample counts, and do not show additional overhead either with or without use of SUBINTERVAL. In the case of scenarios 5 & 6, for the monitor users with INTERVAL the CPU utilization is reported as 0, which could be due to very minimal utilization.
In scenarios 5 & 6 with two monitor users configured, one enabled for subinterval and another not, the virtual IO/s DASD, number of records, total bytes are proportional to the number of samples collected by each user.
Scenario 7 is the same as scenario 2, except that scenario 7 collects data for the domains IO & USER only. This difference is reflected in virtual IO/s DASD, number of records, and total bytes metrics.
Table 2 shows the analysis done using Perfkit report's data from Table 1.
| Table 2. Two-Speed Monitoring Performance Analysis Table: | |||||||||
| Scenario Number | 1 | 2 | 3 | 4 | 5* | 6* | 7 | ||
| (Without | |||||||||
| feature | WRITER | WRITER2 | WRITER | WRITER2 | |||||
| pack) | SUBINT | INTERVAL | INTERVAL | SUBINT | |||||
| Run name/MONWRITE File name | RA6SC052 | RA1M6SF8 | RA5M10SL | RA1M1S10 | RA1M6SWR | W21M6SWR | RA1M6SWL | W21M6SWL | RA1M6SF6 |
| Record/Sample | 4941.36 | 4945.54 | 4941.06 | 4873.53 | 4951.25 | 5105.33 | 5022.83 | 4951.02 | 4472.50 |
| Bytes/Record | 333.86 | 333.81 | 333.65 | 334.09 | 334.10 | 329.99 | 330.40 | 334.12 | 330.56 |
| Byte/Sample | 1649731.67 | 1650851.25 | 1648563.10 | 1628194.01 | 1654238.82 | 1684723.33 | 1659564.42 | 1654229.06 | 1478432.67 |
| %CPU/gB | 0.12 | 0.12 | 0.10 | 0.12 | 0.12 | 0.00 | 0.00 | 0.12 | 0.13 |
| (Virtual IO/s DASD)/mB | 0.16 | 0.16 | 0.16 | 0.16 | 0.16 | 0.19 | 0.19 | 0.16 | 0.16 |
| Notes: All the above mentioned units has been calculated using data from Run Names mentioned in Table 1: Record/Sample = Records Count/Samples Count, Bytes/Record = Total Bytes Count/Records Count, Byte/Sample = Total Byte Count/Samples Count, %CPU/gB = (%CPU Utilisation/Total Bytes Count)*(10**9), Virtual DASD IO/mB = (Virtual IO/s DASD/Total Bytes Count)*(10**6). *5th and 6th scenario has two MONWRITE files as WRITER and WRITER2 monitor users are capturing the metrics. | |||||||||
Table 2 shows a further analysis of the collected data wherein the cost of some activities are computed, such as Records/sample, Bytes/Record, Bytes/Sample, %CPU/gB, and Virtual DISK IO/mB. All these cost metrics show a constant ratio, indicating the almost negligible impact of enabling SUBINTERVAL on the resource utilization of monitor users.
In case of scenarios 5 & 6 for the monitor users collecting only interval data the %CPU utilization is 0 in Table 1, hence the %CPU/gB is also reported 0.
Summary
The z/VM Two-Speed Monitoring feature provides a mechanism to collect z/VM monitor data at two different sampling rates for delivery to specific monitor users. With this feature enabled, monitor users enabled for subinterval will collect additional sample data as configured, which can be used for diagnostic purposes. The resource utilized by the monitor users will be in proportion to the number of samples that are being captured.