Queued Direct I/O Support
Starting with the IBM G5 CMOS family of processors, a new type of I/O facility called the Queued Direct I/O Hardware Facility is available. This facility is on the OSA Express Adapter and supports the Gigabit Ethernet card, the ATM card, and the Fast Ethernet card.
The QDIO Facility is a functional element on S/390 and zSeries processors that allows a program (TCP/IP) to directly exchange data with an I/O device without performing traditional S/390 I/O instructions. Data transfer is initiated and performed by referencing main storage directly via a set of data queues by both the I/O device and TCP/IP. Once TCP/IP establishes and activates the data queues, there is minimal processor intervention required to perform the direct exchange of data. All data transfers are controlled and synchronized via a state-change-signaling protocol (state machine).
By using a state machine rather than a Start Subchannel instruction for controlling data transfer, the high overhead associated with starting and processing I/O interrupts by both hardware and software for data transfers is virtually eliminated. Thus the overhead reduction realized with a direct memory map interface will provide TCP/IP the capability to support high Gigabit bandwidth network speeds without substantially impacting other system processing.
This section presents and discusses measurement results that assess the performance of the Gigabit Ethernet using the QDIO support included in TCP/IP Level 3A0.
Methodology: The workload driver is an internal tool which can be used to simulate such bulk-data transfers as FTP and Tivoli Storage Manager. The data are driven from the application layer of the TCP/IP protocol stack, thus causing the entire networking infrastructure, including the OSA hardware and the TCP/IP procotol code, to be measured. It moves data between client-side memory and server-side memory, eliminating all outside bottlenecks such as DASD or tape.
A client-server pair was used in which the client received 10MB of data (inbound) or sent 10MB of data (outbound) with a one-byte response. Additional client-server pairs were added until maximum throughput was attained.
Figure 1. QDIO Performance Run Environment
           *------------------------*------------------------*
           |          VM_s          |          VM_c          |
           |    (server machine)    |    (client machine)    |
           |                        |                        |
           |                        |                        |
           *----*----*----*----*----+----*----*----*----*----*
           |    |    |    |    |    |    |    |    |    |    |
      *----*TCP/| 1  | 2  | 3  | 4  | 1  | 2  | 3  | 4  |TCP/*----*
      V    | IP |    |    |    |    |    |    |    |    | IP |    V
  *-----*  |    |    |    |    |    |    |    |    |    |    |  *-----*
  |OSA_s|  |    |    |    |    |    |    |    |    |    |    |  |OSA_c|
  |     |  *----*----*----*----*----+----*----*----*----*----*  |     |
  *--*--*  |                        |                        |  *--*--*
     |     |          CP            |          CP            |     |
     |     *------------------------*------------------------*     |
     |                    9672-ZZ7 processor                       |
     |                                                             |
     |                           Gbit                              |
     *------------------------>  Ethernet <------------------------*
                                 LAN
|
Each performance run, starting with 1 client-server pair and progressing to 4 client-server pairs, consisted of starting the server(s) on VM_s and then starting the client(s) on VM_c. The client(s) sent 10MB of data (outbound case) or received 10MB of data (inbound case) for 200 seconds. Monitor data were collected for 150 seconds of that time period. Data were collected only on the client machine. Another internal tool, called PSTATS, was used to gather performance data for the OSA adapters.
At least 3 measurement trials were taken for each case, and a representative trial was chosen to show in the results. A complete set of runs was done with the maximum transmission unit (MTU) set to 1500 and another set of runs was done with 8992 MTU. The CP monitor data for each measurement were reduced by VMPRF and by an exec that extracts pertinent fields from the TCP/IP APPLDATA monitor records (subrecords x'00' and x'04').
Throughput Results: The throughput results are summarized in Figure 2.
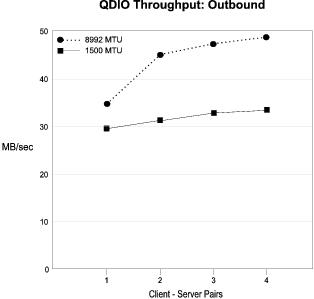 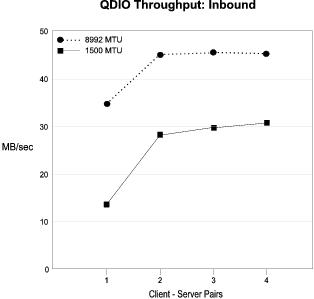 |
The graphs show maximum throughputs ranging from 30 MB/sec to 48 MB/sec, depending on the case, as compared to the maximum of about 125 MB/sec for the Gigabit Ethernet transport itself. CPU utilization in the TCPIP stack virtual machine is the primary constraint. The stack virtual machine can only run on one processor at a time. This limitation can be avoided by distributing the network on two or more TCPIP stack virtual machines. It appears that if the stack machine bottleneck were removed, the next bottleneck may be the adapter PCI bus capacity, if both stack machines are sharing the adapter.
Whenever we ran with 4 clients, the throughput rate appeared to be leveling off and that running 5 clients would not give us better throughput. We verified this by running with 5 clients for the Inbound 1500 MTU case and this was indeed true.
Better throughput was realized with 8992 MTU specified because of more efficient operation using the larger packet size. Fewer packets need to be exchanged and much of the overhead is on a per-packet basis.
Detailed Results: The following four tables contain additional results for each of the cases. Each of the following tables consists of two parts: the absolute results followed by the results expressed as ratios relative to the 1 client-server pair base case. The names used for the fields in the tables are the same as the names in the monitor data from which they were obtained. Following is an explanation of each field:
MB/sec (workload driver) | The workload driver produces a report which gives how many megabytes of data were sent (or received) during the run. It represents throughput from the application point of view. This measurement was what we chose to show in the Figure 2 graphs. |
MB/sec (monitor) | This field is calculated by adding two values, ioInOctets and ioOutOctets, 1 to get total bytes received and sent per second and dividing by 1Meg. It represents total throughput, including header bytes. |
TCPIP CPU Utilization | This field is calculated from the TCPIP entry in the USER_RESOURCE_UTILIZATION VMPRF report. 2 Using total CPU seconds for the TCPIP stack virtual machine divided by total time, we get the percent of the total time given to TCPIP. |
TCPIP total CPU msec/MB | This field was calculated from two of the previous fields (TCPIP CPU Utilization divided by MB/sec(driver)) to show the number of TCPIP milliseconds of time to MB of data ratio. |
TCPIP virtual CPU msec/MB | This field is calculated in the same manner as TCPIP total CPU msec/MB, using virtual CPU seconds for the TCPIP stack from the USER_RESOURCE_UTILIZATION VMPRF report. |
TCPIP CP CPU msec/MB | This is the difference of total CPU msec/MB less virtual CPU msec/MB yielding the time spent in CP on TCP/IP's behalf. |
OSA_c and OSA_s CPU (pstats) | This shows the CPU utilization, as reported by PSTATS, for the CPU on the OSA adapters. Several readings were taken during the run and these numbers reflect the average. |
OSA_c and OSA_s PCI (pstats) | This shows the utilization, as reported by PSTATS, for the OSA adapter PCI bus. Again, several readings were taken during each run and then averaged. |
FpspSize | The number of locked 4K pages held by the Fixed Page Storage Manager 3 is reported in TCP/IP Application Monitor records sub-record x'04'. |
FpspinUse | The number of locked 4K pages currently allocated to users of the fixed page storage pool is reported in TCP/IP Application Monitor records sub-record x'04'. |
ioInOctets/ioDirectRead | Both values are found in TCP/IP Application Monitor record sub-record x'00'. This calculation shows the number of bytes per QDIO inbound data transfer. |
ioOutOctets/ioDirectWrite | Both values are found in TCP/IP Application Monitor record sub-record x'00'. This calculation shows the number of bytes per QDIO outbound data transfer. |
ioDirectReads/MB | This is the same TCP/IP Application Monitor record information as before, divided by MB/sec from the workload driver, to show the number of QDIO inbound data transfers per megabyte. |
ioDirectWrites/MB | This is the same TCP/IP Application Monitor record information as before, divided by MB/sec from the workload driver, to show the number of QDIO outbound data transfers per megabyte. |
QDIOpolls/MB | QDIOpolls is found in the TCP/IP Application Monitor record, sub-record x'00' and contains the number of QDIO polling operations. This calculated value shows the number of polls per megabyte. |
ioPCI/MB | ioPCI is found in the TCP/IP Application Monitor record, sub-record x'00', and contains the number of PCI interrupts. This calculated value shows the number of interrupts per megabyte. |
Table 1. QDIO Run: Outbound 1500 MTU
Client-Server Pairs Run ID | 1 QNO11 | 2 QNO21 | 3 QNO32 | 4 QNO42 |
|---|---|---|---|---|
MB/sec (workload driver) MB/sec (monitor) | 29.98 31.82 | 31.4 33.38 | 33.39 35.45 | 33.58 35.54 |
TCPIP CPU Utilization TCPIP total CPU msec/MB TCPIP virtual CPU msec/MB TCPIP CP CPU msec/MB | 95.3 31.8 23.8 8.0 | 94.7 30.1 22.3 7.9 | 94.7 28.4 20.6 7.8 | 94.7 28.2 20.3 7.9 |
OSA_c_CPU (pstats) OSA_c_PCI (pstats) OSA_s_CPU (pstats) OSA_s_PCI (pstats) | 55 49 80 56 | 42 51 81 59 | 35 53 82 62 | 37 52 82 65 |
FpspSize FpspInUse | 295 163 | 295 154 | 303 162 | 303 151 |
ioInOctets/ioDirectRead ioOutOctets/ioDirectWrite | 86 17288 | 167 17681 | 220 18922 | 216 19710 |
ioDirectReads/MB ioDirectWrites/MB QDIOpolls/MB ioPCI/MB | 41.0 64.2 100.4 36.2 | 29.2 62.8 56.9 25.0 | 19.3 58.6 36.7 15.9 | 18.5 56.1 36.0 14.8 |
MB/sec (workload driver) MB/sec (monitor) | 1.000 1.000 | 1.047 1.049 | 1.114 1.114 | 1.120 1.117 |
TCPIP CPU Utilization TCPIP total CPU msec/MB TCPIP virtual CPU msec/MB TCPIP CP CPU msec/MB | 1.000 1.000 1.000 1.000 | 0.994 0.947 0.937 0.988 | 0.994 0.893 0.866 0.975 | 0.994 0.887 0.853 0.988 |
OSA_c_CPU (pstats) OSA_c_PCI (pstats) OSA_s_CPU (pstats) OSA_s_PCI (pstats) | 1.000 1.000 1.000 1.000 | 0.764 1.041 1.013 1.054 | 0.636 1.082 1.025 1.107 | 0.673 1.061 1.025 1.161 |
FpspSize FpspInUse | 1.000 1.000 | 1.000 0.945 | 1.027 0.994 | 1.027 0.926 |
ioInOctets/ioDirectRead ioOutOctets/ioDirectWrite | 1.000 1.000 | 1.942 1.023 | 2.558 1.095 | 2.512 1.140 |
ioDirectReads/MB ioDirectWrites/MB QDIOpolls/MB ioPCI/MB | 1.000 1.000 1.000 1.000 | 0.712 0.978 0.567 0.691 | 0.471 0.913 0.366 0.439 | 0.451 0.874 0.359 0.409 |
| Note: Gigabit Ethernet; 9672-ZZ7; z/VM 3.1.0 with 31-bit CP; TCP/IP 3A0; databufferpoolsize 32760; databufferlimits 10 10 | ||||
Not included in these tables, but noticed during the runs, the average inbound packet size and the average outbound packet size for all the runs was:
                            Inbound Outbound
                             Case    Case
                            *------*-------*
  inbound packet - 1500 MTU | 1532 |   84  |
  outbound packet- 1500 MTU |   84 | 1532  |
                            *------+-------*
  inbound packet - 8992 MTU | 9016 |   84  |
  outbound packet- 8992 MTU |   84 | 9015  |
                            *------*-------*
TCPIP utilization is either as high as it can go, or close to it, even for one client. The reason for throughput increase, as clients are added, is that stack efficiency increases with more clients. This is due to piggybacking effects as seen in the ioDirectReads/MB and ioDirectWrites/MB. For example, one client gets 41.0 direct reads for every megabyte and four clients get 18.5.
The performance statistics for the adapter cards show that the
CPU utilizations for both OSA_c and OSA_s are either flat or
improving, while the statistics for the PCI bus show increases that
are approximately proportional to the throughput rate.
Table 2. QDIO Run: Inbound 1500 MTU
Client-Server Pairs Run ID | 1 QNI11 | 2 QNI22 | 3 QNI32 | 4 QNI42 |
|---|---|---|---|---|
MB/sec (workload driver) MB/sec (monitor) | 13.3 13.79 | 28.11 30.00 | 29.92 32.44 | 30.38 32.23 |
TCPIP CPU Utilization TCPIP total CPU msec/MB TCPIP virtual CPU msec/MB TCPIP CP cpu msec/MB | 36.7 27.6 19.5 8.0 | 80.0 28.5 20.5 8.0 | 85.3 28.5 20.5 8.0 | 84.7 27.9 19.7 8.1 |
OSA_c_CPU (pstats) OSA_c_PCI (pstats) OSA_s_CPU (pstats) OSA_s_PCI (pstats) | 20 35 16 32 | 61 54 31 47 | 67 49 37 52 | 73 61 32 52 |
FpspSize FpspInUse | 303 152 | 303 167 | 303 167 | 303 152 |
ioInOctets/ioDirectRead ioOutOctets/ioDirectWrite | 25176 84 | 21995 145 | 23948 144 | 25823 134 |
ioDirect Reads/MB ioDirectWrites/MB QDIOpolls/MB ioPCI/MB | 43.1 31.1 75.7 32.0 | 50.7 27.9 68.7 31.6 | 47.3 25.7 66.8 31.1 | 43.0 24.7 64.8 30.2 |
MB/sec (workload driver) MB/sec (monitor) | 1.000 1.000 | 2.114 2.175 | 2.250 2.352 | 2.284 2.337 |
TCPIP CPU Utilization TCPIP total CPU msec/MB TCPIP virtual CPU msec/MB TCPIP CP cpu msec/MB | 1.000 1.000 1.000 1.000 | 2.180 1.033 1.051 1.000 | 2.324 1.033 1.051 1.000 | 2.308 1.011 1.010 1.013 |
OSA_c_CPU (pstats) OSA_c_PCI (pstats) OSA_s_CPU (pstats) OSA_s_PCI (pstats) | 1.000 1.000 1.000 1.000 | 3.050 1.543 1.938 1.469 | 3.350 1.400 2.313 1.625 | 3.650 1.743 2.000 1.625 |
FpspSize FpspInUse | 1.000 1.000 | 1.000 1.099 | 1.000 1.099 | 1.000 1.000 |
ioInOctets/ioDirectRead ioOutOctets/ioDirectWrite | 1.000 1.000 | 0.874 1.726 | 0.951 1.714 | 1.026 1.595 |
ioDirect Reads/MB ioDirectWrites/MB QDIOpolls/MB ioPCI/MB | 1.000 1.000 1.000 1.000 | 1.176 0.897 0.908 0.988 | 1.097 0.826 0.882 0.972 | 0.998 0.794 0.856 0.944 |
| Note: Gigabit Ethernet; 9672-ZZ7; z/VM 3.1.0 with 31-bit CP; TCP/IP 3A0; databufferpoolsize 32760; databufferlimits 10 10 | ||||
The inbound case had much lower throughput with one client than the outbound case. The reason for this is not understood at this time. The multi-client inbound throughputs are more similar to the corresponding outbound throughputs.
Unlike the outbound run, TCPIP efficiency did not increase
appreciably with an increasing number of clients.
Instead, the increase in throughput comes from the overlapping
of requests from multiple clients.
Table 3. QDIO Run: Outbound 8992 MTU
Client-Server Pairs Run ID | 1 QJO11 | 2 QJO21 | 3 QJO31 | 4 QJO41 |
|---|---|---|---|---|
MB/sec (workload driver) MB/sec (monitor) | 35.39 35.98 | 43.63 44.14 | 47.53 47.94 | 48.13 48.39 |
TCPIP CPU Utilization TCPIP total CPU msec/MB TCPIP vitual CPU msec/MB TCPIP CP cpu msec/MB | 88.0 24.9 16.6 8.3 | 92.7 21.2 13.1 8.1 | 91.3 19.2 11.1 8.1 | 88.7 18.4 10.4 8.0 |
OSA_c_CPU (pstats) OSA_c_PCI (pstats) OSA_s_CPU (pstats) OSA_s_PCI (pstats) | 22 54 24 52 | 18 63 28 61 | 11 65 23 67 | 9 67 24 68 |
FpspSize FpspInUse | 279 151 | 279 167 | 347 160 | 421 220 |
ioInOctets/ioDirectRead ioOutOctets/ioDirectWrite | 86 16734 | 126 25995 | 156 33137 | 160 36660 |
ioDirectReads/MB ioDirectWrites/MB QDIOpolls/MB ioPCI/MB | 40.3 63.5 97.5 32.8 | 25.7 40.7 61.6 21.8 | 13.9 31.9 31.5 11.4 | 10.0 28.7 21.0 8.1 |
MB/sec (workload driver) MB/sec (monitor) | 1.000 1.000 | 1.233 1.227 | 1.343 1.332 | 1.360 1.345 |
TCPIP CPU Utilization TCPIP total CPU msec/MB TCPIP vitual CPU msec/MB TCPIP CP cpu msec/MB | 1.000 1.000 1.000 1.000 | 1.053 0.851 0.789 0.976 | 1.038 0.771 0.669 0.976 | 1.008 0.739 0.627 0.964 |
OSA_c_CPU (pstats) OSA_c_PCI (pstats) OSA_s_CPU (pstats) OSA_s_PCI (pstats) | 1.000 1.000 1.000 1.000 | 0.818 1.167 1.167 1.173 | 0.500 1.204 0.958 1.288 | 0.409 1.241 1.000 1.308 |
FpspSize FpspInUse | 1.000 1.000 | 1.000 1.106 | 1.244 1.060 | 1.509 1.457 |
ioInOctets/ioDirectRead ioOutOctets/ioDirectWrite | 1.000 1.000 | 1.465 1.553 | 1.814 1.980 | 1.860 2.191 |
ioDirectReads/MB ioDirectWrites/MB QDIOpolls/MB ioPCI/MB | 1.000 1.000 1.000 1.000 | 0.638 0.641 0.632 0.665 | 0.345 0.502 0.323 0.348 | 0.248 0.452 0.215 0.247 |
| Note: Gigabit Ethernet; 9672-ZZ7; z/VM 3.1.0 with 31-bit CP; TCP/IP 3A0; databufferpoolsize 32760; databufferlimits 10 10 | ||||
8992 MTU packet sizes gave higher efficiencies than the 1500 MTU case. Notice that the number of direct reads per megabyte went from 18.5 for 4 clients with 1500 MTU to 10.0 for the same number of clients with 8992 MTU. Similar results were seen for the direct writes.
These efficiencies can also be seen in the performance statistics for the adapter card as well as TCPIP total CPU milliseconds per megabyte. The numbers are significantly lower than the corresponding numbers for the 1500 MTU case.
In addition to the differences noted, there
are also similarities between the 8992 MTU case and the 1500
MTU case. Each shows that the TCPIP stack is the limiting factor and
that the increase in the number of clients has a proportional increase
in efficiency.
Table 4. QDIO Run: Inbound 8992 MTU
Client-Server Pairs Run ID | 1 QJI11 | 2 QJI21 | 3 QJI31 | 4 QJI41 |
|---|---|---|---|---|
MB/sec (workload driver) MB/sec (monitor) | 34.6 35.07 | 44.68 45.12 | 44.72 45.20 | 44.61 45.07 |
TCPIP CPU Utilization TCPIP total CPU msec/MB TCPIP virtual CPU msec/MB TCPIP CP CPU msec/MB | 77.3 22.4 14.8 7.5 | 92.7 20.7 13.3 7.5 | 91.3 20.4 12.8 7.6 | 91.3 20.5 12.9 7.6 |
OSA_c_CPU (pstats) OSA_c_PCI (pstats) OSA_s_CPU (pstats) OSA_s_PCI (pstats) | 18 51 10 52 | 23 63 10 63 | 21 65 8 63 | 20 64 7 63 |
FpspSize FpspInUse | 421 152 | 421 184 | 421 168 | 421 167 |
ioInOctets/ioDirectRead ioOutOctets/ioDirectWrite | 15888 84 | 16177 105 | 15304 129 | 14872 152 |
ioDirect Reads/MB ioDirectWrites/MB QDIOpolls/MB ioPCI/MB | 66.7 28.6 81.7 35.9 | 65.4 17.0 59.5 28.3 | 69.2 11.0 51.5 25.5 | 71.1 8.3 49.8 24.7 |
MB/sec (workload driver) MB/sec (monitor) | 1.000 1.000 | 1.291 1.287 | 1.292 1.289 | 1.289 1.285 |
TCPIP CPU Utilization TCPIP total CPU msec/MB TCPIP virtual CPU msec/MB TCPIP CP CPU msec/MB | 1.000 1.000 1.000 1.000 | 1.199 0.924 0.899 1.000 | 1.181 0.911 0.865 1.013 | 1.181 0.915 0.872 1.013 |
OSA_c_CPU (pstats) OSA_c_PCI (pstats) OSA_s_CPU (pstats) OSA_s_PCI (pstats) | 1.000 1.000 1.000 1.000 | 1.278 1.235 1.000 1.212 | 1.167 1.275 0.800 1.212 | 1.111 1.255 0.700 1.212 |
FpspSize FpspInUse | 1.000 1.000 | 1.000 1.211 | 1.000 1.105 | 1.000 1.099 |
ioInOctets/ioDirectRead ioOutOctets/ioDirectWrite | 1.000 1.000 | 1.018 1.250 | 0.963 1.536 | 0.936 1.810 |
ioDirect Reads/MB ioDirectWrites/MB QDIOpolls/MB ioPCI/MB | 1.000 1.000 1.000 1.000 | 0.981 0.594 0.728 0.788 | 1.037 0.385 0.630 0.710 | 1.066 0.290 0.610 0.688 |
| Note: Gigabit Ethernet; 9672-ZZ7; z/VM 3.1.0 with 31-bit CP; TCP/IP 3A0; databufferpoolsize 32760; databufferlimits 10 10 | ||||
A single client with 8992 MTU has the same low throughput and utilization characteristics as the 1500 MTU case, although not as pronounced.
The maximum throughput was essentially reached at two clients. Also, note that the TCPIP CPU utilization never goes higher after 2 clients.
Footnotes:
- 1
- ioInOctets and ioOutOctets are found in the TCP/IP Application Monitor Data, sub-record x'00'. The description for these, and all other data found in the TCP/IP Application Monitor Data, can be found in the z/VM: Performance book, Appendix F.
- 2
- This is described in Chapter 6 of the Performance and Reporting Facility User's Guide and Reference.
- 3
- This service, new to TCP/IP Level 3A0, provides a new storage pool of 4K pages that have been locked by Diagnose 98. QDIO uses the FPSM to provide a cache of locked pages for fast I/O buffer management. Since the typical QDIO data transfer is faster than traditional I/O, the active life of a data buffer is short lived, thereby causing the same buffers to be quickly reused for the next data transfer. A new optional statement in the TCP/IP configuration file called FIXEDPAGESTORAGEPOOL can be used to manually tune the FPSM.