Virtual Switch Link Aggregation
Abstract
Link aggregation is designed to allow you to combine multiple physical OSA-Express2 ports into a single logical link for increased bandwidth and for nondisruptive failover in the event that a port becomes unavailable. Having the ability to add additional cards can result in increased throughput, particularly when the OSA card is being fully utilized. Measurement results show an increase in throughput from 6% to 15% for a low-utilization OSA card to an increase in throughput from 84% to 100% for a high-utilization OSA card, as well as reductions in CPU time ranging from 0% to 22%.
Introduction
The Virtual Switch (VSwitch) is a guest LAN technology that bridges real hardware and virtual networking LANs, offering external LAN connectivity to the guest LAN environment. The VSwitch operates with virtual QDIO adapters (OSA-Express), and external LAN connectivity is available only through OSA-Express adapters in QDIO mode. Like the OSA-Express adapter, the VSwitch supports the transport of either IP packets or Ethernet frames. You can find out more detail about VSwitches in the z/VM Connectivity book.
In 5.3.0 the VSwitch, configured for Ethernet frames (layer 2 mode), now supports aggregating of 1 to 8 OSA-Express2 adapters with a switch that supports the IEEE 802.3ad Link Aggregation specification.
Link aggregation support is exclusive to the IBM z9 EC GA3 and z9 BC GA2 servers and is applicable to the OSA-Express2 features when configured as CHPID type OSD (QDIO). This support makes it possible to dynamically add or remove OSA ports for "on-demand" bandwidth, transparent recovery of a failed link within the aggregated group, and the ability to "remove" an OSA card temporarily for upgrades without bringing down the virtual network.
One of the key items in link aggregation support is the load balancing done on the VSwitch. All active OSA-Express2 ports within a VSwitch port group are used in the transmission of data between z/VM's VSwitch and the connected physical switch. The VSwitch logic will attempt to distribute the load equally across all the ports within the group. The actual load balancing achieved will depend on the frame rate of the different conversations taking place across the OSA-Express2 ports and the load balance interval specified by the SET PORT GROUP INTERVAL command. It is also important to know that the VSwitch cannot control what devices are used for the inbound data -- the physical switch controls that. The VSwitch can only affect which devices are used for the outbound data. For further details about load balancing refer to the z/VM Connectivity book.
Method
The measurements were done on a 2094-733 with 4 dedicated processors in each of two LPARs.
A 6509 Cisco switch was used for the measurements in this report. It was configured with standard layer 2 ports for the base measurements and the following commands were issued in order to configure the group/LACP ports for the group measurements.
- configure terminal
- interface range gigabitEthernet 2/23 -24
- no ip address
- channel-protocol lacp
- channel-group 1 mode active
- exit
- interface port-channel 1
- switchport trunk encapsulation dot1q
- switchport mode trunk
- no shutdown
- end
The Application Workload Modeler (AWM) was used to drive the workload for VSwitch. (Refer to AWM Workload for more information.) A complete set of runs was done for RR and STR workloads for each of the following: base 5.3.0 with 1 Linux guest client/server pair, base 5.3.0 with 2 Linux guest client/server pairs, 5.3.0 link aggregation (hereafter referred to as group) with 1 Linux guest cleint/server pair, and 5.3.0 group with 2 Linux guest client/server pairs. In addition, these workloads were run using 1 OSA card and again using 2 OSA cards. The following figures show the specific environment(s) for the measurements referred to in this section.
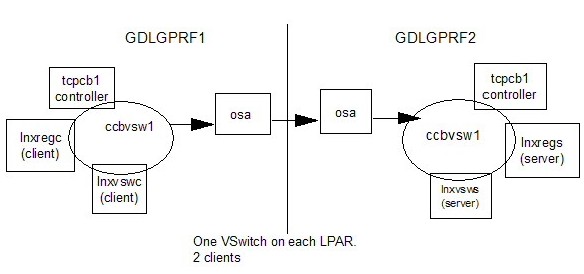
Figure 1. Base:VSwitch-One OSA-Environment
|
The base 5.3.0 VSwitch - one OSA environment in Figure 1 has 2 client Linux guests on the GDLGPRF1 LPAR that connect to the corresponding server Linux guests on the GDLGPRF2 LPAR through 1 OSA. Linux client lnxregc connects to Linux server lnxregs and Linux client lnxvswc connects to Linux server lnxvsws.
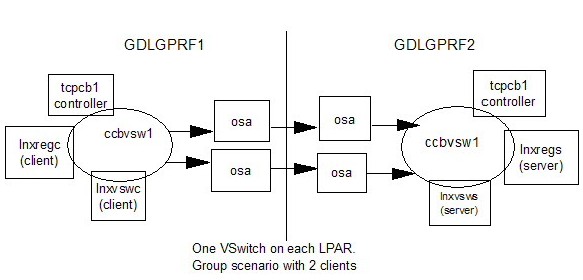
Figure 2. Group VSwitch-Two OSAs-Environment
|
After running base measurements, the VSwitches on each side were defined in a group (defined with SET PORT GROUP) with 2 OSA cards. Figure 2 illustrates the group scenario environment where the two client Linux guests connect to their corresponding server Linux guests using VSwitches that now have two OSAs each.
The following factors were found to have an influence on the throughput and overall performance of the group measurements:
- LACP on
- For the measurements done for this report, this was found to have a beneficial impact on results. If you decide to turn LACP on, it needs to be specified on the VSwitch definition and on the physical switch.
- load balancing interval
- This is a parameter on the SET PORT GROUP command. For the measurements shown in this report, the interval was set to 30. This value should be based on your workload. Refer to the z/VM Connectivity book for further details.
- load balancing on the physical switch
- dst-mac was found to give the best performance by the physical switch for these measurements.
- a unique mac prefix and unique mac suffix
- A unique mac prefix should be defined in the system config file (rather than letting VSwitch assign a number) and a unique mac suffix for each user should be defined in the system directory. The mac address influences a distribution algorithm based on the last three bits so try not to give sequential numbers.
- limit queuestorage to 1M
- For queuestorage, smaller is better. One of the side effects of using SYSTEMMP are the cache misses on buffers. Therefore, the bigger the number for queuestorage, the more likely it is to see lower performance due to the cache misses. The default (as documented in the DEFINE VSWITCH command) is 8M. For these measurements, 1M was the used.
Results and Discussion
Measurements and results shown below were done to compare 5.3.0 VSwitch non-group with 5.3.0 VSwitch group. These measurements were done using 2 client Linux guests in one LPAR with 2 corresponding server Linux guests in the other LPAR. For both non-group and group, individual measurements were taken simulating 1, 10 and 50 client/server connections between the client and servers across LPARs. The detailed measurements can be found at the end of this section.
The following charts show how adding an OSA card to a VSwitch can improve bandwidth. The measurements shown are for the case of 2 client and server guests, 10 client/server connections, and MTU 1492.
Figure 3. Performance Benefit of Multiple OSA Cards
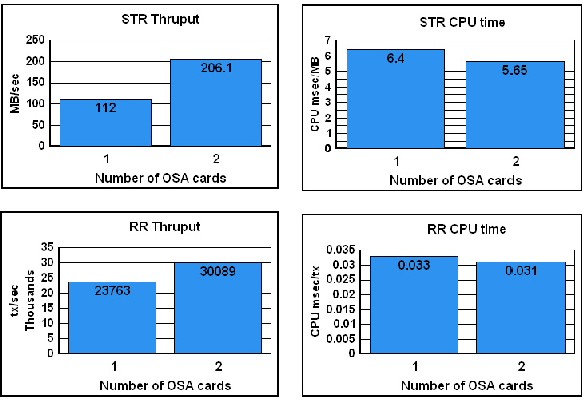 |
This improvement may not be seen in all cases. It will depend on the workload (how much data, how many different targets, whether any other bottlenecks are present such as CPU, etc.) However, it does show the possibilities. In the case shown for STR, the OSA card was fully loaded. In fact, there was enough traffic trying to go across one card that the second card was also fully loaded when it was added. (Note: The OSA/SF product can be used to determine whether the OSA card is running at capacity.) For the detailed measurements see Table 1.
The RR measurements (see Table 2) also show improvement when the second card is added. Since, in this case, there were two target macs (the two servers), traffic flowed over both cards, resulting in a 27% increase in throughput when simulating 10 client/server connections.
Additional measurements, not shown here, were done to see what effect there would be if an additional Linux client/server pair were added. For the RR workload, which does not send a lot of data, the results were as expected. In the case of the STR workload, the measurements produced similar results as seen with the 2 Linux client/server pair case with the simulated 1 and 10 client-server connections. However, the STR workload results with the three Linux client/server pairs become unpredicatable when using the simulated 50 client-server connections. This phenomenon is not well understood and is being investigated.
Monitor Changes
A number of new monitor records were added in 5.3.0 which show guest LAN activity. These are especially useful for determining which guests are sending and receiving data. The Performance Toolkit was also changed to show these new records. The records, along with the existing VSwitch record (Domain 6 Record 21) are very useful for seeing whether the network activity is balanced, who is actively involved in sending and receiving, and the OSA millicode level.
The following is an example of the Performance Toolkit VSWITCH screen (FCX240):
STR, both OSAs fully loaded
 FCX240      Data for 2007/04/13  Interval 15:34:10 - 15:34:40    Monitor
 ____ .         .              .       .      .      .      .      .      .
                          Q Time  <--- Outbound/s ---> <--- Inbound/s ---->
                          S  Out   Bytes <--Packets-->  Bytes <--Packets-->
 Addr     Name  Controlr  V  Sec  T_Byte T_Pack T_Disc R_Byte R_Pack R_Disc
 >>      System       <<  1  300  677431  10262      0   123M  81588      0
 28BA CCBVSW1   TCPCB1    1  300  677585  10265      0   123M  81595      0
 2902 CCBVSW1   TCPCB1    1  300  677276  10260      0   123M  81581      0
Note: In this, and the following examples, the rightmost columns have been truncated.
Here is the Performance Toolkit VNIC screen (FCX269) for the same measurement.
FCX269      Data for 2007/04/13  Interval 13:20:11 - 13:20:41
____ .                 .        .    .                   .      .      .      .
                                                    <--- Outbound/s ---> <--- Inbound
     <---  LAN ID  --> Adapter  Base Vswitch  V      Bytes <  Packets  >  Bytes <  Pa
Addr Owner    Name     Owner    Addr Grpname  S L T T_Byte T_Pack T_Disc R_Byte R_Pac
<<  -----------------   System   --------------  >> 169398   2566     .0 30745k  2040
0500 SYSTEM   CCBFTP   TCPCB1   0500 ........   3 Q     .0     .0     .0     .0     .
B000 SYSTEM   LNXSRV   TCPIP    B000 ........   3 Q     .0     .0     .0     .0     .
F000 SYSTEM   LCSNET   TCPIP    F000 ........   3 H     .0     .0     .0     .0     .
F000 SYSTEM   CCBVSW1  LNXVSWC  F000 CCBGROUP X 2 Q 677405  10262     .0   123M  8159
F000 SYSTEM   CCBVSW1  LNXREGC  F000 CCBGROUP X 2 Q 677782  10268     .0   123M  8160
F004 SYSTEM   CCBFTP   LNXVSWC  F004 ........   3 Q     .0     .0     .0     .0     .
F004 SYSTEM   CCBFTP   LNXREGC  F004 ........   3 Q     .0     .0     .0     .0     .
F010 SYSTEM   LOCALNET TCPIP    F010 ........   3 H     .0     .0     .0     .0     .
F010 SYSTEM   LOCALNET TCPIP    F010 ........   3 H     .0     .0     .0     .0     .
Here is an example of the Performance Toolkit VSWITCH screen (FCX240) showing network activity.
STR, one OSA loaded the other is not
FCX240      Data for 2007/04/13  Interval 15:42:22 - 15:42:52    Monitor
____ .         .              .       .      .      .      .      .      .
                         Q Time  <--- Outbound/s ---> <--- Inbound/s ---->
                         S  Out   Bytes <--Packets-->  Bytes <--Packets-->
Addr     Name  Controlr  V  Sec  T_Byte T_Pack T_Disc R_Byte R_Pack R_Disc
>>      System       <<  1  300  698991  10589      0   100M  66628      0
28BA CCBVSW1   TCPCB1    1  300       5      0      0   123M  81951      0
2902 CCBVSW1   TCPCB1    1  300   1398k  21179      0 77124k  51305      0
At first glance, it would seem that the load is not balanced. However, as noted earlier in this section, the VSwitch connot control which devices are used for the inbound data. This is handled by the physical switch. In the example above, the load is actually balanced. Since the bulk of the inbound data is handled by device 28BA, the VSwitch has directed the outbound data to the 2902 device.
Detailed Results
The following tables show more detail for the MTU 1492, 10 simulated client/server connection runs discussed above. In addition, they show STR results for MTU 8992, and both the STR and RR results for the 1 and 50 simulated client/server connection (labeled 'Number of Threads') cases.
| MTU 1492 | |||
| Number of threads | 01 | 10 | 50 |
| 5.3.0 (non-group, 1 OSA) | |||
| runid | lvsn0102 | lvsn1002 | lvsn5002 |
| MB/sec | 82.4 | 112.0 | 111.9 |
| Total CPU msec/MB | 5.54 | 6.40 | 7.15 |
| Emul CPU msec/MB | 2.77 | 3.36 | 3.90 |
| CP CPU msec/MB | 2.77 | 3.04 | 3.25 |
| Approx. OSA card utilization | 70% | 95% | 95% |
| 5.3.0 (group, 2 OSAs) | |||
| runid | lvsn0102 | lvsn1002 | lvsn5002 |
| MB/sec | 94.7 | 206.1 | 216.9 |
| Total CPU msec/MB | 5.41 | 5.65 | 5.57 |
| Emul CPU msec/MB | 2.62 | 3.03 | 3.01 |
| CP CPU msec/MB | 2.79 | 2.62 | 2.56 |
| Approx. OSA card utilization | 40% | 85% | 90% |
| % diff | |||
| MB/sec | 15% | 84% | 94% |
| Total CPU msec/MB | -2% | -12% | -22% |
| Emul CPU msec/MB | -5% | -10% | -23% |
| CP CPU msec/MB | 1% | -14% | -21% |
| MTU 8992 | |||
| Number of threads | 01 | 10 | 50 |
| 5.3.0 (nongroup) | |||
| runid | lvsj0102 | lvsj1002 | lvsj5002 |
| MB/sec | 70.7 | 118 | 117.8 |
| Total CPU msec/MB | 3.80 | 3.66 | 3.91 |
| Emul CPU msec/MB | 1.70 | 1.73 | 1.94 |
| CP CPU msec/MB | 2.10 | 1.93 | 1.97 |
| Approx. OSA card utilization | 60% | 100% | 100% |
| 5.3.0 (group) | |||
| runid | lvsj0102 | lvsj1002 | lvsj5002 |
| MB/sec | 74.6 | 235.9 | 235.6 |
| Total CPU msec/MB | 3.38 | 3.22 | 3.38 |
| Emul CPU msec/MB | 1.45 | 1.54 | 1.66 |
| CP CPU msec/MB | 1.93 | 1.68 | 1.72 |
| Approx. OSA card utilization | 30% | 100% | 100% |
| % diff | |||
| MB/sec | 6% | 100% | 100% |
| Total CPU msec/MB | -11% | -12% | -14% |
| Emul CPU msec/MB | -15% | -11% | -14% |
| CP CPU msec/MB | -8% | -13% | -13% |
| 2094-733; z/VM 5.3.0; Linux 2.6.14-16 | |||
| MTU 1492 | |||
| Number of threads | 01 | 10 | 50 |
| 5.3.0 (non-group, 1 OSA) | |||
| runid | lvrn0102 | lvrn1002 | lvrn5002 |
| Tx/sec | 4488.5 | 23763.0 | 42049.8 |
| Total CPU msec/Tx | .048 | .033 | .025 |
| Emul CPU msec/Tx | .025 | .020 | .016 |
| CP CPU msec/Tx | .023 | .013 | .009 |
| 5.3.0 (group, 2 OSAs) | |||
| runid | lvrn0102 | lvrn1002 | lvrn5002 |
| Tx/sec | 4709.5 | 30089.0 | 65916.0 |
| Total CPU msec/Tx | .048 | .031 | .025 |
| Emul CPU msec/Tx | .022 | .018 | .016 |
| CP CPU msec/Tx | .026 | .013 | .009 |
| % diff | |||
| Tx/sec | 5% | 27% | 57% |
| Total CPU msec/Tx | 0% | -6% | 0% |
| Emul CPU msec/Tx | -12% | -10% | 0% |
| CP CPU msec/Tx | 13% | 0% | 0% |
| 2094-733; z/VM 5.3.0; Linux 2.6.14-16 | |||