HiperSockets
Starting with the z/900 Model 2064, z/Architecture provides a new type of I/O device called HiperSockets. As an extension to the Queued Direct I/O Hardware Facility, HiperSockets provides a high-bandwidth method for programs to communicate within the same logical partition (LPAR) or across any logical partition within the same Central Electronics Complex (CEC) using traditional TCP/IP socket connections.VM Guest LAN support, also in z/VM 4.2.0, provides the capability for a VM guest to define a virtual HiperSocket adapter and connect it with other virtual network adapters on the same VM host system to form an emulated LAN segment. While real HiperSockets support requires a z/800 or z/900, VM Guest LAN support is available on G5 and G6 processors as well.
This section summarizes the results of a performance evaluation of TCP/IP VM comparing the new HiperSockets and Guest LAN support with existing QDIO, IUCV and VCTC support.
Methodology: An internal tool was used to drive request-response (RR), connect-request-response (CRR) and streaming (S) workloads. The request-response workload consisted of the client sending 200 bytes to the server and the server responding with 1000 bytes. This interaction lasted for 200 seconds. The connect-request-response workload had the client connecting, sending 64 bytes to the server, the server responding with 8K and the client then disconnecting. This same sequence was repeated for 200 seconds. The streaming workload consisted of the client sending 20 bytes to the server and the server responding with 20MB. This sequence was repeated for 400 seconds.
Each workload was run using IUCV, VCTC, HiperSockets, Guest LAN and QDIO connectivity at various MTU sizes. For IUCV, VCTC and QDIO 1500 and 8992 MTU sizes were chosen. For HiperSockets and Guest LAN 8K, 16K, 32K and 56K MTU sizes were used. For HiperSockets, the Maximum Frame Size (MFS) specified on the CHPID definition is also important. The MFS defined for the system were 16K, 24K, 40K and 64K and are associated with MTU sizes of 8K, 16K, 32K and 56K respectively. All measurements included 1, 5, 10, 20 and 50 client-server pairs. The clients and servers ran on the same VM system with a TCPIP stack for the clients and a separate TCPIP stack for the servers.
The measurements were done on a 2064-109 in an LPAR with 2 dedicated processors. The LPAR had 1GB central storage and 2GB expanded storage. APARs VM62938 and PQ51738, which enable HiperSockets support, were applied. CP monitor data was captured during the measurement run, and reduced using VMPRF.
Specifying DATABUFFERLIMITS 10 10 in the TCPIP configuration file helped to increase the throughput. It was also necessary to specify 65536 for DATABUFFERPOOLSIZE and LARGEENVELOPEPOOLSIZE to support the larger MTUs.
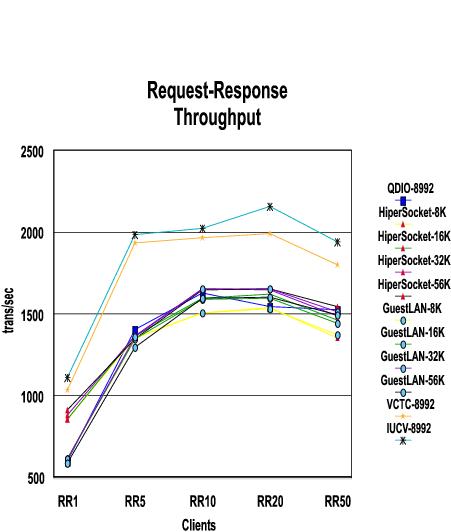
Results: The following charts show, for each workload (RR, CRR and streaming), throughput and CPU time. Each chart has a line for each connectivity/MTU pair measured. Throughput for all cases shows generally the same trend of reaching a plateau and then trailing off. The corresponding CPU time, in general, shows the same pattern where time decreases until the throughput plateau is reached. As throughput trails off, the time increases showing we've passed the optimum point. Specific details are mentioned for each workload after the charts for that workload.
 |
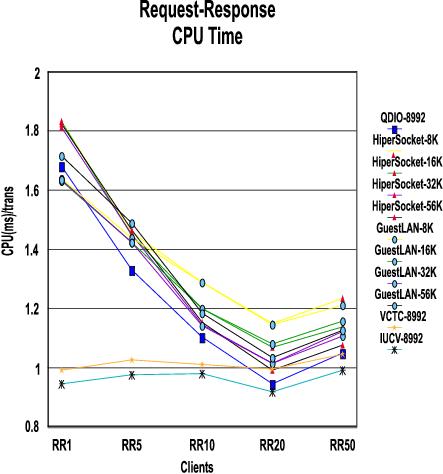 |
The CPU Time shows that while the legacy connectivity types (IUCV and VCTC) have basically the same time no matter how many client-server pairs are running, the others do gain efficiency as the number of connections increases until about 20 connections.
MTU size doesn't have much effect on throughput because of the small amount of data sent in the RR workload.
IUCV and VCTC have better throughput since they have been optimized for VM-to-VM communication whereas the other connectivity types have to support more than just the VM environment and therefore are not as optimized.
The throughput for all connectivity types plateaus at 10 users.
 |
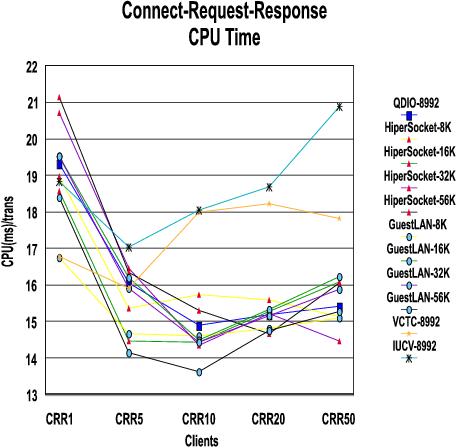 |
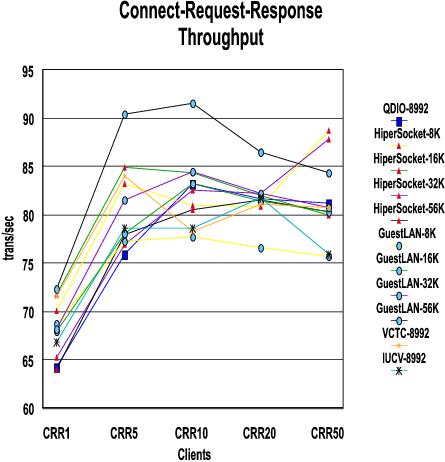
With the CRR workload, IUCV and VCTC have lost their advantage because they are not as efficient with connect and disconnect. The optimization done for moving data does not help as much with this workload.
The CPU times are greater for CRR than RR for the same reason (connect and disconnect overhead).
The plateau is reached between 5 and 10 users, depending on the connectivity type.
Guest LAN handles CRR more efficiently than the other types.
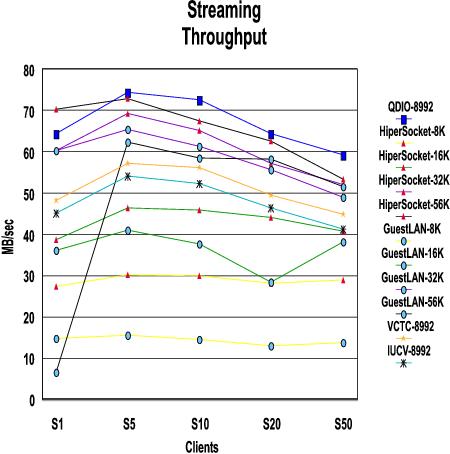
Figure 5. Streaming Throughput
 |
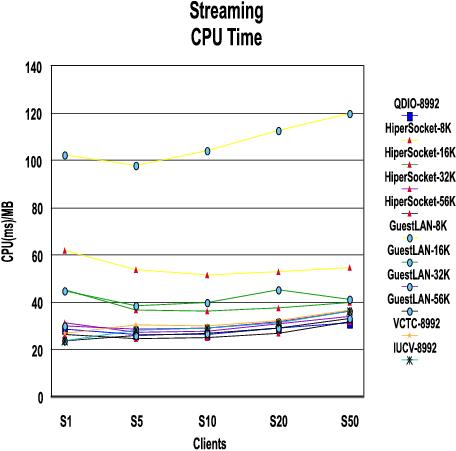 |
The number of connections is not as significant for the streaming workload as it was for RR and CRR.
MTU size, however, does make a difference with this workload because of the large amounts of data being transferred. Bigger is better.
An anomaly was noted for the single user Guest LAN case when running with 56K MTU size. This is currently being investigated.
It is possible that IUCV and VCTC may do better than shown in this chart if an MTU size larger than 8992 is chosen.
The throughput and CPU time results for all runs are summarized in
the following tables (by connectivity type).
Table 1. Throughput and CPU Time: HiperSockets
MTU Size | 8K | 16K | 32K | 56K |
|---|---|---|---|---|
Throughput (trans/sec) |
|
|
|
|
RR1 RR5 RR10 RR20 RR50 | 852.06 1352.97 1508.20 1535.70 1351.26 | 856.69 1365.10 1595.59 1620.41 1462.30 | 877.11 1364.84 1656.22 1648.21 1486.11 | 913.99 1347.30 1646.97 1651.54 1542.31 |
CRR1 CRR5 CRR10 CRR20 CRR50 | 70.10 83.29 80.99 80.90 88.70 | 71.78 84.92 84.32 82.00 79.99 | 65.27 76.98 82.60 82.19 87.89 | 64.04 77.98 80.54 81.58 80.36 |
Throughput (MB/sec) |
|
|
|
|
S1 S5 S10 S20 S50 | 27.45 30.10 29.90 28.27 28.93 | 38.63 46.46 45.98 44.17 40.71 | 60.40 69.33 65.19 57.36 52.07 | 70.43 72.86 67.49 62.72 53.25 |
CPU time (msec/trans) |
|
|
|
|
RR1 RR5 RR10 RR20 RR50 | 1.83 1.46 1.29 1.15 1.24 | 1.83 1.45 1.20 1.07 1.14 | 1.81 1.45 1.15 1.02 1.12 | 1.82 1.47 1.15 0.99 1.08 |
CRR1 CRR5 CRR10 CRR20 CRR50 | 18.97 15.37 15.73 15.60 15.13 | 18.56 14.46 14.44 15.27 16.08 | 20.71 16.47 14.33 15.21 14.47 | 21.14 16.34 15.30 14.66 16.05 |
CPU time (msec/MB) |
|
|
|
|
S1 S5 S10 S20 S50 | 61.86 53.89 51.64 52.92 54.61 | 45.41 36.50 36.45 37.49 39.65 | 31.13 27.23 27.76 30.65 33.99 | 26.44 24.43 25.16 26.75 31.70 |
| Note: 2064-109; z/VM 4.2.0 with 64-bit CP | ||||
Table 2. Throughput and CPU Time: Guest LAN
MTU Size | 8K | 16K | 32K | 56K |
|---|---|---|---|---|
Throughput (trans/sec) |
|
|
|
|
RR1 RR5 RR10 RR20 RR50 | 612.12 1352.50 1507.93 1530.21 1374.24 | 614.10 1349.25 1587.62 1596.38 1444.74 | 614.19 1359.39 1655.89 1654.49 1514.85 | 584.38 1293.02 1597.29 1602.41 1490.61 |
CRR1 CRR5 CRR10 CRR20 CRR50 | 68.67 77.30 77.70 76.63 75.67 | 67.94 78.08 83.21 81.45 80.30 | 68.15 81.55 84.43 82.26 80.74 | 72.35 90.44 91.54 86.51 84.42 |
Throughput (MB/sec) |
|
|
|
|
S1 S5 S10 S20 S50 | 14.89 15.54 14.43 12.94 13.72 | 36.02 40.95 37.65 28.37 38.13 | 60.29 65.36 61.40 55.57 49.03 | 6.46 62.39 58.57 58.30 51.51 |
CPU time (msec/trans) |
|
|
|
|
RR1 RR5 RR10 RR20 RR50 | 1.64 1.44 1.29 1.14 1.21 | 1.63 1.42 1.20 1.08 1.16 | 1.63 1.42 1.14 1.02 1.11 | 1.72 1.49 1.18 1.03 1.13 |
CRR1 CRR5 CRR10 CRR20 CRR50 | 16.75 14.67 14.62 14.80 15.09 | 19.52 16.19 14.49 15.32 16.21 | 19.52 15.92 14.43 15.15 15.88 | 18.38 14.13 13.63 14.75 15.28 |
CPU time (msec/MB) |
|
|
|
|
S1 S5 S10 S20 S50 | 102.22 98.07 104.23 112.98 119.97 | 44.81 38.34 39.73 45.19 41.17 | 29.86 28.43 29.09 31.71 36.26 | 23.53 26.00 26.98 28.99 32.93 |
| Note: 2064-109; z/VM 4.2.0 with 64-bit CP | ||||
Table 3. Throughput and CPU Time: QDIO
MTU Size | 1500 | 8992 |
|---|---|---|
Throughput (trans/sec) |
|
|
RR1 RR5 RR10 RR20 RR50 | 594.29 1410.62 1631.10 1554.05 1527.24 | 596.85 1406.49 1625.78 1547.36 1527.62 |
CRR1 CRR5 CRR10 CRR20 CRR50 | 62.10 75.30 78.08 77.81 77.30 | 64.17 75.96 83.22 81.68 81.19 |
Throughput (MB/sec) |
|
|
S1 S5 S10 S20 S50 | 40.76 28.65 29.54 30.44 28.62 | 64.32 74.45 72.62 64.46 59.22 |
CPU time (msec/trans) |
|
|
RR1 RR5 RR10 RR20 RR50 | 1.68 1.32 1.09 0.94 1.05 | 1.68 1.33 1.10 0.94 1.05 |
CRR1 CRR5 CRR10 CRR20 CRR50 | 16.81 14.98 14.47 14.27 14.54 | 19.32 16.06 14.90 15.18 15.42 |
CPU time (msec/MB) |
|
|
S1 S5 S10 S20 S50 | 43.23 45.45 48.75 52.76 59.89 | 28.64 26.46 26.47 29.23 31.17 |
| Note: 2064-109; z/VM 4.2.0 with 64-bit CP | ||
Table 4. Throughput and CPU Time: IUCV
Throughput MTU Size |
|
|
|---|---|---|
Throughput (trans/sec) |
|
|
RR1 RR5 RR10 RR20 RR50 |
| 1109.99 1985.96 2022.08 2159.24 1942.32 |
CRR1 CRR5 CRR10 CRR20 CRR50 |
| 66.79 78.60 78.61 81.81 75.98 |
Throughput (MB/sec) |
|
|
S1 S5 S10 S20 S50 | 34.39 43.18 40.01 35.75 30.30 | 45.21 54.02 52.32 46.41 41.38 |
CPU time (msec/trans) |
|
|
RR1 RR5 RR10 RR20 RR50 |
| 0.94 0.98 0.98 0.92 0.99 |
CRR1 CRR5 CRR10 CRR20 CRR50 |
| 18.84 17.02 18.06 18.68 20.87 |
CPU time (msec/MB) |
|
|
S1 S5 S10 S20 S50 | 33.91 41.08 45.69 51.08 57.62 | 23.45 28.25 29.09 31.11 36.06 |
| Note: 2064-109; z/VM 4.2.0 with 64-bit CP | ||
Table 5. Throughput and CPU Time: VCTC
MTU Size | 1500 | 8992 |
|---|---|---|
Throughput (trans/sec) |
|
|
RR1 RR5 RR10 RR20 RR50 |
| 1034.59 1933.19 1964.4 1990.4 1799.93 |
CRR1 CRR5 CRR10 CRR20 CRR50 |
| 71.51 84.05 78.25 81.12 80.71 |
Throughput (MB/sec) |
|
|
S1 S5 S10 S20 S50 | 40.58 47.12 46.19 43.30 36.35 | 48.21 57.36 56.14 49.48 44.94 |
CPU time (msec/trans) |
|
|
RR1 RR5 RR10 RR20 RR50 |
| 0.99 1.03 1.01 0.99 1.04 |
CRR1 CRR5 CRR10 CRR20 CRR50 |
| 16.78 15.92 17.99 18.22 17.82 |
CPU time (msec/MB) |
|
|
S1 S5 S10 S20 S50 | 37.11 39.86 41.44 44.16 52.27 | 27.01 30.20 29.96 32.34 36.63 |
| Note: 2064-109; z/VM 4.2.0 with 64-bit CP | ||
Maximum Throughput Results: The maximum throughput for each workload is summarized in the following tables. MB/sec (megabytes per second), trans/sec (transactions per second) and response time were supplied by the workload driver and show the throughput rate. All other values are from CP monitor data or derived from CP monitor data.
Total_cpu_util | This field was obtained from the SYSTEM_SUMMARY_BY_TIME VMPRF report that shows the average of both processors out of 100%. |
tot_cpu_util | This field is calculated from the USER_RESOURCE_UTILIZATION VMPRF report (CPU seconds, total) for the client stack (tcpip1), the server stack (tcpip2) and the driver clients and servers and gives the total system CPU utilization. 100% is the equivalent of one fully utilized processor. |
virt_cpu_util | This field is calculated from the USER_RESOURCE_UTILIZATION VMPRF report (CPU seconds, Virtual) for the client stack (tcpip1), the server stack (tcpip2) and the driver clients and servers (nontcp). This result is the total virtual CPU utilization. |
run+wait | This was calculated from the previous tot_cpu_util plus percent of time waiting on CPU as reported in USER_STATES VMPRF report for each stack (tcpip1 and tcpip2). |
cpu_msec/trans | This field was calculated from the previous tot_cpu_util divided by the number of transactions per second (or number of megabytes per second for the streaming workload) to show the number of milliseconds of time per transaction. |
Table 6. Maximum Throughput: Request-Response
Protocol MTU size Number of clients runid | QDIO 1500 10 qnxr1072 | HIPER 56K 20 h5xr2072 | GUEST 32K 20 g3xr2071 | vCTC 8992 20 vjxr2071 | IUCV 8992 20 ijxr2071 |
|---|---|---|---|---|---|
MB/sec trans/sec response time (msec) elapsed time (sec) total_cpu_util | 1.87 1631.10 6.13 150.00 89.30 | 1.89 1651.54 12.10 150.00 81.90 | 1.89 1654.49 12.08 150.00 84.00 | 2.28 1990.40 10.04 150.00 99.00 | 2.42 2116.14 9.44 150.00 99.20 |
tcpip1_tot_cpu_util tcpip1_virt_cpu_util tcpip1_run+wait | 58.70 45.30 85.40 | 43.30 30.70 66.00 | 47.30 32.00 78.00 | 48.00 22.70 73.30 | 40.00 20.70 69.30 |
tcpip2_tot_cpu_util tcpip2_virt_cpu_util tcpip2_run+wait | 35.30 22.00 48.60 | 32.70 19.30 47.40 | 34.70 19.33 66.70 | 47.30 22.70 76.60 | 40.70 20.70 59.40 |
nontcp_tot_cpu_util nontcp_virt_cpu_util | 80.00 67.33 | 80.00 80.00 | 80.00 80.00 | 106.67 80.00 | 106.67 106.67 |
cpu_msec/trans emul_msec/trans cp_msec/trans | 1.09 0.86 0.24 | 0.99 0.76 0.23 | 1.02 0.76 0.25 | 0.99 0.67 0.33 | 0.94 0.67 0.26 |
tcpip1_cpu_msec/trans tcpip1_vcpu_msec/trans tcpip1_ccpu_msec/trans | 0.36 0.28 0.08 | 0.26 0.19 0.08 | 0.14 0.10 0.05 | 0.24 0.11 0.13 | 0.19 0.10 0.09 |
tcpip2_cpu_msec/trans tcpip2_vcpu_msec/trans tcpip2_ccpu_msec/trans | 0.22 0.13 0.08 | 0.20 0.12 0.08 | 0.10 0.06 0.05 | 0.24 0.11 0.12 | 0.19 0.10 0.09 |
nontcp_cpu_msec/trans nontcp_vcpu_msec/trans nontcp_ccpu_msec/trans | 0.49 0.41 0.08 | 0.48 0.48 0.00 | 0.77 0.61 0.16 | 0.54 0.40 0.13 | 0.50 0.50 0.00 |
| Note: 2064-109; z/VM 4.2.0 with 64-bit CP; TCP/IP 420 | |||||
Both IUCV and vCTC attained 99% CPU utilization for this workload and therefore are gated by the available processors. IUCV had the best throughput with 2116.14 transactions a second.
The driver client virtual machines communicate with the TCPIP2 stack virtual machine. The driver server virtual machines communicate with the TCPIP1 stack virtual machine. All cases show that the driver clients and servers used a large portion of the resources available.
Table 7. Maximum Throughput: Connect-Request-Response
Protocol MTU Size Number of clients runid | QDIO 8992 10 qjxc1071 | HIPER 8K 50 h8xc5071 | GUEST 56K 10 g5xc1073 | vCTC 8992 05 vjxc0572 | IUCV 8992 20 ijxc2072 |
|---|---|---|---|---|---|
MB/sec trans/sec response time (msec) elapsed time (sec) total_cpu_util | 0.66 83.22 120.16 150.00 62.00 | 0.70 88.74 563.71 120.00 67.10 | 0.72 91.54 109.24 150.00 62.40 | 0.66 84.05 59.49 150.00 66.90 | 0.64 81.81 244.47 150.00 76.40 |
tcpip1_tot_cpu_util tcpip1_virt_cpu_util tcpip1_run+wait | 88.70 87.30 98.00 | 85.80 84.20 92.50 | 86.70 84.70 89.40 | 84.70 82.70 99.40 | 92.70 91.30 100.70 |
tcpip2_tot_cpu_util tcpip2_virt_cpu_util tcpip2_run+wait | 24.00 22.70 28.00 | 33.30 31.70 43.30 | 25.30 23.30 29.30 | 38.70 37.30 45.40 | 50.00 48.70 58.00 |
nontcp_tot_cpu_util nontcp_virt_cpu_util | 13.33 13.33 | 0.00 0.00 | 13.33 13.33 | 8.67 6.67 | 0.00 0.00 |
cpu_msec/trans emul_msec/trans cp_msec/trans | 14.90 14.28 0.62 | 15.13 14.27 0.86 | 13.63 12.93 0.71 | 15.92 15.18 0.74 | 18.68 18.07 0.61 |
tcpip1_cpu_msec/trans tcpip1_vcpu_msec/trans tcpip1_ccpu_msec/trans | 10.65 10.49 0.16 | 9.68 9.49 0.19 | 9.47 9.25 0.22 | 10.07 9.84 0.24 | 11.33 11.16 0.16 |
tcpip2_cpu_msec/trans tcpip2_vcpu_msec/trans tcpip2_ccpu/_msec/trans | 2.88 2.72 0.16 | 3.76 3.57 0.19 | 2.77 2.55 0.22 | 4.60 4.44 0.16 | 6.11 5.95 0.16 |
nontcp_cpu_msec/trans nontcp_vcpu_msec/trans nontcp_ccpu_msec/trans | 1.60 1.60 0.00 | 0.00 0.00 0.00 | 1.46 1.46 0.00 | 1.03 0.79 0.24 | 0.00 0.00 0.00 |
| Note: 2064-109; z/VM 4.2.0 with 64-bit CP; TCP/IP 420 | |||||
CRR throughput is less than RR throughput due to the overhead
of connect/disconnect.
Guest LAN seemed to handle the CRR workload the best.
The client stack appeared to be the limiting factor in all cases.
For all cases 90% of the time or greater the stacks were either
running or waiting for the CPU.
Since the stack design is based on a uni-processor model, it will
never be able to exceed 100% of one processor.
Table 8. Maximum Throughput: Streaming
Protocol MTU Size Number of clients runid | QDIO 8992 05 qjxs0573 | HIPER 56K 05 h5xs0573 | GUEST 32K 05 g3xs0573 | vCTC 8992 05 vjxs0573 | IUCV 8992 05 ijxs0572 |
|---|---|---|---|---|---|
MB/sec trans/sec response time(msec) elapsed time (sec) total_cpu_util | 74.45 3.72 1343.24 330.00 98.50 | 72.86 3.64 1372.57 330.00 89.00 | 65.36 3.27 1530.00 330.00 92.97 | 57.36 2.87 1743.30 330.00 86.61 | 54.02 2.70 1851.07 330.00 76.39 |
tcpip1_tot_cpu_util tcpip1_virt_cpu_util tcpip1_run+wait | 93.00 70.30 96.00 | 92.10 70.00 99.40 | 91.50 59.40 98.20 | 60.30 26.10 77.90 | 48.50 26.10 60.00 |
tcpip2_tot_cpu_util tcpip2_virt_cpu_util tcpip2_run+wait | 64.50 40.30 77.20 | 52.10 31.80 63.50 | 57.30 34.50 71.20 | 67.00 26.40 88.80 | 61.50 25.20 76.70 |
nontcp_tot_cpu_util nontcp_virt_cpu_util | 37.88 33.33 | 32.12 24.85 | 36.36 31.82 | 42.73 37.88 | 40.91 34.85 |
cpu_msec/MB emul_msec/MB cp_msec/MB | 26.46 19.23 7.23 | 24.43 17.90 6.53 | 28.43 19.25 9.18 | 30.20 15.73 14.47 | 28.25 16.11 12.14 |
tcpip1_cpu_msec/MB tcpip1_vcpu_msec/MB tcpip1_ccpu_msec/MB | 12.50 9.44 3.05 | 12.64 9.61 3.04 | 14.00 9.09 4.91 | 10.51 4.54 5.97 | 8.98 4.82 4.15 |
tcpip2_cpu_msec/MB tcpip2_vcpu_msec/MB tcpip2_ccpu_msec/MB | 8.67 5.41 3.26 | 7.15 4.37 2.79 | 8.76 5.29 3.48 | 11.68 4.60 7.08 | 11.39 4.66 6.73 |
nontcp_cpu_msec/MB nontcp_vcpu_msec/MB nontcp_ccpu_msec/MB | 5.09 4.48 0.61 | 4.41 3.41 1.00 | 18.18 15.91 4.59 | 7.45 6.60 0.85 | 7.57 6.45 1.12 |
| Note: 2064-109; z/VM 4.2.0 with 64-bit CP; TCP/IP 420 | |||||
QDIO was the winner for the streaming workload. For QDIO,
total system CPU utilization limited throughput.
For HiperSockets and Guest LAN, the client stack was the limiting
factor with more than 95% of the time either running or waiting on
the CPU.