Dedicated OSA vs. Vswitch Update
Abstract
To connect to an external network, z/VM guests can use a dedicated OSA or a vswitch. This chapter provides a comparison of how the choice impacts the transaction rate when running request-response (RR) workloads and the outbound data rate when running streaming (STR) workloads. A variety of different configurations are compared.
Introduction
The Dedicated OSA vs. VSWITCH chapter of the z/VM 5.2 Performance Report compared two connectivity options available for guests running under z/VM: direct connection to OSA and vswitch.
Here we present an update of the z/VM 5.2 information. This refresh contains a comparison of key measurement points between the two options and lists some of the reasons for choosing one over the other. Customer results will vary according to system configuration and workload.
Method
Application Workload Modeler (AWM), a Linux network benchmarking application, was used to drive network traffic between one client Linux guest and one server Linux guest. Each guest was in its own dedicated LPAR. Both dedicated OSA configurations and vswitch configurations were evaluated. Both request-response (RR) and streaming (STR) workloads were used. The RR workload consisted of the client sending 200 bytes to the server and the server responding with 1000 bytes. The STR workload consisted of the client sending 20 bytes to the server and the server responding with 20 MB. The measurement ran for 600 seconds. The workloads were run in 12 configurations. The configurations varied by maximum transmission unit (MTU) size, SMT mode, and transport mode. The table below shows the combination of workloads and configurations used.
| Table 1. Combination of workloads and configurations | |||
| Workload | MTU Size | SMT Mode | Transport Mode |
| RR | 1492 | SMT-1 | Layer 2 |
| RR | 1492 | SMT-1 | Layer 3 |
| RR | 1492 | SMT-2 | Layer 2 |
| RR | 1492 | SMT-2 | Layer 3 |
| STR | 1492 | SMT-1 | Layer 2 |
| STR | 1492 | SMT-1 | Layer 3 |
| STR | 1492 | SMT-2 | Layer 2 |
| STR | 1492 | SMT-2 | Layer 3 |
| STR | 8992 | SMT-1 | Layer 2 |
| STR | 8992 | SMT-1 | Layer 3 |
| STR | 8992 | SMT-2 | Layer 2 |
| STR | 8992 | SMT-2 | Layer 3 |
| Note: See Layer 2 and Layer 3 for more details about transport modes. | |||
Each combination from Table 1 was run three times: once using one socket connection, once using 10 concurrent socket connections, and once using 50 concurrent socket connections.
The measurements were done on a z15 8561-T01 using two dedicated LPARs. For SMT-1 runs, each LPAR used two logical IFL cores. For SMT-2 runs, each LPAR used one logical IFL core. Connectivity between the two LPARs was over an OSA-Express6 10GbE card. The software used included z/VM 7.2 and Linux SLES 12 SP1.
|
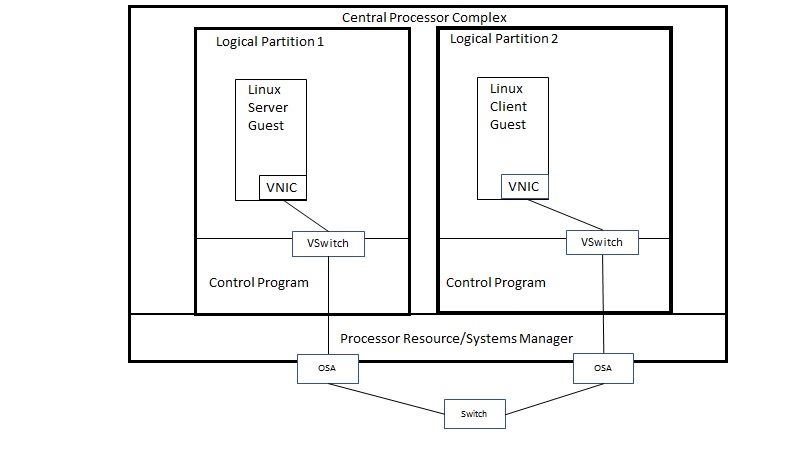
| Use of a vswitch to connect the client guest to the server guest. |
|
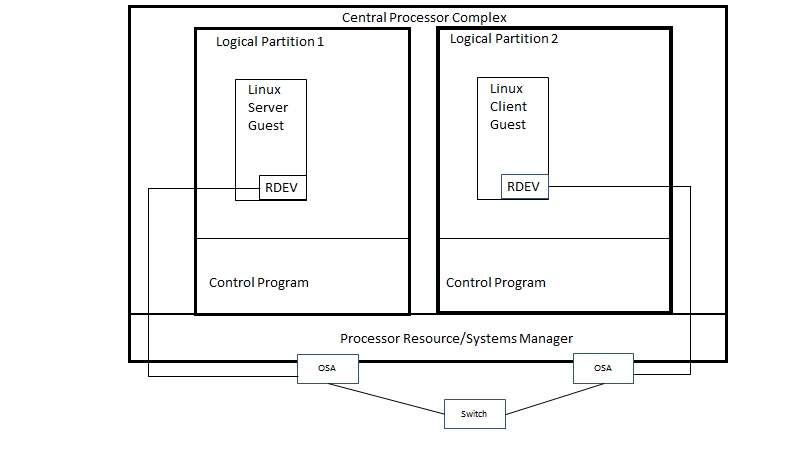
| Use of dedicated OSA to connect the client guest to the server guest. |
In both environments, the server Linux guest ran in LPAR 1 and the client Linux guest ran in LPAR 2. Each LPAR had 512 GB of central storage. CP monitor data was captured for LPAR 1 (server side) during each measurement and reduced using Performance Toolkit for VM (Perfkit).
The z/VM 5.2 measurements captured data from the client side. For this new study, the data was captured on the server side. This more closely aligns with the role typically played by a Linux guest.
Results and Discussion
The following tables contain the average of select metrics for each run. For RR runs, the focus is on transaction rate. For STR runs, the focus is on outbound data transmission rate. The tables also compare the difference in these metrics between the OSA and vswitch runs. The %diff numbers shown are the percent change comparing OSA to the vswitch. For example, if the number is positive, OSA was that percent greater than vswitch.
In general, a Linux guest using a dedicated OSA gets higher throughput and uses less CPU time than a Linux guest connected through a vswitch. However, this must be balanced against advantages gained using the vswitch, such as:
- Ease of network design
- Ability to share network resources (OSA card)
- Management of the network including security and capabilities available to the z/VM guest on the LAN
- Measurement of the network via z/VM monitor records
- Layer 3 bridge
- Less overhead than using a router stack
| Table 2. Results of RR runs with MTU size of 1492 and using SMT-1 | ||||||
| Transport mode | Layer 3 | Layer 3 | Layer 3 | Layer 2 | Layer 2 | Layer 2 |
| Number of Clients | 1 | 10 | 50 | 1 | 10 | 50 |
| Workload | RR | RR | RR | RR | RR | RR |
| MTU size | 1492 | 1492 | 1492 | 1492 | 1492 | 1492 |
| SMT mode | SMT-1 | SMT-1 | SMT-1 | SMT-1 | SMT-1 | SMT-1 |
| VSwitch | ||||||
| Runid | NVS1L301 | NVS1L310 | NVS1L350 | NVS1L201 | NVS1L210 | NVS1L250 |
| ETR | 5,754.34 | 35,214.88 | 89,560.30 | 5,766.87 | 35,484.94 | 90,498.04 |
| Total CPU msec/transaction | 0.00855 | 0.00481 | 0.00507 | 0.00902 | 0.00474 | 0.00495 |
| Emul CPU msec/transaction | 0.00589 | 0.00356 | 0.00402 | 0.00617 | 0.00350 | 0.00388 |
| CP CPU msec/transaction | 0.00266 | 0.00125 | 0.00105 | 0.00285 | 0.00124 | 0.00107 |
| OSA | ||||||
| Runid | NOS1L301 | NOS1L310 | NOS1L350 | NOS1L201 | NOS1L210 | NOS1L250 |
| ETR | 9,950.98 | 59,350.26 | 160225.18 | 10,026.60 | 59,397.52 | 163,282.63 |
| Total CPU msec/transaction | 0.01025 | 0.00696 | 0.00475 | 0.01015 | 0.00686 | 0.00464 |
| Emul CPU msec/transaction | 0.00927 | 0.00657 | 0.00465 | 0.00920 | 0.00648 | 0.00454 |
| CP CPU msec/transaction | 0.00098 | 0.00039 | 0.00010 | 0.00095 | 0.00038 | 0.00010 |
| % difference | ||||||
| ETR | 72.93% | 68.54% | 78.90% | 73.87% | 67.39% | 80.43% |
| Total CPU msec/transaction | 19.88% | 44.70% | -6.31% | 12.53% | 44.73% | -6.26% |
| Emul CPU msec/transaction | 57.39% | 84.55% | 15.67% | 49.11% | 85.14% | 17.01% |
| CP CPU msec/transaction | -63.16% | -68.80% | -90.48% | -66.67% | -69.35% | -90.65% |
| Notes: 8561-T01, 2 dedicated IFL cores, 512 GB central storage, OSA-Express6 10GbE card, z/VM 7.2 of May 7, 2020, Linux SLES 12 SP1. | ||||||
The ETR of the OSA runs was 68.54% to 80.43% higher than the equivalent vswitch runs when running the RR workload in an SMT-1 configuration with an MTU size of 1492. The total CPU per transaction of the OSA runs was between 44.73% higher to 6.31% lower than the equivalent vswitch runs.
| Table 3. Results of RR runs with MTU size of 1492 and using SMT-2 | ||||||
| Transport mode | Layer 3 | Layer 3 | Layer 3 | Layer 2 | Layer 2 | Layer 2 |
| Number of Clients | 1 | 10 | 50 | 1 | 10 | 50 |
| Workload | RR | RR | RR | RR | RR | RR |
| MTU size | 1492 | 1492 | 1492 | 1492 | 1492 | 1492 |
| SMT mode | SMT-2 | SMT-2 | SMT-2 | SMT-2 | SMT-2 | SMT-2 |
| VSwitch | ||||||
| Runid | NVS2L301 | NVS2L310 | NVS2L350 | NVS2L201 | NVS2L210 | NVS2L250 |
| ETR | 5,705.34 | 34,202.31 | 75,775.96 | 5,675.12 | 34,485.39 | 75,912.95 |
| Total CPU msec/transaction | 0.01059 | 0.00571 | 0.00670 | 0.01256 | 0.00560 | 0.00658 |
| Emul CPU msec/transaction | 0.00787 | 0.00438 | 0.00532 | 0.00913 | 0.00428 | 0.00520 |
| CP CPU msec/transaction | 0.00272 | 0.00133 | 0.00138 | 0.00343 | 0.00132 | 0.00138 |
| OSA | ||||||
| Runid | NOS2L301 | NOS2L310 | NOS2L350 | NOS2L201 | NOS2L210 | NOS2L250 |
| ETR | 9,721.54 | 58,886.62 | 157,694.74 | 9,776.24 | 58,482.06 | 159,551.13 |
| Total CPU msec/transaction | 0.01192 | 0.00802 | 0.00586 | 0.01177 | 0.00782 | 0.00576 |
| Emul CPU msec/transaction | 0.01101 | 0.00762 | 0.00573 | 0.01086 | 0.00743 | 0.00564 |
| CP CPU msec/transaction | 0.00091 | 0.00040 | 0.00013 | 0.00091 | 0.00039 | 0.00012 |
| % difference | ||||||
| ETR | 70.39% | 72.17% | 108.11% | 72.26% | 69.59% | 110.18% |
| Total CPU msec/transaction | 12.56% | 40.46% | -12.54% | -6.29% | 39.64% | -12.46% |
| Emul CPU msec/transaction | 39.90% | 73.97% | 7.71% | 18.95% | 73.60% | 8.46% |
| CP CPU msec/transaction | -66.54% | -69.92% | -90.58% | -73.47% | -70.45% | -91.30% |
| Notes: 8561-T01, 2 dedicated IFL cores, 512 GB central storage, OSA-Express6 10GbE card, z/VM 7.2 of May 7, 2020, Linux SLES 12 SP1. | ||||||
The ETR of the OSA runs was 69.59% to 110.18% higher than the equivalent vswitch runs when running the RR workload in an SMT-2 configuration with an MTU size of 1492. The total CPU per transaction of the OSA runs was between 40.46% higher to 12.54% lower than the equivalent vswitch runs.
| Table 4. Results of STR runs with MTU size of 1492 and using SMT-1 | ||||||
| Transport mode | Layer 3 | Layer 3 | Layer 3 | Layer 2 | Layer 2 | Layer 2 |
| Number of Clients | 1 | 10 | 50 | 1 | 10 | 50 |
| Workload | STR | STR | STR | STR | STR | STR |
| MTU size | 1492 | 1492 | 1492 | 1492 | 1492 | 1492 |
| SMT mode | SMT-1 | SMT-1 | SMT-1 | SMT-1 | SMT-1 | SMT-1 |
| VSwitch | ||||||
| Runid | NVM1L301 | NVM1L310 | NVM1L350 | NVM1L201 | NVM1L210 | NVM1L250 |
| Outbound MB/sec | 481 | 913 | 997 | 450 | 1,042 | 1,036 |
| Total CPU msec/Outbound MB | 2.00728 | 1.62651 | 1.40020 | 1.99556 | 1.59693 | 1.45753 |
| Emul CPU msec/Outbound MB | 1.15904 | 1.26725 | 1.06018 | 1.20244 | 1.25432 | 1.12548 |
| CP CPU msec/Outbound MB | 0.84824 | 0.35926 | 0.34002 | 0.79312 | 0.34261 | 0.33205 |
| OSA | ||||||
| Runid | NOM1L301 | NOM1L310 | NOM1L350 | NOM1L201 | NOM1L210 | NOM1L250 |
| Outbound MB/sec | 935 | 1,131 | 1,136 | 785 | 1,159 | 1,155 |
| Total CPU msec/Outbound MB | 0.98599 | 1.03802 | 1.09419 | 1.07975 | 1.26488 | 1.26320 |
| Emul CPU msec/Outbound MB | 0.98513 | 1.03271 | 1.08363 | 1.07873 | 1.25626 | 1.25887 |
| CP CPU msec/Outbound MB | 0.00086 | 0.00531 | 0.01056 | 0.00102 | 0.00862 | 0.00433 |
| % difference | ||||||
| Outbound MB/sec | 94.39% | 23.88% | 13.94% | 74.44% | 11.23% | 11.49% |
| Total CPU msec/Outbound MB | -50.88% | -36.18% | -21.85% | -45.89% | -20.79% | -13.33% |
| Emul CPU msec/Outbound MB | -15.00% | -18.51% | 2.21% | -10.29% | 0.15% | 11.85% |
| CP CPU msec/Outbound MB | -99.90% | -98.52% | -96.89% | -99.87% | -97.48 | -98.70% |
| Notes: 8561-T01, 2 dedicated IFL cores, 512 GB central storage, OSA-Express6 10GbE card, z/VM 7.2 of May 7, 2020, Linux SLES 12 SP1. | ||||||
The outbound data rate of the OSA runs was 11.23% to 94.39% higher than the equivalent vswitch runs when running the STR workload in an SMT-1 configuration with an MTU size of 1492. The total CPU per outbound MB rate of the OSA runs was between 13.33% to 50.88% lower than the equivalent vswitch runs.
| Table 5. Results of STR runs with MTU size of 1492 and using SMT-2 | ||||||
| Transport mode | Layer 3 | Layer 3 | Layer 3 | Layer 2 | Layer 2 | Layer 2 |
| Number of Clients | 1 | 10 | 50 | 1 | 10 | 50 |
| Workload | STR | STR | STR | STR | STR | STR |
| MTU size | 1492 | 1492 | 1492 | 1492 | 1492 | 1492 |
| SMT mode | SMT-2 | SMT-2 | SMT-2 | SMT-2 | SMT-2 | SMT-2 |
| VSwitch | ||||||
| Runid | NVM2L301 | NVM2L310 | NVM2L350 | NVM2L201 | NVM2L210 | NVM2L250 |
| Outbound MB/sec | 448 | 812 | 885 | 380 | 876 | 843 |
| Total CPU msec/Outbound MB | 2.21920 | 1.81527 | 1.82260 | 2.23289 | 1.92123 | 1.85647 |
| Emul CPU msec/Outbound MB | 1.38638 | 1.40640 | 1.40904 | 1.39026 | 1.48630 | 1.43416 |
| CP CPU msec/Outbound MB | 0.83282 | 0.40887 | 0.41356 | 0.84263 | 0.43493 | 0.42231 |
| OSA | ||||||
| Runid | NOM2L301 | NOM2L310 | NOM2L350 | NOM2L201 | NOM2L210 | NOM2L250 |
| Outbound MB/sec | 875 | 1,129 | 1,121 | 761 | 1,075 | 1,072 |
| Total CPU msec/Outbound MB | 1.05371 | 1.23738 | 1.41659 | 1.12431 | 1.54884 | 1.51026 |
| Emul CPU msec/Outbound MB | 1.05269 | 1.23206 | 1.40856 | 1.12326 | 1.53395 | 1.50466 |
| CP CPU msec/Outbound MB | 0.00102 | 0.00532 | 0.00803 | 0.00105 | 0.01489 | 0.00560 |
| % difference | ||||||
| Outbound MB/sec | 95.31% | 39.04% | 26.67% | 100.26% | 22.72% | 27.16% |
| Total CPU msec/Outbound MB | -52.52% | -31.83% | -22.28% | -49.65% | -19.38% | -18.65% |
| Emul CPU msec/Outbound MB | -24.07% | -12.40% | -0.03% | -19.21% | 3.21% | 4.92% |
| CP CPU msec/Outbound MB | -99.88% | -98.70% | -98.06% | -99.88% | -96.58% | -98.67% |
| Notes: 8561-T01, 1 dedicated IFL core, 512 GB central storage, OSA-Express6 10GbE card, z/VM 7.2 of May 7, 2020, Linux SLES 12 SP1. | ||||||
The outbound data rate of the OSA runs was 22.72% to 100.26% higher than the equivalent vswitch runs when running the STR workload in an SMT-2 configuration with an MTU size of 1492. The total CPU per outbound MB rate of the OSA runs was between 18.65% to 52.52% lower than the equivalent vswitch runs.
| Table 6. Results of STR runs with MTU size of 8992 and using SMT-1 | ||||||
| Transport mode | Layer 3 | Layer 3 | Layer 3 | Layer 2 | Layer 2 | Layer 2 |
| Number of Clients | 1 | 10 | 50 | 1 | 10 | 50 |
| Workload | STR | STR | STR | STR | STR | STR |
| MTU size | 8992 | 8992 | 8992 | 8992 | 8992 | 8992 |
| SMT mode | SMT-1 | SMT-1 | SMT-1 | SMT-1 | SMT-1 | SMT-1 |
| VSwitch | ||||||
| Runid | NVL1L301 | NVL1L310 | NVL1L350 | NVL1L201 | NVL1L210 | NVL1L250 |
| Outbound MB/sec | 1011 | 1156 | 1154 | 747 | 1158 | 1156 |
| Total CPU msec/Outbound MB | 0.64857 | 0.61808 | 0.63648 | 0.63387 | 0.58109 | 0.60580 |
| Emul CPU msec/Outbound MB | 0.38586 | 0.38901 | 0.39636 | 0.38541 | 0.37332 | 0.39273 |
| CP CPU msec/Outbound MB | 0.26271 | 0.22907 | 0.24012 | 0.24846 | 0.20777 | 0.21307 |
| OSA | ||||||
| Runid | NOL1L301 | NOL1L310 | NOL1L350 | NOL1L201 | NOL1L210 | NOL1L250 |
| Outbound MB/sec | 1,121 | 1,153 | 1,154 | 1,113 | 1,157 | 1,156 |
| Total CPU msec/Outbound MB | 0.50696 | 0.54293 | 0.56205 | 0.54403 | 0.56206 | 0.56522 |
| Emul CPU msec/Outbound MB | 0.50000 | 0.53374 | 0.54948 | 0.53504 | 0.55315 | 0.55303 |
| CP CPU msec/Outbound MB | 0.00696 | 0.00919 | 0.01257 | 0.00899 | 0.00891 | 0.01219 |
| % difference | ||||||
| Outbound MB/sec | 10.88% | -0.26% | 0.00% | 49.00% | -0.09% | 0.00% |
| Total CPU msec/Outbound MB | -21.83% | -12.16% | -11.69% | -14.17% | -3.27% | -6.70% |
| Emul CPU msec/Outbound MB | 29.58% | 37.20% | 38.63% | 38.82% | 48.17% | 40.82% |
| CP CPU msec/Outbound MB | -97.35% | -95.99% | -94.77% | -96.38% | -95.71% | -94.28% |
| Notes: 8561-T01, 2 dedicated IFL cores, 512 GB central storage, OSA-Express6 10GbE card, z/VM 7.2 of May 7, 2020, Linux SLES 12 SP1. | ||||||
The outbound data rate of the OSA runs was 0.26% lower to 49.00% higher than the equivalent vswitch runs when running the STR workload in an SMT-1 configuration with an MTU size of 8992. The total CPU per outbound MB rate of the OSA runs was between 3.27% to 21.83% lower than the equivalent vswitch runs.
| Table 7. Results of STR runs with MTU size of 8992 and using SMT-2 | ||||||
| Transport mode | Layer 3 | Layer 3 | Layer 3 | Layer 2 | Layer 2 | Layer 2 |
| Number of Clients | 1 | 10 | 50 | 1 | 10 | 50 |
| Workload | STR | STR | STR | STR | STR | STR |
| MTU size | 8992 | 8992 | 8992 | 8992 | 8992 | 8992 |
| SMT mode | SMT-2 | SMT-2 | SMT-2 | SMT-2 | SMT-2 | SMT-2 |
| VSwitch | ||||||
| Runid | NVL2L301 | NVL2L310 | NVL2L350 | NVL2L201 | NVL2L210 | NVL2L250 |
| Outbound MB/sec | 916 | 1156 | 1155 | 598 | 1157 | 1156 |
| Total CPU msec/Outbound MB | 0.73362 | 0.71678 | 0.73792 | 0.70084 | 0.68634 | 0.74334 |
| Emul CPU msec/Outbound MB | 0.45382 | 0.46557 | 0.47506 | 0.43779 | 0.45748 | 0.50389 |
| CP CPU msec/Outbound MB | 0.27980 | 0.25121 | 0.26286 | 0.26305 | 0.22886 | 0.23945 |
| OSA | ||||||
| Runid | NOL2L301 | NOL2L310 | NOL2L350 | NOL2L201 | NOL2L210 | NOL2L250 |
| Outbound MB/sec | 1,137.00 | 1,145.00 | 1,154.00 | 1,123.00 | 1,156.00 | 1,156.00 |
| Total CPU msec/Outbound MB | 0.53369 | 0.59712 | 0.63527 | 0.57106 | 0.61090 | 0.63503 |
| Emul CPU msec/Outbound MB | 0.52647 | 0.58777 | 0.62227 | 0.56215 | 0.60156 | 0.62301 |
| CP CPU msec/Outbound MB | 0.00722 | 0.00935 | 0.01300 | 0.00891 | 0.00934 | 0.01202 |
| % difference | ||||||
| Outbound MB/sec | 24.13% | -0.95% | -0.09% | 87.79% | -0.09% | 0.00% |
| Total CPU msec/Outbound MB | -27.25% | -16.69% | -13.91% | -18.52% | -10.99% | -14.57% |
| Emul CPU msec/Outbound MB | 16.01% | 26.25% | 30.99% | 28.41% | 31.49% | 23.64% |
| CP CPU msec/Outbound MB | -97.42% | -96.28% | -95.05% | -96.61% | -95.92% | -94.98% |
| Notes: 8561-T01, 1 dedicated IFL core, 512 GB central storage, OSA-Express6 10GbE card, z/VM 7.2 of May 7, 2020, Linux SLES 12 SP1. | ||||||
The outbound data rate of the OSA runs was 0.95% lower to 87.79% higher than the equivalent vswitch runs when running the STR workload in an SMT-2 configuration with an MTU size of 8992. The total CPU per outbound MB rate of the OSA runs was between 10.99% to 27.25% better than the equivalent vswitch runs.
Summary
The results of the experiments conducted for this report indicate that
for a request-response (RR) workload,
Linux guests using a dedicated OSA
experience a greater ETR
than Linux guests using a vswitch.
Further, for a streaming (STR) workload,
Linux guests using a dedicated OSA
experience equal or greater outbound data rate
than Linux guests using a vswitch.
The degree of improvement varies depending on
the number of concurrent
connections used between the two guests, especially in the case of
a streaming workload.