Memory Management Serialization Contention Relief and 2 TB Central Storage Support
Abstract
Memory Management Serialization Contention Relief (hence, the enhancement) provides performance improvements to the memory management subsystem. It enables workload scaling up to the new z/VM 6.4 maximum supported central storage size of 2 TB.
Spin lock contention in the memory management subsystem has been a barrier to supporting central storage sizes above 1 TB. With z/VM 6.4 extensive changes were made to lock structures resulting in reduced spin lock contention. With these lock structure changes, along with other memory management subsystem changes, IBM measurements demonstrate the ability to scale workloads up to the new z/VM 6.4 maximum supported central storage size of 2 TB.
Background
As systems increase in memory size and number of processors, workloads can grow, putting more demand on the frame manager. The frame manager is the collection of modules in the z/VM memory management subsystem that maintains lists of available frames, manages requests for frames, and coalesces frames as they are returned.
Prior to z/VM 6.4 there were two locks providing serialized access to the lists of available frames: one lock for below-2-GB frames and one lock for above-2-GB frames. Contention for these locks, particularly on the lock for frames above 2 GB (RSA2GLCK), was noticeable with various workloads. This contention was limiting the growth of real memory z/VM could support.
The primary change made in the frame manager for z/VM 6.4 was to organize central storage into available list zones. An available list zone represents a range of central storage, much like the below-2-GB available lists and the above-2-GB available lists represented a range of central storage in prior releases. Management of the available frames within a zone is serialized by a lock unique to that zone. Zone locks are listed as AVZAnnnn and AVZBnnnn in monitor record D0 R23 MRSYTLCK, where nnnn is the zone number. The number and size of zones is determined internally by z/VM and can depend on the maximum potential amount of central storage, the number of attached processors, and whether the zone represents central storage above 2 GB or below 2 GB.
Other improvements to the frame manager include:
- The ability to queue frame returns so a task returning a frame is not delayed when the zone lock is not available.
- Improved defer logic which will check the global Invalid But Resident (IBR) aging list for a satisfactory frame before deferring the requestor.
- Enhanced available list replenishment logic which can run simultaneously to the global IBR aging list replenishment.
- More appropriate thresholds for available frame requests.
Another area where improvements have been made is in Page Table Resource Manager (PTRM) page allocations. In heavy paging environments significant lock contention was observed with a single PTRM address space allocation lock. The contention is now avoided by using CPU address to spread PTRM allocations across the 128 PTRM address spaces.
All of these items combined have enabled a new z/VM 6.4 maximum supported central storage size of 2 TB.
Method
A scan of previous IBM measurements revealed the Sweet Spot Priming workload (which uses the Virtual Storage Exerciser) experienced the highest level of spin lock contention on the available lists locks. Based on that finding the Sweet Spot Priming workload was chosen to measure the effectiveness of the enhancement.
In addition, both the Sweet Spot Priming workload and the Apache Scaling workload were used to measure the scalability of workloads up to the new z/VM 6.4 maximum supported central storage size of 2 TB.
Sweet Spot Priming Workload Using VIRSTOEX
The Sweet Spot Priming workload was designed to place high demand on the memory management subsystem. It consists of four sets of users which "prime" their virtual memory by changing data in a predetermined number of pages. This may be viewed as analogous to a customer application reading a database into memory. The workload is designed to overcommit memory by approximately 28%. The four sets of users are logged on sequentially. Each group completes its priming before the next group is logged on. The first three sets of users do not cause paging during priming. For the first three sets of users, only elapsed time is of interest. Each user touches a fixed number of pages based on virtual machine size. The fourth set of users does cause paging during priming. For the fourth set of users, ETR is defined as thousands of pages written to paging DASD per second.
Sweet Spot Priming workload measurements were used to evaluate the reduced lock contention and illustrate the improved performance of the workload as a result. The number of CPUs was held constant while central storage size and the virtual memory size of the users were increased to maintain a constant memory overcommitment level.
A modified z/VM 6.3 Control Program was used to obtain measurements with central storage sizes larger than the z/VM 6.3 maximum supported central storage size of 1 TB.
Table 1 shows the Sweet Spot Priming workload configurations used.
| Table 1. Sweet Spot Priming Workload Configurations. | ||||||||
| Central Storage in GB | 256 | 512 | 768 | 1024 | 1280 | 1536 | 1792 | 2048 |
| IFL Cores | 64 | 64 | 64 | 64 | 64 | 64 | 64 | 64 |
| CM1x Users | 88 | 88 | 88 | 88 | 88 | 88 | 88 | 88 |
| CM2x Users | 88 | 88 | 88 | 88 | 88 | 88 | 88 | 88 |
| CM3x Users | 88 | 88 | 88 | 88 | 88 | 88 | 88 | 88 |
| CM4x Users | 88 | 88 | 88 | 88 | 88 | 88 | 88 | 88 |
| CMx Virtual Memory Size in GB | 6.5 | 11 | 15.5 | 20 | 24.5 | 29 | 33.5 | 38 |
| Notes: The number of CPUs was held constant while central storage size and virtual memory size of the users were increased to maintain a constant memory overcommitment level. CEC model 2964-NC9. Dedicated LPAR with 64 IFL cores in non-SMT mode. The VIRSTOEX program only touches virtual memory above 2 GB. | ||||||||
Apache Scaling Workload Using Linux
The Apache Scaling workload was used to illustrate a Linux-based webserving workload that scales up to a central storage size of 2 TB. The Apache Scaling workload has a small amount of memory overcommitment. The memory overcommitment was kept small to avoid a large volume of paging that would cause the DASD paging subsystem to become the limiting factor for the workload as it were scaled up with cores, memory, and AWM clients and servers.
To allow comparisons with central storage sizes above 1 TB a modified z/VM 6.3 Control Program was used to obtain measurements with central storage sizes larger than the z/VM 6.3 maximum supported central storage size of 1 TB.
Table 2 shows the Apache Scaling workload configurations used.
| Table 2. Apache Scaling Workload Configurations | ||||
| Central storage in GB | 512 | 1024 | 1536 | 2048 |
| IFL cores | 8 | 16 | 24 | 32 |
| AWM clients (1 GB) | 4 | 8 | 12 | 16 |
| AWM servers (30 GB) | 24 | 48 | 72 | 96 |
| Notes: AWM clients and servers are arranged in groups to keep the total number of client/server sessions manageable. Each AWM client has a session with 6 servers. CEC model 2964-NC9. Dedicated LPAR with IFL cores in non-SMT mode. | ||||
Results and Discussion
Sweet Spot Priming Workload Measurements Results
Table 3 contains selected results of z/VM 6.3 measurements. Table 4 contains selected results of z/VM 6.4 measurements. Table 5 contains comparisons of selected results of z/VM 6.4 measurements to z/VM 6.3 measurements.
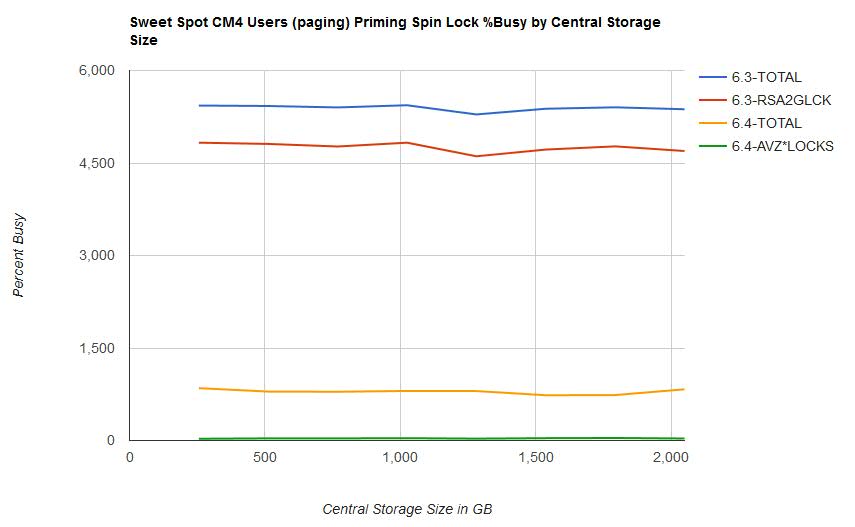
- Overall spin lock contention decreased from z/VM 6.3 to z/VM 6.4. This was the expected result of the enhancement. See Figure 1.
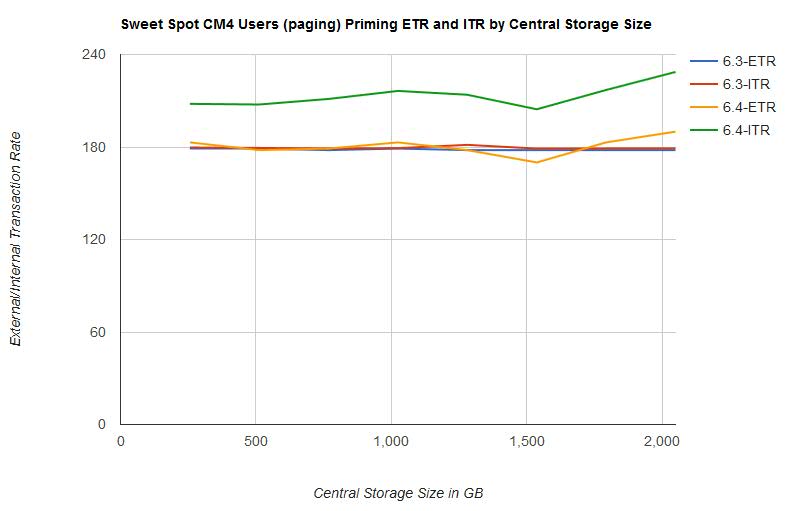
- ETR was relatively the same in both z/VM 6.3 and z/VM 6.4. This was the expected result. The workload is limited by test system DASD paging infrastructure. See Figure 4.
- ITR increased from z/VM 6.3 to z/VM 6.4. See Figure 4.
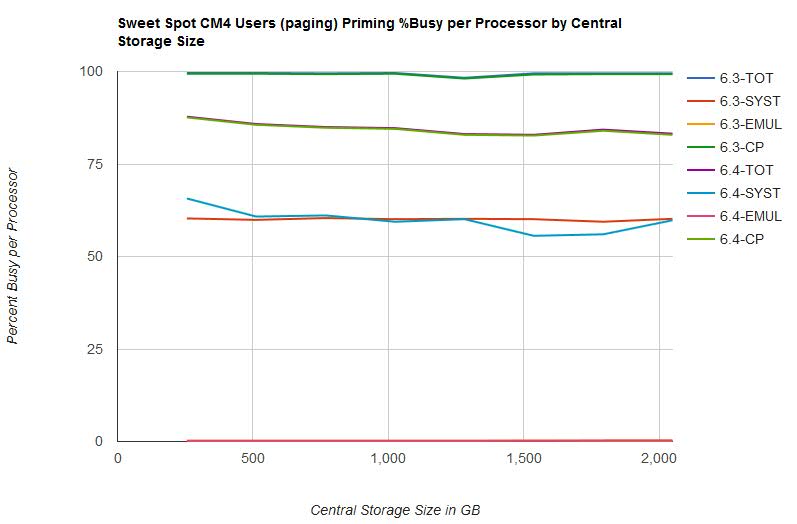
- Processor utilization decreased from z/VM 6.3 to z/VM 6.4. See Figure 5.
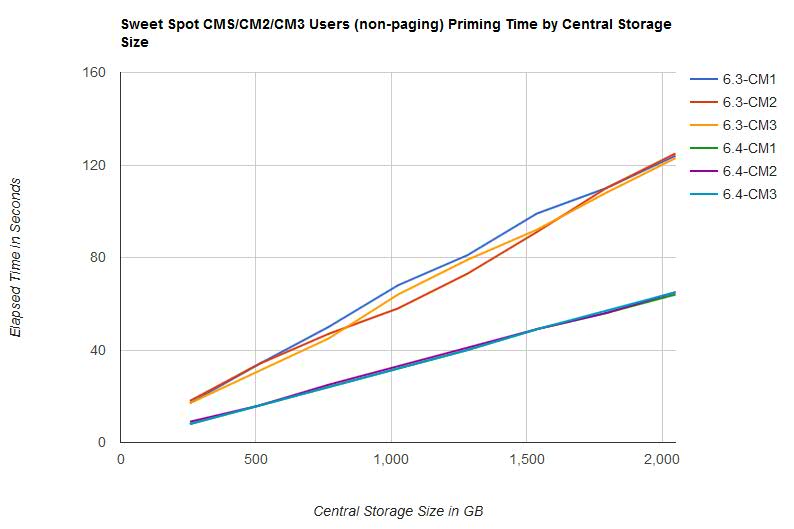
- Elapsed time for CM1, CM2, and CM3 users (non-paging) priming phases decreased from z/VM 6.3 to z/VM 6.4. Elapsed time scaled linearly as central storage size increased. See Figure 2.
- Elapsed time for CM4 users (paging) priming phase remained relatively the same from z/VM 6.3 to z/VM 6.4. The workload is limited by test system DASD paging infrastructure.
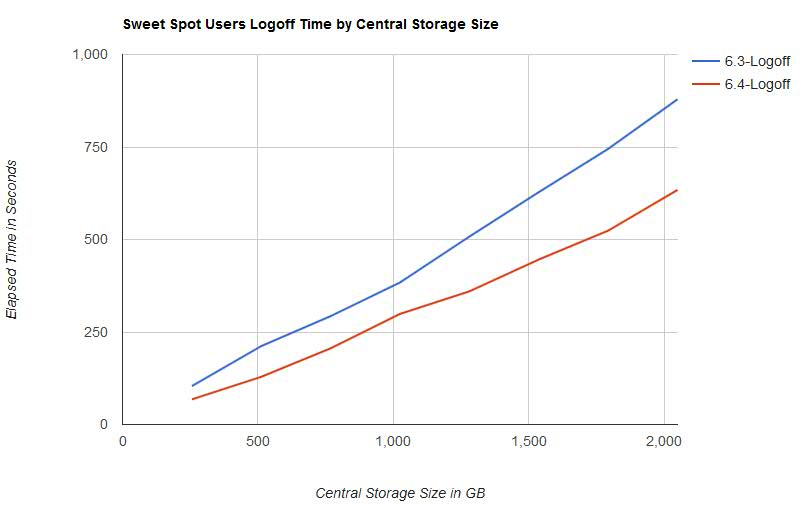
- Elapsed time for logoff of all users decreased from z/VM 6.3 to z/VM 6.4. Elapsed time scaled linearly as central storage size increased. See Figure 3.
Figure 1 illustrates the spin lock percent busy for the CM4 users (paging) priming phase by central storage size.
| Figure 1. Sweet Spot CM4 Users (paging) Priming Spin Lock %Busy by Central Storage Size. |
|
Figure 2 illustrates the elapsed time for the CM1, CM2, and CM3 users (non-paging) priming phases by central storage size.
| Figure 2. Sweet Spot CM1/CM2/CM3 Users (non-paging) Priming Time by Central Storage Size. |
|
Figure 3 illustrates the elapsed time for the logoff phase by central storage size.
| Figure 3. Sweet Spot Users Logoff Time by Central Storage Size. |
|
Figure 4 illustrates the external and internal transaction rate for the CM4 users (paging) priming phase by central storage size.
| Figure 4. Sweet Spot CM4 Users (paging) Priming ETR and ITR by Central Storage Size. |
|
Figure 5 illustrates the percent busy per processor for the CM4 users (paging) phase by central storage size.
| Figure 5. Sweet Spot CM4 Users (paging) Priming %Busy per Processor by Central Storage Size. |
|
Table 3 shows the Sweet Spot Priming workload results on z/VM 6.3.
| Table 3. Sweet Spot Priming Workload z/VM 6.3 results. | ||||||||
| Central Storage in GB | 256 | 512 | 768 | 1024 | 1280 | 1536 | 1792 | 2048 |
| Runid | SSXS6287 | SSXS6288 | SSXS6289 | SSXS628A | SSXS628B | SSXS628C | SSXS628D | SSXS628E |
| ETR | 179.02 | 178.65 | 178.25 | 178.59 | 178.35 | 178.07 | 178.24 | 178.23 |
| ITR | 179.7 | 179.4 | 179.1 | 179.3 | 181.4 | 179.0 | 179.1 | 179.1 |
| Total Busy per Processor | 99.6 | 99.6 | 99.5 | 99.6 | 98.3 | 99.5 | 99.5 | 99.5 |
| System Busy per Processor | 60.3 | 59.9 | 60.4 | 60.1 | 60.2 | 60.1 | 59.4 | 60.2 |
| Emulation Busy per Processor | 0.2 | 0.2 | 0.2 | 0.2 | 0.2 | 0.3 | 0.2 | 0.2 |
| CP Busy per Processor | 99.4 | 99.4 | 99.3 | 99.4 | 98.1 | 99.2 | 99.3 | 99.3 |
| T/V Ratio | 404.3 | 404.3 | 409.2 | 408.9 | 406.3 | 395.1 | 412.5 | 412.6 |
| Total Spin Lock Busy | 5432.05 | 5424.83 | 5401.44 | 5436.85 | 5287.71 | 5380.59 | 5403.33 | 5372.19 |
| RSA2GLCK Spin Lock Busy | 4829.77 | 4809.88 | 4767.82 | 4829.73 | 4609.50 | 4718.28 | 4770.21 | 4694.73 |
| CM1 Users Priming Time | 17 | 34 | 50 | 68 | 81 | 99 | 110 | 124 |
| CM2 Users Priming Time | 18 | 34 | 47 | 58 | 73 | 91 | 110 | 125 |
| CM3 Users Priming Time | 17 | 31 | 45 | 64 | 79 | 92 | 108 | 123 |
| CM4 Users Priming Time | 116 | 234 | 338 | 452 | 565 | 678 | 789 | 903 |
| Logoff Time | 104 | 212 | 293 | 384 | 508 | 628 | 745 | 879 |
| Notes: CEC model 2964-NC9. Dedicated LPAR with 64 IFL cores in non-SMT mode. | ||||||||
Table 4 shows the Sweet Spot Priming workload results on z/VM 6.4.
| Table 4. Sweet Spot Priming Workload z/VM 6.4 results. | ||||||||
| Central Storage in GB | 256 | 512 | 768 | 1024 | 1280 | 1536 | 1792 | 2048 |
| Runid | SSYS8154 | SSYS8155 | SSYS8156 | SSYS8151 | SSYS8157 | SSYS8158 | SSYS8159 | SSYS8150 |
| ETR | 182.64 | 178.16 | 179.50 | 183.30 | 177.78 | 169.57 | 182.95 | 190.30 |
| ITR | 208.0 | 207.6 | 211.2 | 216.4 | 213.9 | 204.5 | 217.0 | 228.7 |
| Total Busy per Processor | 87.8 | 85.8 | 85.0 | 84.7 | 83.1 | 82.9 | 84.3 | 83.2 |
| System Busy per Processor | 65.7 | 60.8 | 61.1 | 59.4 | 60.1 | 55.6 | 56.0 | 59.8 |
| Emulation Busy per Processor | 0.2 | 0.2 | 0.2 | 0.2 | 0.2 | 0.2 | 0.3 | 0.3 |
| CP Busy per Processor | 87.6 | 85.6 | 84.8 | 84.5 | 82.9 | 82.7 | 84.0 | 82.9 |
| T/V Ratio | 356.8 | 356.8 | 351.3 | 341.1 | 350.6 | 360.0 | 336.2 | 329.3 |
| Total Spin Lock Busy | 848.49 | 793.67 | 791.25 | 804.14 | 802.47 | 733.87 | 737.75 | 830.40 |
| AVZLOCKS Spin Lock Busy | 28.90 | 34.52 | 34.79 | 38.38 | 31.04 | 38.20 | 41.31 | 33.18 |
| CM1 Users Priming Time | 8 | 16 | 24 | 32 | 40 | 49 | 56 | 64 |
| CM2 Users Priming Time | 9 | 16 | 25 | 33 | 41 | 49 | 56 | 65 |
| CM3 Users Priming Time | 8 | 16 | 24 | 32 | 40 | 49 | 57 | 65 |
| CM4 Users Priming Time | 116 | 229 | 338 | 444 | 563 | 706 | 767 | 845 |
| Logoff Time | 68 | 129 | 206 | 299 | 360 | 446 | 524 | 634 |
| Notes: CEC model 2964-NC9. Dedicated LPAR with 64 IFL cores in non-SMT mode. | ||||||||
Table 5 shows the comparison of z/VM 6.4 results to z/VM 6.3 results.
| Table 5. Sweet Spot Priming Workload z/VM 6.4 results compared to z/VM 6.3 results. | ||||||||
| Central Storage in GB | 256 | 512 | 768 | 1024 | 1280 | 1536 | 1792 | 2048 |
| ETR | +2.0% | +0.3% | +0.7% | +2.6% | -0.3% | -4.8% | +2.6% | +6.8% |
| ITR | +15.7% | +15.7% | +17.9% | +20.7% | +17.9% | +14.2% | +21.2% | +27.7% |
| Total Busy per Processor | -11.8% | -13.9% | -14.6% | -15.0% | -15.5% | -16.7% | -15.3% | -16.4% |
| System Busy per Processor | +9.0% | +1.5% | +1.2% | -1.2% | -0.2% | -7.5% | -5.7% | -0.7% |
| Emulation Busy per Processor | 0.0% | 0.0% | 0.0% | 0.0% | 0.0% | -33.3% | +50.0% | +50.0% |
| CP Busy per Processor | -11.9% | -13.9% | -14.6% | -15.0% | -15.5% | -16.6% | -15.4% | -16.5% |
| T/V Ratio | -11.7% | -11.7% | -14.1% | -16.6% | -13.7% | -8.9% | -18.5% | -20.2% |
| Total Spin Lock Busy | -84.4% | -85.4% | -85.4% | -85.2% | -84.8% | -86.4% | -86.3% | -84.5% |
| Available List Spin Locks Busy | -99.4% | -99.3% | -99.3% | -99.2% | -99.3% | -99.2% | -99.1% | -99.3% |
| CM1 Users Priming Time | -52.9% | -52.9% | -52.0% | -52.9% | -50.6% | -50.5% | -49.1% | -48.4% |
| CM2 Users Priming Time | -50.0% | -52.9% | -46.8% | -43.1% | -43.8% | -46.2% | -49.1% | -48.0% |
| CM3 Users Priming Time | -52.9% | -48.4% | -46.7% | -50.0% | -49.4% | -46.7% | -47.2% | -47.2% |
| CM4 Users Priming Time | 0.0% | -2.1% | 0.0% | -1.8% | -0.4% | +4.1% | -2.8% | -6.4% |
| Logoff Time | -34.6% | -39.2% | -29.7% | -22.1% | -29.1% | -29.0% | -29.7% | -27.9% |
| Notes: All deltas are percentage difference of z/VM 6.4 measurements compared to z/VM 6.3 measurements. CEC model 2964-NC9. Dedicated LPAR with 64 IFL cores in non-SMT mode. | ||||||||
Apache Scaling Workload Measurements Results
Table 6 contains selected results of z/VM 6.3 measurements. Table 7 contains selected results of z/VM 6.4 measurements. Table 8 contains comparisons of the selected results of z/VM 6.4 measurements to z/VM 6.3 measurements.
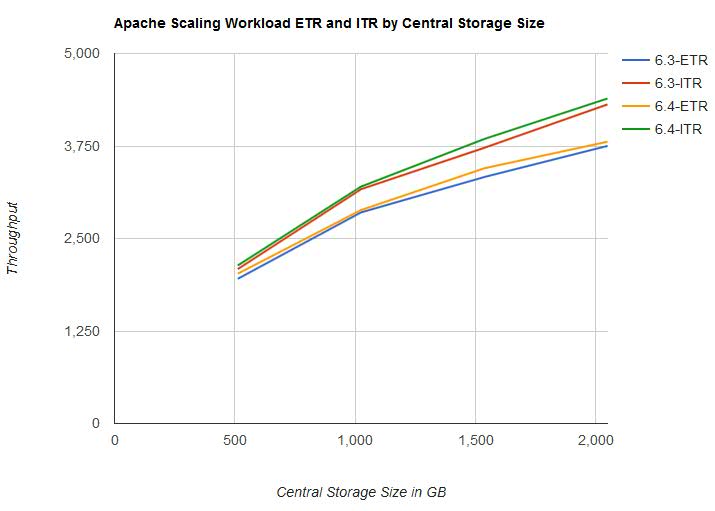
- Both ETR and ITR improved from z/VM 6.3 to z/VM 6.4 with the largest difference occurring between 1 TB and 2 TB of central storage. See Figure 6.
- Processor utilization was mostly unchanged from z/VM 6.3 to z/VM 6.4. There was a small variation at the lower increments of central storage but almost none from 1 TB to 2 TB. See Table 6, Table 7, and Table 8.
Figure 6 illustrates the external and internal transaction rate for the Apache Scaling workload by central storage size.
| Figure 6. Apache Scaling workload - ETR and ITR by Central Storage Size. |
|
Table 6 shows the Apache Scaling workload results on z/VM 6.3.
| Table 6. Apache Scaling workload z/VM 6.3 results. | ||||
| IFL Cores | 8 | 16 | 24 | 32 |
| Central Storage in GB | 512 | 1024 | 1536 | 2048 |
| Run ID | A51X628Z | A1TX628Z | A15X628Z | A2TX628Z |
| ETR | 1955.76 | 2853.14 | 3330.71 | 3751.85 |
| ITR | 2087.30 | 3166.60 | 3725.60 | 4312.50 |
| Total Busy per Processor | 93.7 | 90.1 | 89.4 | 87.0 |
| Emulation Busy per Processor | 68.6 | 66.3 | 61.9 | 59.9 |
| CP Busy per Processor | 25.1 | 23.8 | 27.5 | 27.1 |
| T/V Ratio | 1.37 | 1.36 | 1.44 | 1.45 |
| Notes: CEC model 2964-NC9. Dedicated LPAR with IFL cores in non-SMT mode. | ||||
Table 7 shows the Apache Scaling workload results on z/VM 6.4.
| Table 7. Apache Scaling Workload z/VM 6.4 results. | ||||
| IFL Cores | 8 | 16 | 24 | 32 |
| Central Storage in GB | 512 | 1024 | 1536 | 2048 |
| Run ID | A51Y715Z | A1TY715Z | A15Y715Z | A2TY715Z |
| ETR | 2024.75 | 2884.61 | 3449.17 | 3808.00 |
| ITR | 2135.80 | 3201.60 | 3845.20 | 4392.20 |
| Total Busy per Processor | 94.8 | 90.1 | 89.7 | 86.7 |
| Emulation Busy per Processor | 68.6 | 66.1 | 62.3 | 59.6 |
| CP Busy per Processor | 26.2 | 24.0 | 27.4 | 27.1 |
| T/V Ratio | 1.38 | 1.36 | 1.44 | 1.45 |
| Notes: CEC model 2964-NC9. Dedicated LPAR with IFL cores in non-SMT mode. | ||||
Table 8 shows the Apache Scaling workload results of z/VM 6.4 compared to z/VM 6.3.
| Table 8. Apache Scaling Workload z/VM 6.4 results compared to z/VM 6.3 results. | ||||
| IFL Cores | 8 | 16 | 24 | 32 |
| Central Storage in GB | 512 | 1024 | 1536 | 2048 |
| ETR | +3.5% | +1.1% | +3.6% | +1.5% |
| ITR | +2.3% | +1.1% | +3.2% | +2.0% |
| Total Busy per Processor | +1.2% | 0.0% | +0.3% | -0.3% |
| Emulation Busy per Processor | 0.0% | -0.3% | +0.6% | -0.5% |
| CP Busy per Processor | +4.4% | +0.8% | -0.4% | 0.0% |
| T/V Ratio | +0.7% | 0.0% | 0.0% | 0.0% |
| Notes: All deltas are percentage difference of z/VM 6.4 measurements compared to z/VM 6.3 measurements. CEC model 2964-NC9. Dedicated LPAR with IFL cores in non-SMT mode. | ||||
Summary and Conclusions
Memory Management Serialization Contention Relief provides
performance improvements as central storage size is increased.
The results of IBM measurements demonstrate spin lock contention
is reduced and workloads scale up to the
new z/VM 6.4 maximum supported central storage size of 2 TB.