Storage Management Scaling Improvements
Abstract
z/VM 6.3 provides several storage management enhancements that let z/VM scale real storage efficiently past 256 GB in a storage-overcommitted environment. Because of these enhancements z/VM 6.3 supports 1 TB of real storage and 128 GB of XSTORE.
Workloads affected by the reorder process or by serial searches in previous z/VM releases generally receive benefit from the new storage management algorithms. ETR improvements as high as 1465% were observed.
The Apache and VIRSTOR workloads described below showed scaling at the same rate as the resources they depended on were varied. When resources were scaled linearly with a slope of one, ETR and ITR scaled at the same rate, except when external hardware limitations interfered.
Although some of the specific experiments were limited by configuration, workload scaling to 1 TB was not limited by storage management searching algorithms.
Introduction
This article provides a design overview and performance evaluation for the storage management enhancements implemented in z/VM 6.3. Demand scan uses new memory management techniques such as trial invalidation and a global aging list. These new techniques replace the previous page eviction selection algorithms.
Demand Scan Changes
In previous releases demand scan uses a three-pass scheme based on scheduler lists as a way to visit users and reclaim frames. For several reasons the previous demand scan does not scale well above 256 GB. First, it is too soft on guests in pass 1. Pass 2 is more aggressive but is based on an inaccurate working set size calculation. Pass 3 takes too aggressively from all frame-owned lists and does not honor SET RESERVED specifications. The scheduler lists no longer portray active users in a way that is usable by storage management for choosing good candidates from which to reclaim memory frames.
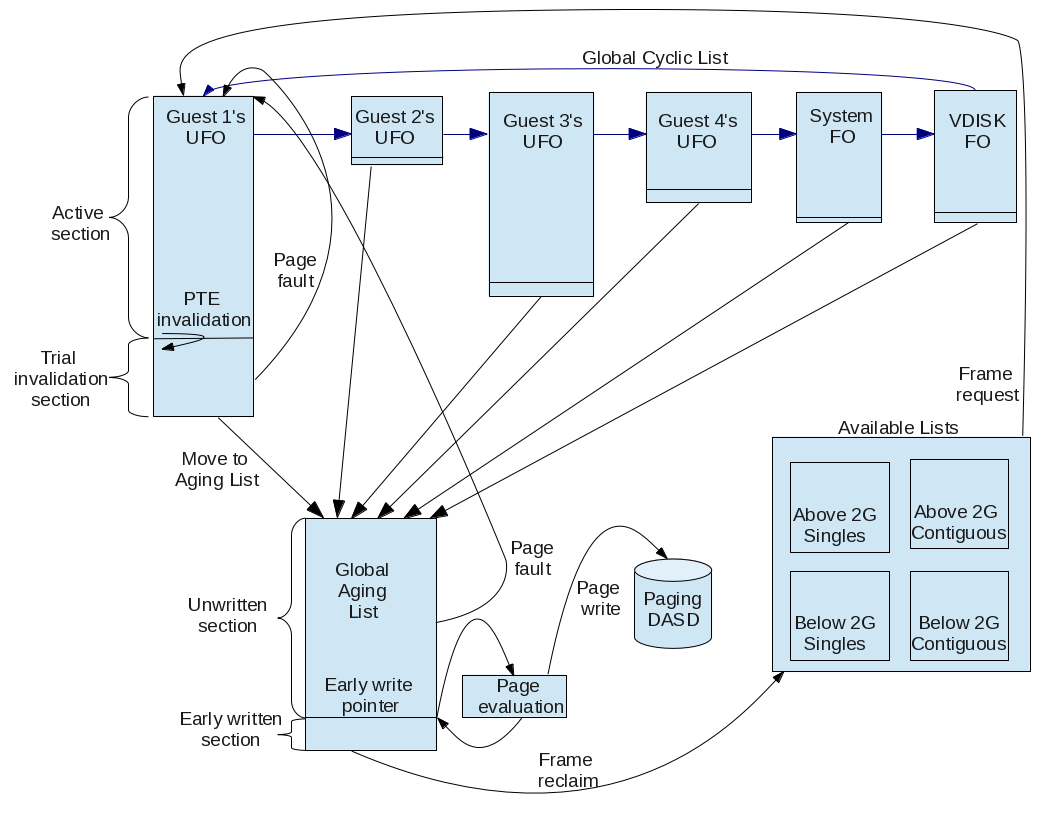
In z/VM 6.3 the pass-based scheme was removed. Demand scan was enhanced to use the system's global cyclic list to navigate users. The global cyclic list is used to locate the user-frame-owned lists (UFOs), the system-frame-owned list, and the VDISK-frame-owned list. Demand scan navigates the cyclic list in order visiting each entity in it and evaluating its frame list for adjustment. In Figure 1 the global cyclic list is shown with blue arrows.
UFOs and Invalid-but-Resident State
In an environment where storage is overcommitted, UFOs now have a section where pages' page table entries are invalidated on a trial basis to test how long pages remain unreferenced. This UFO section is called the invalid-but-resident (IBR) section and is shown in Figure 1. When a guest references a page that has an invalid page table entry, a page fault occurs and the page table entry is revalidated. This is called revalidation and is shown in Figure 1.
A UFO's IBR section target size is based on the guest's current IBR section size prorated to the ratio of its revalidation to invalidation ratio against the system average revalidation to invalidation ratio. This effectively compares the guest's revalidation to invalidation rate to the system average and raises its invalidation section target size if it is below average and lowers it if it is above average.
Working set size is no longer used to determine guest residency targets.
The Global Aging List
z/VM 6.3 also introduces the global aging list, also shown in Figure 1. The global aging list lets z/VM do system-wide tracking of recency of reference of pages preliminarily targeted for eviction. In this way it provides similar function to XSTORE with reduced overhead.
Frames added to the global aging list come from the bottoms of the various UFOs. These frames are added to the global aging list at its top. Frames move toward the bottom of the global aging list because of subsequent adds at the list's top or because of revalidations causing dequeues. When frames reach the early write pointer, they are evaluated as to whether they should be written to DASD. Frame reclaims happen at the bottom of the list.
A fault taken on a page held in a frame residing on the global aging list results in revalidation of the page's page table entry and pointer adjustments that move the frame to the top of the user's UFO active section.
The global aging list is more efficient than XSTORE because the list is managed with pointer manipulation rather than by moving page contents.
The system begins building the global aging list only when DPA minus in-use frames is less than the aging list target size.
The global aging list target size can be set via command or system configuration file entry. The default aging list target size is 2% of the dynamic paging area (DPA). The maximum aging list size is 5% of the DPA and the minimum size is 1 MB.
Early Writes
z/VM 6.3 introduces early writing of pages held in frames queued near the bottom of the global aging list. Early writing helps expedite frame reclaim.
Early writing's goal is to keep the bottom 10% of the global aging list prewritten. The percentage of the aging list prewritten can float because of changes in the system and constraint level. In a system where writing to paging DASD is the constraint, the prewritten section can go empty.
When the prewritten section is empty and the system needs frames, reclaim of a frame has to wait for the frame's content to be written to DASD. This is called write-on-demand.
Early writing can be set on or off via command or system configuration file entry.
Improved Channel Programs
In z/VM 6.3 the paging subsystem's channel programs are enhanced to use Locate Record channel-command words. These improved paging channel programs can read or write discontiguous slots on DASD.
No Rewriting of Unchanged Pages
Paging algorithms were enhanced to let pages remain associated with their backing slots on DASD when they are read. This approach lets the system avoid rewriting unchanged pages yet still lets paging blocks be formed when the frames are reclaimed.
Block Reads
Reading pages from DASD is still a block-read operation, the paging blocks having been formed at frame reclaim time. When a block read happens, one of the pages read is the one faulted upon, and the rest come in solely because they are part of the block. These "along for the ride" pages, called pages not referenced (PNRs), are inserted into the UFO at the top of the IBR section. In previous releases PNRs were inserted at the top of the UFO. The change lets demand scan more quickly identify pages not being referenced.
The Available List
In z/VM 6.3 available list management was improved in a number of different ways.
The first improvement relates to how demand scan is triggered. Requests to allocate frames come into storage management via four different interfaces: TYPE=ANY singles or contiguous, which can be satisfied from either below-2-GB or above-2-GB storage, and TYPE=BELOW singles or contiguous, which can be satisfied by only below-2-GB frames. z/VM 6.2 initiated list replenishment by looking at only the available list populations. The change in z/VM 6.3 is that after each call to allocate storage, the system now evaluates the number of frames available to satisfy the TYPE=ANY calls, regardless of the frame lists that might be used to satisfy them. When a low threshold is reached for either of the TYPE=ANY calls, demand scan is initiated to refill the lists.
Further, TYPE=ANY requests are now satisfied from the top of storage down, using the below-2-GB frames last. This helps reduce the likelihood of a below-2-GB constraint.
Last, when below-2-GB frames need to be replenished, storage management now finds them via a scan of the real frame table instead of via scans of frame-owned lists. This eliminates long searches in large storage environments.
Maximum Virtual Storage
Mappable virtual storage is increased from 8 TB to 64 TB. This was accomplished by increasing the count of Page Table Resource Manager (PTRM) address spaces from 16 to 128. A PTRM space contains structures such as page tables. Each PTRM address space can map 512 GB of guest real storage. All PTRM address spaces are initialized at IPL.
| Figure 1. Memory Management Algorithm Visualization |
 |
Method
z/VM 6.3 memory management enhancements were evaluated with Virtual Storage Exerciser (VIRSTOR) and Apache to create specialized workloads that would exercise known serialization and search conditions and evaluate scalability up to 1 TB of real storage. A wide variety of these specialized VIRSTOR and APACHE workloads were used.
Storage management algorithms of previous z/VM releases were dependent on efficient use of XSTORE while z/VM 6.3 algorithms do not depend on XSTORE. For z/VM 6.3 measurements, XSTORE was included in the configuration only to demonstrate why its use is not recommended. For direct comparison, z/VM 6.2 measurements were generally completed both with and without XSTORE and z/VM 6.3 was compared to the better of the z/VM 6.2 measurements.
For some z/VM 6.2 measurements, reorder processing was turned off and used as a comparison base for z/VM 6.3.
Specific configurations for comparison included storage sizes from 2.5 GB to 256 GB and dedicated processors from 1 to 24. Only four specific measurements are discussed in this article, but a summary of the others is included in Summary of Key Findings.
The LPAR used for scalability had dedicated processors but was subject to a variable amount of processor cache contention interference from other LPARs. Observed differences are discussed as needed in the results section.
The LPAR used for scalability had access to a single DASD controller for paging volumes. Although the defined paging volumes had dedicated logical control units, dedicated switches, and dedicated paths, interference from other systems also using the same DASD controller caused variation in the results.
The total capacity of the DASD subsystem limited the results of certain experiments. Observed differences are discussed as needed in the results section.
Specific configurations for scalability included storage sizes from 128 GB to 1 TB and dedicated processors from 2 to 8.
New z/VM monitor data available with the storage management support is described in Performance Management.
Results and Discussion
7 GB VIRSTOR
The 7 GB VIRSTOR workload consists of two groups of users. The first group, CM1, consists of two smaller VIRSTOR users that are actively looping through 13 MB of storage and changing every other page they touch. The second group, CM2, consists of 12 larger VIRSTOR users actively looping through 700 MB of storage and changing 10% of the pages they touch.
Fairness for this workload is evaluated in two different ways: fairness within groups and system-wide fairness.
-
Fairness within groups is
based on transaction rate. It is
calculated
by dividing the lowest loop count by the
highest loop count to determine how much
individual guests varied.
A result of 1 shows
perfect fairness in this category.
- System-wide fairness is at its core a statement about the system-wide correctness of page eviction. Demand scan aims to keep in storage the pages that are most frequently used. If its decisions are correct, higher processor utilization and decreased page wait both result.
Enhancements in z/VM 6.3 improved fairness within the CM1 group by 4% to a ratio of 0.99. z/VM 6.3 also improved fairness within the CM2 group by 59% to a value of 1.0.
System-wide fairness also improved, resulting in a 14% decrease in page wait and a 355% increase in processor utilization.
CM1 users' resident pages increased 298% to 3150. This is the exact amount of storage the CM1 users were designed to touch. This too shows that z/VM is keeping the most frequently used pages in storage.
CM1 users are revalidating their pages prior to them getting to the early write pointer. Figure 2 shows DASD writes in the first interval where the CM1 user's unneeded pages were written out. It shows no writing after the unneeded pages were written out. Zero DASD reads shows that the pages that were written were good choices because they were never read.
DASD writes for the CM1 users were reduced 99.4% and DASD reads were reduced 100%, leading to 1704% more virtual CPU used by the CM1 users. This resulted in the overall workload improvement.
| Figure 2. Excerpt of FCX 291 Page Activity Log for User CM100001 |
          <--------------------- Storage --------------->
                                             <Movement/s>
 Interval <--- Transition/s ----> <-Steal/s->
 End Time  Inst Relse Inval Reval Ready NoRdy Reads Write
 >>Mean>> 46837  48.2 7573K 7527K 24728 22034     0 46761
 22:28:25 1110K  1170 8247K 7708K 15715  522K     0  537K
 22:28:55     0     0 9069K 9069K     0     0     0     0
 22:29:25     0     0 8809K 8809K     0     0     0     0
 22:29:55     0     0 9208K 9208K     0     0     0     0
 22:30:25     0     0 8761K 8761K     0     0     0     0
 22:30:55     0     0 8666K 8666K     0     0     0     0
 22:31:25     0     0 8600K 8600K     0     0     0     0
 22:31:55     0     0 8509K 8509K     0     0     0     0
 22:32:25     0     0 8150K 8150K     0     0     0     0
 22:32:55     0     0 8294K 8294K     0     0     0     0
 22:33:25     0     0 8273K 8273K     0     0     0     0
 22:33:55     0     0 8149K 8149K     0     0     0     0
 22:34:25     0     0 7950K 7950K     0     0     0     0
 22:34:55     0     0 7748K 7748K     0     0     0     0
 22:35:25     0     0 8170K 8170K     0     0     0     0
 22:35:55     0     0 7485K 7485K     0     0     0     0
 22:36:25     0     0 7712K 7712K     0     0     0     0
 22:36:55     0     0 7814K 7814K     0     0     0     0
|
The number of pages on DASD increased 56% because of the new scheme used that does not release backing slots when pages are read.
This measurement received a benefit from the DASD subsystem keeping the backing page slots. It avoided rewriting pages whose contents were already on DASD, resulting in a 77% decrease in the page write rate.
The count of PTRM address spaces increased from 1 to 128, because all PTRM address spaces are now initialized at IPL.
Figure 3 is an excerpt from a z/VM Performance Toolkit FCX296 STEALLOG report introduced in z/VM 6.3. It shows all of the following things:
- Demand scan was active 20% of the time on average.
- Demand scan produced an average of 399 MB worth of frames per second.
- Demand scan was writing on demand during the startup intervals of this workload.
- User pages were invalidated at a rate of 414 MB per second.
- User pages were revalidated in the UFO IBR section at a rate of 324 MB per second.
- Aging list revalidations averaged 69 MB per second. This rate being lower than the invalidations shows that pages moved to the aging list were good choices for reclaim.
Revalidation counts include PNRs that are revalidated. Because of this, the revalidation counts can be greater than the invalidation counts.
| Figure 3. Excerpt of FCX296 STEALLOG |
            Pct <---- Storage/s------->
 Interval  Time Total Write <--User--->  AgeL
 End Time  Actv Stoln OnDmd Inval Reval Reval
 >>Mean>>  20.2  399M 8067K  414M  324M   69M
 22:28:25  10.9  319M  144M  335M  191M 7230K
 22:28:55  23.9  564M   13M  581M  523M   40M
 22:29:25  23.4  520M    .0  537M  455M   64M
 22:29:55  23.3  500M  1775  518M  418M   82M
 22:30:25  22.4  457M  283K  474M  374M   82M
 22:30:55  22.6  445M    .0  462M  360M   85M
 22:31:25  22.7  440M 60484  456M  356M   84M
 22:31:55  23.0  437M    .0  453M  352M   84M
 22:32:25  22.1  414M    .0  430M  333M   81M
 22:32:55  22.4  422M    .0  438M  339M   83M
 22:33:25  22.3  420M    .0  436M  337M   83M
 22:33:55  22.2  415M    .0  431M  334M   81M
 22:34:25  22.0  403M    .0  419M  324M   80M
 22:34:55  21.6  391M    .0  406M  313M   78M
 22:35:25  22.7  416M    .0  432M  334M   81M
 22:35:55  20.4  379M    .0  394M  304M   75M
 22:36:25  21.4  391M    .0  406M  314M   77M
 22:36:55  21.9  396M    .0  411M  318M   78M
|
| Table 1. 7 GB VIRSTOR | ||||
| Run ID | 7VW7280 | 7VX7280 | Delta | Pct |
| CP Level | 6.2.0 | 6.3.0 | ||
| ETR | 1.9451 | 30.4431 | 28.4980 | 1465.1 |
| ITR | 11.86 | 40.75 | 28.89 | 243.6 |
| Total Util/Proc | 16.4 | 74.7 | 58.3 | 355.5 |
| CM1 Fairness | 0.952 | 0.991 | 0.039 | 4.1 |
| CM2 Fairness | 0.629 | 1.000 | 0.371 | 59.0 |
| CM1 ETR | 1.6824 | 30.3293 | 28.6469 | 1702.7 |
| CM2 ETR | 0.2627 | 0.1138 | -0.1489 | -56.7 |
| SYSTEM PGW Wait | 90 | 77 | -13 | -14.4 |
| Page slot util | 16 | 25 | 9 | 56.3 |
| PTRM Spaces | 1 | 128 | 127 | 12700 |
| DASD Pg Write Rate | 62393 | 14187 | -48206 | -77.3 |
| DASD Pg Read Rate | 62539 | 101000 | 38461 | 61.5 |
| CM1 group Virt CPU Sec | 26.64 | 480.6 | 454.0 | 1704.2 |
| CM1 group DASD Reads | 2041 | .0 | -2041.0 | -100.0 |
| CM1 group DASD Writes | 1820 | 11.4 | -1808.6 | -99.4 |
| CM1 group Resident Pages | 790 | 3150 | 2360 | 298.7 |
| CM2 group DASD Reads | 4883 | 8466 | 3583 | 73.4 |
| CM2 group DASD Writes | 4901 | 1181 | -3720 | -75.9 |
| Notes: 2097-726, 3 dedicated CPUs, 7 GB real. Four 8.0 Gbps Fibre-channel switched channels, 2107-E8 control unit, 34 3390-3 volumes. 12 CM2 users, 2 CM1 users. | ||||
Apache 3 GB XSTORE
The Apache 3 GB XSTORE workload is designed to page to only XSTORE in z/VM 6.2. Because of the changes in z/VM 6.3, XSTORE is no longer as efficient and cannot be used as a paging device as it was in past releases. Table 2 shows that z/VM 6.3 does not get the benefit from XSTORE that z/VM 6.2 did.
Using XSTORE in this environment results in wasted page writes to DASD. These writes take system resources away from the rest of the workload. In z/VM 6.3 a page needs to be written to DASD before it is put into XSTORE. This constrains XSTORE writes to the speed of the DASD.
As a result of using z/VM 6.3 on a non-recommended hardware configuration, ETR decreased 8% and ITR decreased 12%.
If you have a system that pages to only XSTORE, similar to the Apache 3 GB XSTORE, IBM recommends that you set the agelist to the minimum size and turn off agelist early writes.
|
Table 2. Apache 3 GB XSTORE | ||||
| Run ID | APXW9120 | APXXM820 | Delta | Pct |
| CP Level | 6.2.0 | 6.3.0 | ||
| ETR | 394.148 | 362.740 | -31.408 | -8.0 |
| ITR | 417.79 | 366.70 | -51.09 | -12.2 |
| Xstor Total Rate | 146000 | 132000 | -14000 | -9.6 |
| Xstor Migr Rate | 0 | 0 | 0 | - |
| Xstor PGOUT Rate | 73241 | 66047 | -7194 | -9.8 |
| Xstor PGIN Rate | 73182 | 65980 | -7202 | -9.8 |
| DASD Pg Write Rate | 0 | 3450 | 3450 | - |
| DASD Pg Read Rate | 0 | 0 | 0 | - |
| Notes: 2827-772, 3 dedicated CPUs. Four 8.0 Gbps Fibre-channel switched channels, 2107-E8 control unit, 34 3390-3 volumes. | ||||
Maximum z/VM 6.2 Configuration
Although Summary of Key Findings addresses the comparison of z/VM 6.3 measurements to z/VM 6.2 measurements, two specific comparisons are included here to demonstrate attributes of the storage management enhancements.
Workloads affected by the reorder process or by serial searches can receive benefit from the new storage management algorithms. Workloads not affected by the reorder process or serial searches show equality.
Following are two specific workload comparisons at the maximum supported z/VM 6.2 configuration (256 GB real plus 128 GB XSTORE) versus the z/VM 6.3 replacement configuration (384 GB real). One workload shows benefit and the other shows equality.
Maximum z/VM 6.2 Configuration, VIRSTOR
Table 3 contains a comparison of selected values between z/VM 6.3 and z/VM 6.2 for a VIRSTOR workload. This workload provides a good demonstration of the storage management change between these two releases.
The 3665 reorders for z/VM 6.2 are gone in z/VM 6.3. Each reorder processed a list in excess of 500,000 items. This accounts for a portion of the reduction in system utilization.
Although other serial searches are not as easy to quantify, the effect of their elimination is best represented by the 99% reduction in spin time and the 84% reduction in system utilization.
Moving the z/VM 6.2 XSTORE to real storage in z/VM 6.3 eliminated 77,000 XSTORE paging operations per second, which accounts for some of the reduction in system time. This would be partially offset by the 53% increase in DASD paging rate.
The 28% reduction in T/V ratio is another indicator of the benefit from elimination of serial searches.
This workload also provides a good demonstration of changes in the below-2-GB storage usage. There are no user pages below 2 GB in z/VM 6.2 but more than 88% of the below-2-GB storage contains user pages in z/VM 6.3.
Based on the z/VM 6.3 algorithm to leave pages in the same DASD slot, one would expect the number of pages on DASD to be higher than for z/VM 6.2. However, for this workload the number of pages on DASD increased less than 5%. Revalidation of pages prior to reaching the early write point is the key, and perhaps this is a valid demonstration of the benefit of the z/VM 6.3 selection algorithm.
Overall, the z/VM 6.3 changes provided a 70% increase in transaction rate and a 71% increase in ITR for this workload.
|
Table 3. Maximum z/VM 6.2 Configuration, VIRSTOR | ||||
| Run ID | STWG522W | STXG614H | Delta | Pct |
| CP Level | 6.2.0 | 6.3.0 | ||
| SYSGEN Storage (GB) | 256 | 384 | 128 | 50.0 |
| Total CP Xstor (GB) | 128 | 0 | -128 | -100.0 |
| ETR | 0.0746 | 0.1274 | 0.0528 | 70.8 |
| ITR | 77.77 | 133.63 | 55.86 | 71.8 |
| System Util/Proc | 31.4 | 5.0 | -26.4 | -84.1 |
| Pct Spin Time | 5.655 | .033 | -5.622 | -99.4 |
| Page slot util | 9 | 10 | 1 | 11.1 |
| Total Util/Proc | 96.6 | 94.9 | -1.7 | -1.8 |
| DASD Service Time | 1.5 | 1.1 | -0.4 | -26.7 |
| DASD Pg Total Rate | 61836 | 94721 | 32885 | 53.2 |
| T/V Ratio | 1.51 | 1.08 | -0.43 | -28.5 |
| Reorder Count | 3665 | na | ||
| Reorder Res Gbytes | 7629.39 | na | ||
| Resident Pages <2G | 0 | 466465 | 466465 | - |
| Resident Pages >2G | 61429536 | 94748945 | 33319409 | 54.2 |
| Resident DASD | 53668080 | 55681740 | 2013660 | 3.8 |
| CP Util/Proc | 32.4 | 6.9 | -25.5 | -78.7 |
| Emul Util/Proc | 64.2 | 88.0 | 23.8 | 37.1 |
| Master Util/Proc | 96.7 | 94.6 | -2.1 | -2.2 |
| Master Emul Util/Proc | 51.6 | 82.9 | 31.3 | 60.7 |
| Notes: 2817-744, 4 dedicated CPUs. Four 8.0 Gbps Fibre-channel switched channels, 2107-E8 control unit, 48 3390-54 volumes. 32 VIRSTOR1 users (20 GB, SHARE 100), 32 VIRSTOR2 users (20 GB, SHARE 200), 32 VIRSTOR3 users (20 GB, SHARE 300), 32 VIRSTOR4 users (20 GB, SHARE 400). VIRSTOR parms (AE B=32000 C=2 G=600 I=20 N=160 RD=16 RW=7200 S=1250 T=1800 WR=16 Z=120). | ||||
Maximum z/VM 6.2 Configuration, Apache
Table 4 contains a comparison of selected values between z/VM 6.3 and z/VM 6.2 for an Apache workload. This workload provides a good demonstration of the storage management changes between these two releases.
The 603 reorders for z/VM 6.2 are gone in z/VM 6.3. Each reorder processed a list in excess of 600,000 items. This accounts for a portion of the reduction in system utilization.
Although other serial searches are not as easy to quantify, the effect of their elimination is best represented by the 89% reduction in spin time and the 84% reduction in system utilization.
Moving the z/VM 6.2 XSTORE to real storage in z/VM 6.3 eliminated 82,000 XSTORE paging operations per second, which would account for some of the reduction in system time. There was also an 11.5% decrease in DASD paging rate.
The 6.6% reduction in T/V ratio is much smaller than the storage management metrics. This occurs because storage management represents a smaller percentage of this workload than it did in the previous workload.
This workload also provides a good demonstration of changes in the below-2-GB storage usage. There are only 73 user pages below 2 GB in z/VM 6.2 but more than 90% of the below-2-GB storage contains user pages in z/VM 6.3.
Based on the z/VM 6.3 algorithm to leave pages in the same DASD slot, one would expect the number of pages on DASD to be higher than for z/VM 6.2. However, for this workload the number of pages on DASD decreased 1.2%. Revalidation of pages prior to reaching the early write point is the key, and perhaps this is a valid demonstration of the benefit of the z/VM 6.3 selection algorithm.
Although many of the specific storage management items showed similar percentage improvement as the previous workload, storage management represents a much smaller percentage of this workload, so the overall results didn't show much improvement.
Overall, the z/VM 6.3 changes provided a 1.3% increase in transaction rate and a 1.5% decrease in ITR for this workload.
| Table 4. Maximum z/VM 6.2 Configuration, Apache | ||||
| Run ID | A38W952A | A38XGLD0 | Delta | Pct |
| SYSGEN Storage (GB) | 256 | 384 | 128 | 50.0 |
| Total CP Xstor (GB) | 128 | 0 | -128 | -100.0 |
| ETR | 720.332 | 729.670 | 9.338 | 1.3 |
| ITR | 716.23 | 705.56 | -10.67 | -1.5 |
| CP Level | 6.2.0 | 6.3.0 | ||
| Resident Pages <2G | 73 | 486837 | 486764 | >9999 |
| Pct Spin Time | 1.061 | .112 | -0.949 | -89.4 |
| DASD Service Time | 5.4 | 5.1 | -0.3 | -5.6 |
| DASD Pg Total Rate | 33574 | 29702 | -3872 | -11.5 |
| Resident DASD | 34066034 | 33670739 | -395295 | -1.2 |
| Reorder Count | 603 | na | ||
| Reorder Res Gbytes | 1544.41 | na | ||
| CP Util/Proc | 33.1 | 26.9 | -6.2 | -18.7 |
| System Util/Proc | 7.0 | 1.1 | -5.9 | -84.3 |
| T/V Ratio | 1.52 | 1.42 | -0.10 | -6.6 |
| Xstor Total Rate | 82489 | 0 | -82489 | -100.0 |
| Xstor Migr Rate | 15999 | 0 | -15999 | -100.0 |
| DASD Pg Read Rate | 16361 | 16047 | -314 | -1.9 |
| DASD Pg Write Rate | 17214 | 13655 | -3559 | -20.7 |
| Notes: 2817-744, 9 dedicated CPUs. Four 8.0 Gbps Fibre-channel switched channels, 2107-E8 control unit, 48 3390-54 volumes. | ||||
Non-overcommitted Storage Scaling
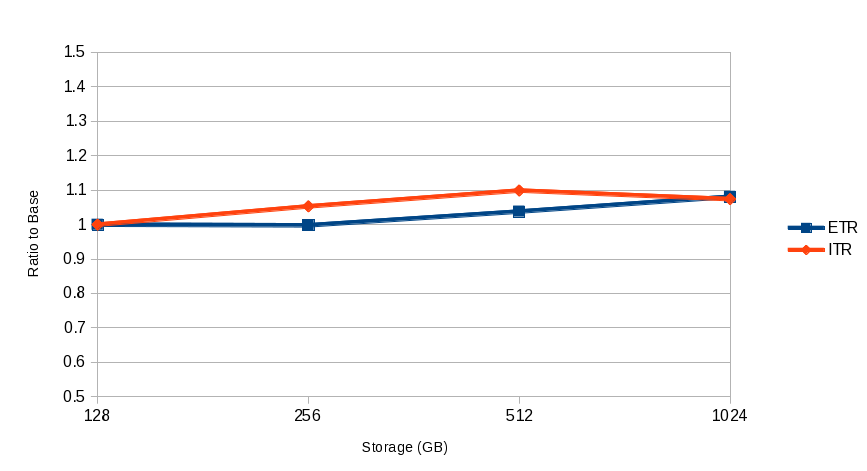
This set of measurements was designed to evaluate storage scaling from 128 GB to 1 TB for a non-overcommitted workload. All measurements used the same number of processors and a primed VIRSTOR workload that touched all of its pages. A virtual storage size was selected for each measurement that would use approximately 90% of the available storage. If there are no scaling issues, transaction rate and ITR should remain constant.
z/VM 6.2 avoided some known serial searches by not using below-2-GB storage for user pages in certain storage sizes. Because z/VM 6.3 uses below-2-GB storage for user pages in all supported configurations, the purpose of this experiment was to verify that the scalability of extended storage support was not affected by the new below-2-GB storage algorithm. Because only 90% of the storage is used in each configuration, this verifies the z/VM algorithm of using the below-2-GB last instead of first. Full utilization of below-2-GB storage is evaluated in the overcommitted scalability section.
Table 5 contains a comparison of selected results for the VIRSTOR non-overcommitted storage scaling measurements.
Results show nearly perfect scaling for both the transaction rate and ITR. Figure 4 illustrates these results.
Results show nearly perfect fairness among the users. Fairness is demonstrated by comparing the minimum loops and maximum loops completed by the individual VIRSTOR users. The variation was less that 3% in all four measurements.
| Table 5. Non-overcommitted Storage Scaling | ||||
| Run ID | STXG614I | STXG614J | STXG614K | STXG614L |
| SYSGEN Storage (GB) | 128 | 256 | 512 | 1024 |
| SYSGEN Storage ratio | 1.000 | 2.000 | 4.000 | 8.000 |
| VIRSTOR End ADDR (GB) | 16 | 30 | 58 | 114 |
| VIRSTOR1 ETR ratio | 1.000 | 0.998 | 1.038 | 1.081 |
| VIRSTOR1 Min Loops | 543 | 273 | 143 | 75 |
| VIRSTOR1 Max Loops | 556 | 278 | 146 | 76 |
| ITR ratio | 1.000 | 1.053 | 1.099 | 1.074 |
| Resident Pages <2G | 24 | 24 | 24 | 24 |
| Resident Pages >2G | 29424000 | 58800000 | 117504000 | 234960000 |
| PTRM Reside | 230000 | 460000 | 918000 | 1836000 |
| Resident Pages <2G ratio | 1.000 | 1.000 | 1.000 | 1.000 |
| Resident DASD ratio | 1.000 | 5.400 | 4.967 | 1.300 |
| Resident Pages >2G ratio | 1.000 | 1.998 | 3.993 | 7.985 |
| PTRM Reside ratio | 1.000 | 2.000 | 3.991 | 7.983 |
| Notes: 2817-744, 4 dedicated CPUs. Four 8.0 Gbps Fibre-channel switched channels, 2107-E8 control unit, 48 3390-54 volumes. 8 users. VIRSTOR parms (C=3 I=4 T=600 V=4). | ||||
| Figure 4. Non-overcommitted VIRSTOR Scaling Curve |
 |
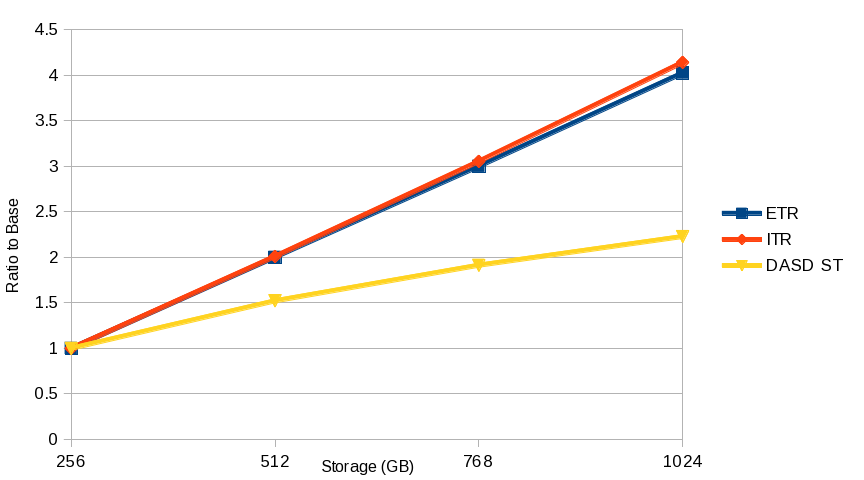
Overcommitted VIRSTOR Scaling of Storage, Processors, Users, and Paging Devices
For this scaling experiment, all resources and the workload were scaled by the same ratio. For perfect scaling, the transaction rate and ITR would scale with the same ratio as the resources.
Although number of paging devices was scaled as other resources, they are all on the same real DASD controller, switches, and paths. Because of this, DASD control unit cache did not scale at the same ratio as other resources. DASD service time is highly dependent on sufficient control unit cache being available.
Table 6 contains a comparison of selected results for the VIRSTOR storage-overcommitted scaling measurements.
For the set of four measurements, as storage, processors, users, and paging devices increased, DASD service time increased more than 100%. Despite the increase in DASD service time, DASD paging rate, number of resident pages, number of PTRM pages, and number of DASD resident pages increased in proportion to the workload scaling factors.
Despite the increase in DASD service time, processor utilization decreased by less than 3% across the set of four measurements.
Figure 5 illustrates that VIRSTOR transaction rate scaled nearly perfectly with the workload and configuration scaling factors. This is a very good sign that the new storage management algorithms should not prevent the expected scaling.
ITR scaled nearly perfectly with the workload and configuration scaling factors. This is another very good sign that the new storage management algorithms should not prevent the expected scaling.
|
Table 6. Overcommited VIRSTOR Scaling | ||||
| Run ID | STXG614F | STXG614E | STXG614D | STXG614C |
| SYSGEN Storage (GB) | 256 | 512 | 768 | 1024 |
| SYSGEN Storage ratio | 1.000 | 2.000 | 3.000 | 4.000 |
| Processors | 2 | 4 | 6 | 8 |
| Paging devices | 12 | 24 | 36 | 48 |
| Paging devices ratio | 1.000 | 2.000 | 3.000 | 4.000 |
| VIRSTOR Users | 88 | 176 | 264 | 352 |
| VIRSTOR Users ratio | 1.000 | 2.000 | 3.000 | 4.000 |
| Total Util/Proc | 98.5 | 98.0 | 96.8 | 95.8 |
| VIRSTOR ETR ratio | 1.000 | 2.000 | 3.000 | 4.023 |
| ITR ratio | 1.000 | 2.009 | 3.053 | 4.140 |
| DASD Pg Total Rate ratio | 1.000 | 1.908 | 2.789 | 3.575 |
| Resident Pages Total ratio | 1.000 | 2.001 | 3.002 | 4.004 |
| Resident DASD ratio | 1.000 | 1.988 | 2.957 | 3.930 |
| PTRM Reside ratio | 1.000 | 1.997 | 2.981 | 3.973 |
| DASD Service Time ratio | 1.000 | 1.522 | 1.913 | 2.228 |
| VIRSTOR1 Page Fairness | 0.986 | 0.979 | 0.982 | 0.979 |
| VIRSTOR2 Page Fairness | 0.989 | 0.986 | 0.981 | 0.983 |
| VIRSTOR3 Page Fairness | 0.989 | 0.985 | 0.982 | 0.978 |
| VIRSTOR4 Page Fairness | 0.990 | 0.983 | 0.985 | 0.986 |
| Notes: 2817-744. Four 8.0 Gbps Fibre-channel switched channels, 2105-E8 control unit, 3390-54 volumes. VIRSTOR1 users (20 GB, SHARE 100), VIRSTOR2 users (20 GB, SHARE 200), VIRSTOR3 users (20 GB, SHARE 300), VIRSTOR4 users (20 GB, SHARE 400). VIRSTOR parms (AE B=512000 C=2 I=20 N=1280 RD=16 RW=57600 S=104 T=1800 WR=16 Z=960). | ||||
| Figure 5. Overcommitted VIRSTOR Scaling Curve |
 |
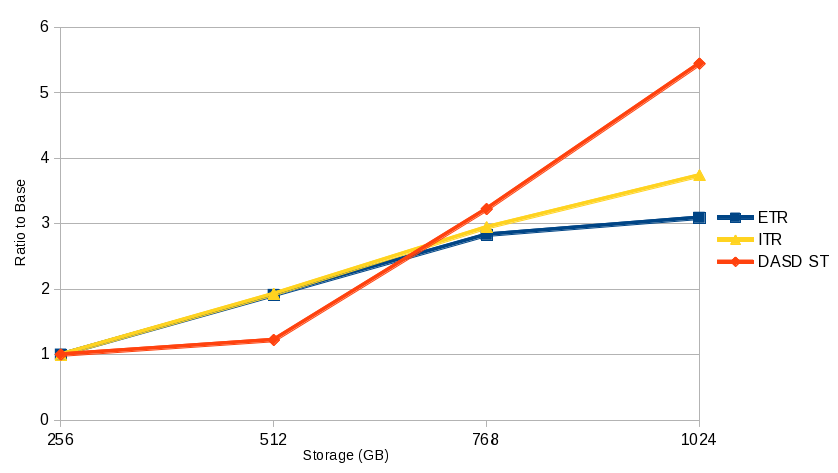
Overcommitted Apache Scaling of Storage, Processors, Users, and Paging Devices
For the Apache scaling measurements, storage, processors, AWM clients, and Apache servers were increased by the same ratio.
The full paging infrastructure available to the measurement LPAR was used in all measurements. All paging devices are on the same real DASD controller, switches, and paths. This DASD controller is also shared with other LPARs and other CECs thus exposing measurements to a variable amount of interference.
Table 7 contains a comparison of selected results for the Apache storage-overcommitted scaling measurements.
For the set of four measurements, as storage, processors, AWM clients, and Apache servers increased, number of resident pages, number of PTRM pages, and number of DASD pages increased nearly identical to the workload and configuration factors.
For the set of four measurements, as storage, processors, AWM clients, and Apache servers increased, DASD service time increased.
With the increased DASD service time, processor utilization could not be maintained at a constant level. This prevented the transaction rate from scaling at a rate equal to the workload and configuration scaling.
Although ITR didn't scale as well as the previous workload, it was not highly affected by the increasing DASD service time and scaled as expected. Figure 6 illustrates this scaling.
Despite the fact that the paging infrastructure could not be scaled as other workload and configuration factors, this experiment demonstrates the ability of the storage management algorithms to continue scaling. System utilization remained nearly constant throughout the set of measurements and is another good sign for continued scaling.
|
Table 7. Overcommited Apache Scaling | ||||
| Run ID | A56XGLD0 | A12XGLD0 | A68XGLD0 | A1TXGDL3 |
| SYSGEN Storage (GB) | 256 | 512 | 768 | 1024 |
| Processors | 2 | 4 | 6 | 8 |
| Processors ratio | 1.000 | 2.000 | 3.000 | 4.000 |
| Clients ratio | 1.000 | 2.000 | 3.000 | 4.000 |
| Servers ratio | 1.000 | 2.000 | 3.000 | 4.000 |
| ETR | 141.551 | 270.615 | 400.684 | 437.466 |
| ITR | 144.79 | 278.86 | 426.23 | 541.11 |
| ITR ratio | 1.000 | 1.926 | 2.944 | 3.737 |
| Total Util/Proc | 98.2 | 99.9 | 95.9 | 80.9 |
| System Util/Proc | 2.5 | 2.7 | 2.6 | 2.4 |
| DASD Service Time | 0.9 | 1.1 | 2.9 | 4.9 |
| DASD Service Time ratio | 1.000 | 1.222 | 3.222 | 5.444 |
| Resident DASD | 21758673 | 44553845 | 66713500 | 86049187 |
| PTRM Reside | 689000 | 1356000 | 1921000 | 2562000 |
| PTRM DASD | 7770 | 4456 | 103000 | 125624 |
| DASD Pg Total Rate | 16687 | 35834 | 53363 | 60968 |
| PTRM Reside ratio | 1.000 | 1.968 | 2.788 | 3.718 |
| DASD Pg Total Rate ratio | 1.000 | 2.147 | 3.198 | 3.654 |
| PTRM DASD ratio | 1.000 | 0.573 | 13.256 | 16.168 |
| Page slot util | 4 | 8 | 12 | 15 |
| Resident Pages <2G | 486063 | 478642 | 481875 | 482034 |
| Resident Pages >2G | 65296000 | 130118000 | 196125000 | 262269000 |
| Notes: 2817-744. Four 8.0 Gbps Fibre-channel switched channels, 2107-E8 control unit, 48 3390-54 volumes. | ||||
| Figure 6. Overcommitted Apache Scaling Curve |
 |
Summary and Conclusions
z/VM 6.3 extends the maximum supported configuration to 1 TB of real storage and 128 GB of XSTORE and provides several storage management enhancements that let real storage scale efficiently past 256 GB in a storage-overcommitted environment.
Although XSTORE is still supported, it functions differently now and its use is not recommended. When migrating from an older level of z/VM, any XSTORE should be reconfigured as real storage.
z/VM 6.3 also increases maximum addressable virtual storage to 64 TB. The count of Page Table Resource Manager (PTRM) address spaces increased from 16 to 128 and are all initialized at IPL.
Reorder processing has been removed and replaced with algorithms that scale more efficiently past 256 GB.
Below-2-GB storage is now used for user pages in all supported real storage sizes. To help reduce serial searches, below-2-GB storage is now used last, and the below-2-GB available list is refilled by scanning the real memory frame table.
Workloads affected by the reorder process or by serial searches in previous z/VM releases generally receive benefit from the new storage management algorithms in z/VM 6.3.
Workloads not affected by the reorder process or serial searches in previous z/VM releases generally show similar results on z/VM 6.3.
Although some of the specific experiments were limited by configuration, workload scaling to 1 TB was not limited by storage management searching algorithms.
In general,
it is
recommended to keep the default aging list size.
Systems that never run storage-overcommitted should be
run with the global aging list set to minimum size and
with global aging list early writes disabled.