Dynamic Memory Downgrade
Abstract
With the PTF for APAR VM66271, z/VM 7.2 provides support for removing memory from a running system. Dynamic Memory Downgrade (DMD), also known as memory reclamation or storage reclamation, extends the real memory dynamic management characteristics of z/VM to include removing up to 50% of the real memory while the system is running.
Measurements found that running a system with 50% of its memory marked as removable caused no performance difference compared to running that same system with all its memory marked as permanent. Measurements also found the elapsed time needed to remove memory is generally proportional to the amount of memory being removed. Removal rates ranged from 2 GB/sec to 40 GB/sec according to workload. Measurements further found the additional CPU utilization incurred during memory removal varied from 0 to 12.9 processors' worth, again, according to workload.
Introduction
To support DMD, z/VM classifies memory as permanent or as reconfigurable. Permanent memory cannot be taken offline and there must be at least 4 GB of permanent memory. Reconfigurable memory can be taken offline and may be up to 50% of total memory.
Before memory can be reclaimed, the content of that memory must be copied elsewhere, either to other memory or paged out to DASD. Thus DMD operations are expected to take time and can impact the performance of a workload. To try to balance workload impact against speed of removal, memory removal work is throttled to use no more than half the capacity of the unparked processors.
To evaluate the line item, measurements were done in two general categories.
-
Regression measurements
were done to determine whether the significant changes
made to CP storage management code caused any degradation
to the system or workloads. Our expectation was that there
would be no performance regression.
-
DMD operation measurements
were done to
determine how long DMD operations took and what effect they had on
the system and workloads.
To provide information which might help
customers predict how their systems and workloads might
be affected by DMD operations,
DMD operations measurements were done in several
different scenarios.
Performance of DMD operations is expected to vary based on the amount of reconfigurable memory to reclaim, the amount of reconfigurable memory in use, the over-commitment ratio and paging bandwidth (there might be a temporary spike in paging to make more frames available), how much available memory and spare processing power exist before the reclamation, and the extent to which the workload pins (aka locks) pages.
Method: Workloads
The studies presented here were done with several workloads. All measurements were collected on a 8561-T01. The partition was always dedicated, with all IFL processors. No other partitions were ever activated. The number of processors was varied according to the needs of the particular workload being run. The amount of memory was varied from 512 GB or 1 TB up to 4 TB.
Regression Workloads
For regression measurements, IBM used workloads and configurations taken from the standard suite of regression runs used to evaluate every z/VM release or quarterly PTF stack. This suite spans a broad range of Linux-oriented and CMS-oriented workloads.
Sweet Spot Non-Paging Workload
The Sweet Spot Non-Paging workload consists of multiple instances of the Virtual Storage Exerciser (VIRSTOR) application, which uses processor cycles and randomly references memory, thereby constantly changing memory pages. The workload parameters were adjusted to produce a steady CPU utilization with no paging. The workload parameters were adjusted to produce a memory utilization of about 50% or 90%. Configurations measured ranged from 512 GB with 5 IFL cores to 4 TB with 40 IFL cores.
Sweet Spot Paging Workload
The Sweet Spot Paging workload consists of multiple instances of the Virtual Storage Exerciser (VIRSTOR) application, which uses processor cycles and randomly references memory, thereby constantly changing memory pages. The workload parameters were adjusted to produce a steady CPU utilization and steady paging rate. The workload parameters were adjusted to produce a memory overcommitment of about 28%. Configurations measured ranged from 512 GB with 5 IFL cores to 4 TB with 40 IFL cores.
Live Guest Relocation Workload
The Live Guest Relocation workload relocates 25 guests one at a time. The virtual storage sizes of the guests can be varied. Each Linux guest runs three applications in parallel: BLAST, PFAULT, and Ping. At steady state, the LPAR runs completely CPU busy with no paging.
Method: Regression Measurements
Base measurements were performed on the z/VM 7.2 (March 2021) level of code. Comparison measurements were performed on the z/VM 7.2 (July 2021) level of code with 100% permanent memory and repeated with 50% reconfigurable memory. The comparison measurements were done to determine whether the code changes caused any degradation in the 100% permanent memory measurements when compared to the base measurements, and whether running with 50% reconfigurable memory caused any degradation when compared to the 100% permanent memory measurements.
Results and Discussion: Regression Measurements
Each set of measurements comprised 94 runs. The average workload throughput in the 100% permanent memory measurements was 1.02 times the throughput of the base measurements. The average workload throughput in the 50% reconfigurable memory measurements was 1.00 times the throughput in the 100% permanent memory measurements. The results show there was no degradation caused by the significant changes made to the storage management code in z/VM.
Method: DMD Operation Measurements
To measure DMD operations, the Sweet Spot and Live Guest Relocation (LGR) workloads were used.
The Sweet Spot workload was run in a number of different configurations, all with 50% of real memory marked reconfigurable, and then choosing one from each of the following sets of choices:
- With total memory size of 512 GB, 1 TB, 2 TB, 3 TB, or 4 TB.
- Non-paging using less than 50% of memory, non-paging using 90% of memory, or paging using 125% of memory.
- Removing 25%, 50%, or 100% of reconfigurable memory.
Each of the above combinations was studied in each of four phases of the workload:
- Busy phase: with the workload active in a steady state. This was done to determine the effect of DMD operations on workload throughput and system performance.
- Idle phase: with the workload ended but the users still logged on and idle. This was done to determine how long DMD operations would take when the user memory was still occupied.
- Logoff phase: with the users logging off. This was done to determine how long the DMD operations would take and whether logoff time would be extended.
- End phase: after all the users were completely logged off. This was done to determine how long the DMD operations would take when the bulk of memory was not being used.
The Live Guest Relocation (LGR) workload was run in three scenarios:
- Relocate one 4-GB guest and 1 GB of reconfigurable memory at a time.
- Relocate one 8-GB guest and 2 GB of reconfigurable memory at a time.
- Relocate one 12-GB guest and 3 GB of reconfigurable memory at a time.
Results and Discussion - DMD Operation Measurements
Sweet Spot Workload Using Less Than 50% of Memory
The Sweet Spot scenarios which are non-paging and use less than 50% of memory remain non-paging after the DMD operations are complete.
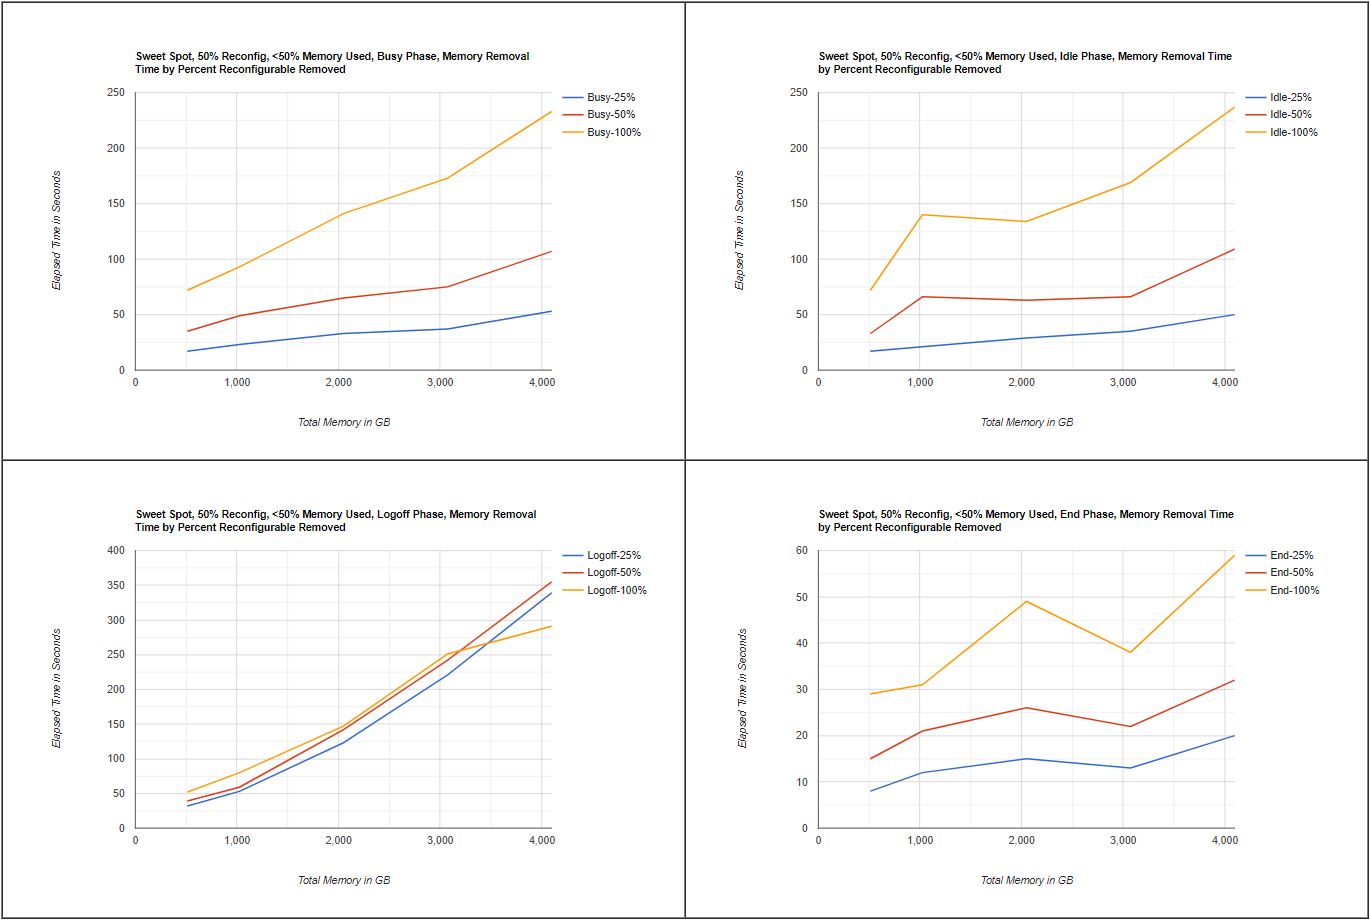
The following graphs and table show the elapsed time in seconds to complete a DMD operation to remove 25%, 50%, or 100% of reconfigurable memory, in each of the four phases.
| Figure 1. Sweet Spot, 50% Reconfig, <50% Memory Used, Memory Removal Time by Percent Reconfigurable Removed |
|
| Notes: 8561-T01, z/VM 7.2 (July 2021). To view charts full-size, click here. |
| Table 1. Sweet Spot, 50% Reconfig, <50% Memory Used, Memory Removal Time by Percent Reconfigurable Removed | |||
| SYSGEN | Busy | Busy | Busy |
| GB | -25% | -50% | -100% |
| 512 | 17 | 35 | 72 |
| 1024 | 23 | 49 | 93 |
| 2048 | 33 | 65 | 141 |
| 3072 | 37 | 75 | 173 |
| 4096 | 53 | 107 | 233 |
| SYSGEN | Idle | Idle | Idle |
| GB | -25% | -50% | -100% |
| 512 | 17 | 33 | 72 |
| 1024 | 21 | 66 | 140 |
| 2048 | 29 | 63 | 134 |
| 3072 | 35 | 66 | 169 |
| 4096 | 50 | 109 | 237 |
| SYSGEN | Logoff | Logoff | Logoff |
| GB | -25% | -50% | -100% |
| 512 | 32 | 39 | 52 |
| 1024 | 53 | 59 | 80 |
| 2048 | 123 | 142 | 147 |
| 3072 | 221 | 242 | 251 |
| 4096 | 339 | 355 | 291 |
| SYSGEN | End | End | End |
| GB | -25% | -50% | -100% |
| 512 | 8 | 15 | 29 |
| 1024 | 12 | 21 | 31 |
| 2048 | 15 | 26 | 49 |
| 3072 | 13 | 22 | 38 |
| 4096 | 20 | 32 | 59 |
| Notes: 8561-T01, z/VM 7.2 (July 2021). | |||
The following table gives observations by phase.
| Table 2. Sweet Spot, 50% Reconfig, <50% Memory Used, Observations by Phase | |||
| Busy phase |
The impact to non-paging scenarios which remained non-paging after the DMD operation was complete was expected to be minimal. The measured throughput for these measurements varied by less than 1% when compared to the base measurement. For the measurement where 1 TB of reconfigurable memory was removed from a system with a total of 2 TB of memory, total CPU utilization increased from 1351 before the DMD operation to 1874 during the DMD operation and decreased to 1313 after the DMD operation. The additional CPU cost for the DMD operation was 5.2 processors. For the measurement where 2 TB of reconfigurable memory was removed from a system with a total of 4 TB of memory, total CPU utilization increased from 2579 before the DMD operation to 3868 during the DMD operation and decreased to 2530 after the DMD operation. The additional CPU cost for the DMD operation was 12.9 processors. The rate at which reconfigurable memory was removed ranged from 3.5 GB/sec to 9.8 GB/sec and was proportional to the amount of memory being removed. |
||
| Idle phase |
The elapsed time for the DMD operations ranged from 17 seconds to 3 minutes 57 seconds. The rate at which reconfigurable memory was removed ranged from 3.6 GB/sec to 11.6 GB/sec and was proportional to the amount of memory being removed. |
||
| Logoff phase |
The elapsed time for the DMD operations ranged from 32 seconds to 4 minutes 51 seconds. The elapsed time for the users to be completely logged off was not affected for the 512 GB or 1 TB systems, increased by up to 8% for the 2 TB system, increased by up to 17.8% for the 3 TB system, and increased by up to 53.4% for the 4 TB system. The rate at which reconfigurable memory was removed ranged from 1.5 GB/sec to 7.0 GB/sec. |
||
| End phase |
The elapsed time for the DMD operations ranged from 8 seconds to 59 seconds. The rate at which reconfigurable memory was removed ranged from 8.0 GB/sec to 40.4 GB/sec and was proportional to the amount of memory being removed. |
||
Sweet Spot Workload Using Less Than 90% of Memory
The Sweet Spot scenarios which are non-paging and use less than 90% of memory become paging after the DMD operations are complete.
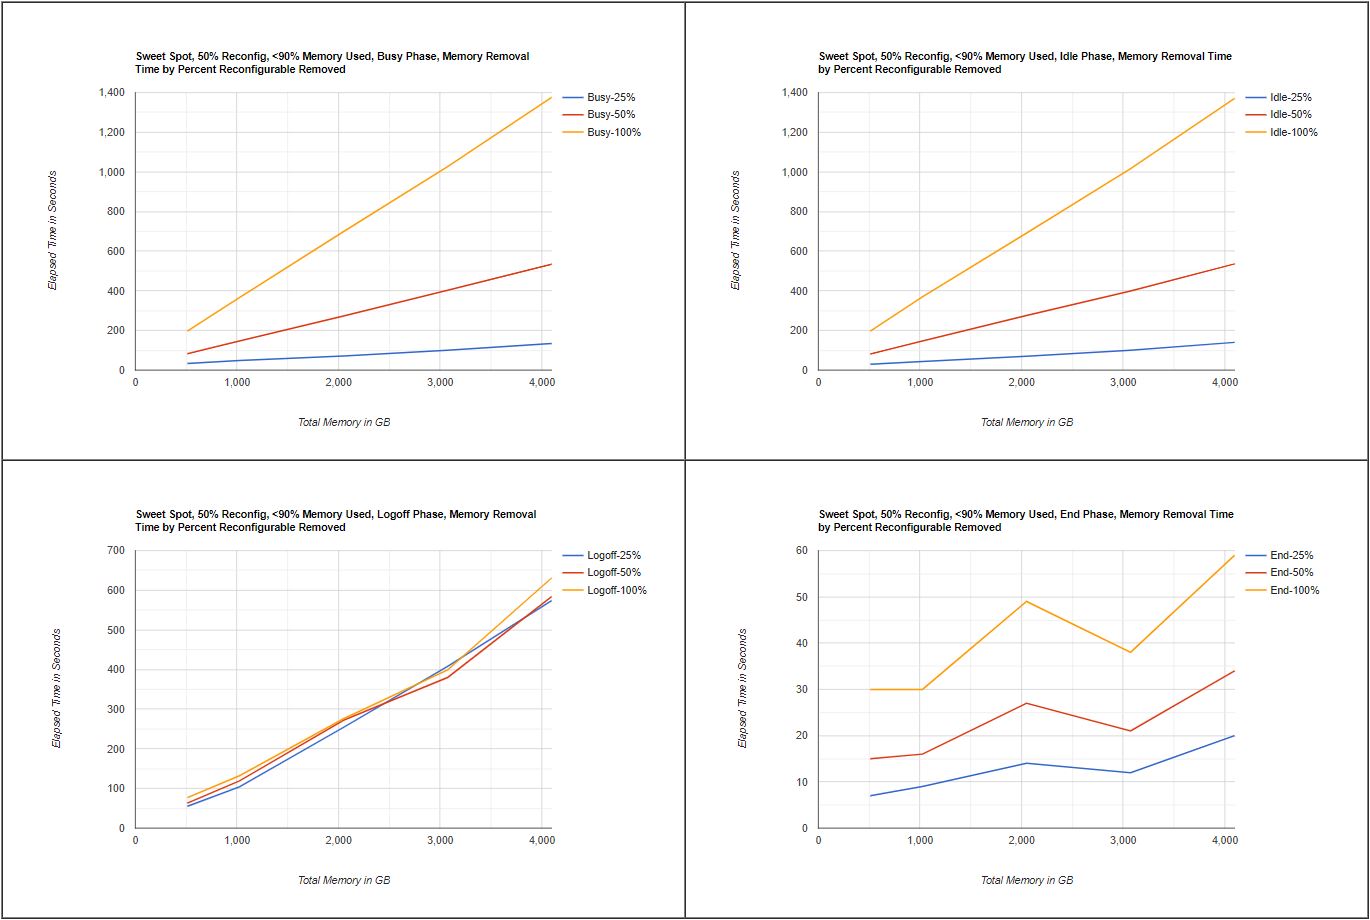
The following graphs and table show the elapsed time in seconds to complete a DMD operation to remove 25%, 50%, or 100% of reconfigurable memory in each of the four phases.
| Figure 2. Sweet Spot, 50% Reconfig, <90% Memory Used, Memory Removal Time by Percent Reconfigurable Removed |
|
| Notes: 8561-T01, z/VM 7.2 (July 2021). To view charts full-size, click here. |
| Table 3. Sweet Spot, 50% Reconfig, <90% Memory Used, Memory Removal Time by Percent Reconfigurable Removed | ||||||||||||
| SYSGEN | Busy | Busy | Busy | |||||||||
| GB | -25% | -50% | -100% | |||||||||
| 512 | 34 | 83 | 197 | |||||||||
| 1024 | 48 | 147 | 366 | |||||||||
| 2048 | 71 | 273 | 699 | |||||||||
| 3072 | 100 | 403 | 1027 | |||||||||
| 4096 | 134 | 534 | 1376 | |||||||||
| SYSGEN | Idle | Idle | Idle | |||||||||
| GB | -25% | -50% | -100% | |||||||||
| 512 | 30 | 81 | 197 | |||||||||
| 1024 | 43 | 147 | 369 | |||||||||
| 2048 | 70 | 276 | 691 | |||||||||
| 3072 | 100 | 399 | 1016 | |||||||||
| 4096 | 140 | 536 | 1371 | |||||||||
| SYSGEN | Logoff | Logoff | Logoff | |||||||||
| GB | -25% | -50% | -100% | |||||||||
| 512 | 55 | 63 | 77 | |||||||||
| 1024 | 104 | 119 | 132 | |||||||||
| 2048 | 254 | 272 | 276 | |||||||||
| 3072 | 408 | 380 | 399 | |||||||||
| 4096 | 574 | 584 | 631 | |||||||||
| SYSGEN | End | End | End | |||||||||
| GB | -25% | -50% | -100% | |||||||||
| 512 | 7 | 15 | 30 | |||||||||
| 1024 | 9 | 16 | 30 | |||||||||
| 2048 | 14 | 27 | 49 | |||||||||
| 3072 | 12 | 21 | 38 | |||||||||
| 4096 | 20 | 34 | 59 | |||||||||
| Notes: 8561-T01, z/VM 7.2 (July 2021). | ||||||||||||
The following table gives observations by phase.
| Table 4. Sweet Spot, 50% Reconfig, <90% Memory Used, Observations by Phase | |||
| Busy phase |
The impact to non-paging scenarios which became paging after the DMD operation was complete was expected to be measureable. The measured throughput for all measurements in this scenario ranged from no degradation to 17% degradation. The data for all measurements was collected for 30 minutes and the elapsed time to complete the DMD operation affected the amount of degradation as the elapsed time became a larger portion of the measurement time. For the measurement where 1 TB of reconfigurable memory was removed from a system with a total of 2 TB of memory, total CPU utilization increased from 1337 before the DMD operation to 1653 during the DMD operation, decreased further to 1088 during the DMD operation, and decreased to 1003 after the DMD operation. The additional CPU cost for the DMD operation was 3.2 processors. The paging rate during the DMD operation averaged 325k pages/sec, which is the maximum which could be achieved on the test system used, and decreased to 130k pages/sec after the operation completed. For the measurement where 2 TB of reconfigurable memory was removed from a system with a total of 4 TB of memory, total CPU utilization increased from 2605 before the DMD operation to 3673 during the DMD operation, decreased further to 2887 during the DMD operation, and decreased to 1955 after the DMD operation. The additional CPU cost for the DMD operation was 10.7 processors. The paging rate during the DMD operation averaged 323k pages/sec, which is the maximum which could be achieved on the test system used, and decreased to 130k pages/sec after the operation completed. The rate at which reconfigurable memory was removed ranged from 1.3 GB/sec to 3.8 GB/sec and was inversely proportional to the amount of memory being removed. |
||
| Idle phase |
The elapsed time for the DMD operations ranged from 30 seconds to 22 minutes 51 seconds. The rate at which reconfigurable memory was removed ranged from 1.3 GB/sec to 3.8 GB/sec and was proportional to the amount of memory being removed. |
||
| Logoff phase |
The elapsed time for the DMD operations ranged from 55 seconds to 10 minutes 31 seconds. The elapsed time for the users to be completely logged off was not affected for the 512 GB system, increased by up to 16.7% for the 1 TB system, increased by up to 39.7% for the 2 TB system, increased by up to 14.0% for the 3 TB system, and increased by up to 28.9% for the 4 TB system. The rate at which reconfigurable memory was removed ranged from 0.9 GB/sec to 3.9 GB/sec. |
||
| End phase |
The elapsed time for the DMD operations ranged from 7 seconds to 59 seconds. The rate at which reconfigurable memory was removed ranged from 8.5 GB/sec to 40.4 GB/sec and was proportional to the amount of memory being removed. |
||
Sweet Spot Workload Using 125% of Memory
The Sweet Spot scenarios which are paging and use 125% of memory remain paging after the DMD operations are complete.
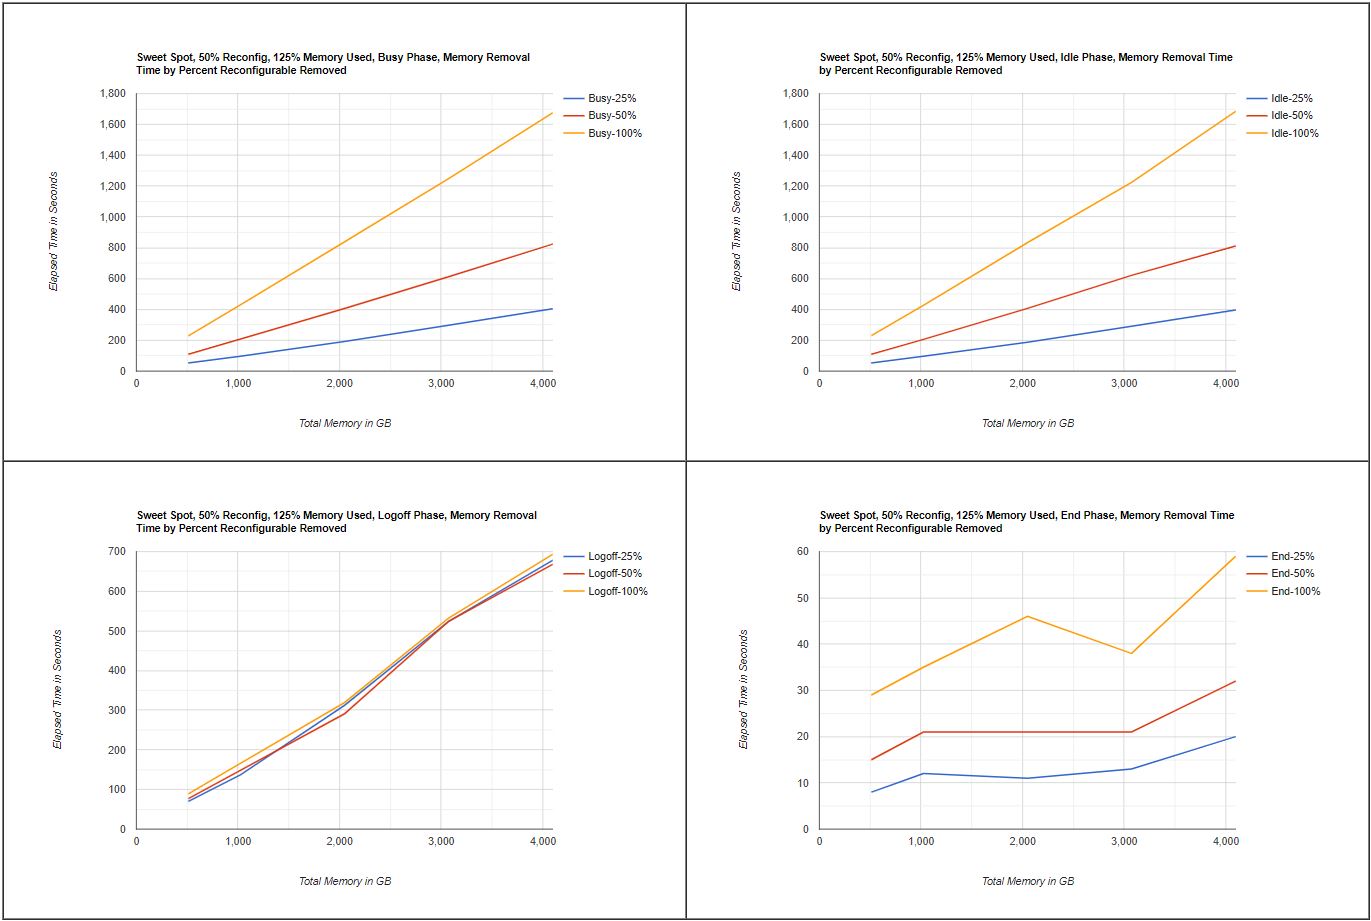
The following graphs and table show the elapsed time in seconds to complete a DMD operation to remove 25%, 50%, or 100% of reconfigurable memory in each of the four phases.
| Figure 3. Sweet Spot, 50% Reconfig, 125% Memory Used, Memory Removal Time by Percent Reconfigurable Removed |
|
| Notes: 8561-T01, z/VM 7.2 (July 2021). To view charts full-size, click here. |
| Table 5. Sweet Spot, 50% Reconfig, 125% Memory Used, Memory Removal Time by Percent Reconfigurable Removed | ||||||||||||
| SYSGEN | Busy | Busy | Busy | |||||||||
| GB | -25% | -50% | -100% | |||||||||
| 512 | 53 | 109 | 229 | |||||||||
| 1024 | 97 | 208 | 430 | |||||||||
| 2048 | 192 | 406 | 838 | |||||||||
| 3072 | 297 | 612 | 1248 | |||||||||
| 4096 | 404 | 824 | 1675 | |||||||||
| SYSGEN | Idle | Idle | Idle | |||||||||
| GB | -25% | -50% | -100% | |||||||||
| 512 | 52 | 109 | 230 | |||||||||
| 1024 | 96 | 206 | 427 | |||||||||
| 2048 | 188 | 407 | 834 | |||||||||
| 3072 | 291 | 621 | 1224 | |||||||||
| 4096 | 396 | 812 | 1685 | |||||||||
| SYSGEN | Logoff | Logoff | Logoff | |||||||||
| GB | -25% | -50% | -100% | |||||||||
| 512 | 70 | 77 | 89 | |||||||||
| 1024 | 137 | 148 | 166 | |||||||||
| 2048 | 312 | 291 | 319 | |||||||||
| 3072 | 524 | 524 | 532 | |||||||||
| 4096 | 678 | 668 | 693 | |||||||||
| SYSGEN | End | End | End | |||||||||
| GB | -25% | -50% | -100% | |||||||||
| 512 | 8 | 15 | 29 | |||||||||
| 1024 | 12 | 21 | 35 | |||||||||
| 2048 | 11 | 21 | 46 | |||||||||
| 3072 | 13 | 21 | 38 | |||||||||
| 4096 | 20 | 32 | 59 | |||||||||
| Notes: 8561-T01, z/VM 7.2 (July 2021). | ||||||||||||
The following table gives observations by phase.
| Table 6. Sweet Spot, 50% Reconfig, 125% Memory Used, Observations by Phase | |||
| Busy phase |
The impact to paging scenarios was expected to be measureable. The measured throughput for all measurements in this scenario ranged from no degradation to 39% degradation. The data for all measurements was collected for 30 minutes and the elapsed time to complete the DMD operation affected the amount of degradation. as the elapsed time became a larger portion of the measurement time. For the measurement where 1 TB of reconfigurable memory was removed from a system with a total of 2 TB of memory, total CPU utilization decreased from 1267 before the DMD operation to 1032 during the DMD operation and decreased to 772 after the DMD operation. There was no additional CPU cost for the DMD operation. There was a lot of variation in CPU utilization during the DMD operation. The paging rate before the DMD operation averaged 74k pages/sec, during the DMD operation averaged 324k pages/sec, which is the maximum which could be achieved on the test system used, and decreased to 121k pages/sec after the operation completed. For the measurement where 2 TB of reconfigurable memory was removed from a system with a total of 4 TB of memory, total CPU utilization decreased from 2359 before the DMD operation to 1907 during the DMD operation and decreased further to 227 during the DMD operation. There was no additional CPU cost for the DMD operation. There was a lot of variation in CPU utilization during the DMD operation. The paging rate before the DMD operation averaged 112k pages/sec, during the DMD operation averaged 323k pages/sec, which is the maximum which could be achieved on the test system used. The data collection ended just before the DMD operation so the paging rate after the operation was not captured. The rate at which reconfigurable memory was removed ranged from 1.1 GB/sec to 1.3 GB/sec and was inversely proportional to the amount of memory being removed. |
||
| Idle phase |
The elapsed time for the DMD operations ranged from 52 seconds to 28 minutes 5 seconds. The rate at which reconfigurable memory was removed ranged from 1.1 GB/sec to 1.4 GB/sec. |
||
| Logoff phase |
The elapsed time for the DMD operations ranged from 70 seconds to 11 minutes 33 seconds. The elapsed time for the users to be completely logged off increased by up to 3.1% for the 512 GB system, increased by up to 2.2% for the 1 TB system, increased by up to 27.7% for the 2 TB system, increased by up to 20.5% for the 3 TB system, and increased by up to 26.1% for the 4 TB system. The rate at which reconfigurable memory was removed ranged from 0.7 GB/sec to 3.2 GB/sec. |
||
| End phase |
The elapsed time for the DMD operations ranged from 8 seconds to 59 seconds. The rate at which reconfigurable memory was removed ranged from 8.0 GB/sec to 40.4 GB/sec and was proportional to the amount of memory being removed. |
||
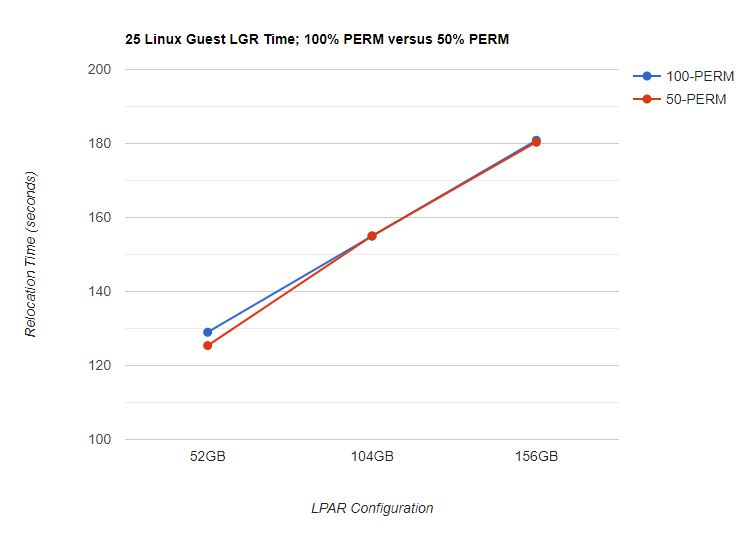
Live Guest Relocation (LGR) workload
The figure below shows removing reconfigurable memory in small increments while relocating Linux guests serially did not affect the overall relocation time when compared back to a 100% PERM configuration. The DMD operations took less than 2 seconds each.
| Figure 4. Live Guest Relocation Time to Relocate 25 Linux Guests. |
|
| Notes: 8561-T01, z/VM 7.2 (July 2021). |
Summary
The measurement results demonstrate the expected variability in DMD operation times and impact on the system and workloads. The performance of the DMD operations varied based on the amount of reconfigurable memory being reclaimed, the amount of reconfigurable memory in use, the over-commitment ratio and paging bandwidth (there was a temporary spike in paging to make more frames available), and how much available memory and spare processing power existed before the reclamation.
The largest impacts were seen when removing large amounts of reconfigurable memory from a system that was already paging, or started paging as a result of the memory removal. When memory was removed in small increments, there was a much smaller impact on the system and workloads. If a large amount of memory is to be removed, the impact on the system and workload can be greatly reduced by incrementally removing small amounts of memory and allowing a short time interval between operations.
For Live Guest Relocation it is recommended to move the guests and memory one guest's worth at a time instead of first moving all the memory and then moving all the guests.
The information provided in this report may give customers some indication of what to expect, however, each customer
system and workload is unique and actual results can
be determined only when the customer actually performs
DMD operations.