z/VM Performance Report
IBM Corporation
z/VM Performance Evaluation
Generated 2016-11-17 15:12:58 EST from this online edition:
http://www.vm.ibm.com/perf/reports/zvm/html/
This PDF version is intended for those who wish to save a complete report locally, for offline viewing later.
To send us feedback about this PDF version, visit the VM Feedback Page.
Table of Contents
Notices
Programming Information
Trademarks
Acknowledgements
Introduction
Update Log
Referenced Publications
z/VM 6.4
Summary of Key Findings
Changes That Affect Performance
Performance Improvements
Performance Considerations
Performance Management
New Functions
Memory Management Serialization Contention Relief and 2 TB Central Storage Support
z/VM Paging
CP Scheduler Improvements
RSCS TCPNJE Encryption
TLS/SSL Server Changes
z/VM for z13
Summary of Key Findings
Changes That Affect Performance
Performance Improvements
Performance Considerations
Performance Management
New Functions
Simultaneous Multithreading (SMT)
System Scaling Improvements
z/VM Version 6 Release 3
Summary of Key Findings
Changes That Affect Performance
Performance Improvements
Performance Considerations
Performance Management
New Functions
Storage Management Scaling Improvements
z/VM HiperDispatch
System Dump Improvements
CPU Pooling
z/VM Version 6 Release 2
Summary of Key Findings
Changes That Affect Performance
Performance Improvements
Performance Considerations
Performance Management
New Functions
Live Guest Relocation
Workload and Resource Distribution
ISFC Improvements
Storage Management Improvements
High Performance FICON
z/VM Version 5 Release 4
Summary of Key Findings
Changes That Affect Performance
Performance Improvements
Performance Considerations
Performance Management
New Functions
Dynamic Memory Upgrade
Specialty Engine Enhancements
DCSS Above 2 GB
z/VM TCP/IP Ethernet Mode
z/VM TCP/IP Telnet IPv6 Support
Update
z/VM Version 5 Release 3
Summary of Key Findings
Changes That Affect Performance
Performance Improvements
Performance Considerations
Performance Management
New Functions
Improved Real Storage Scalability
Memory Management: VMRM-CMM and CMMA
Improved Processor Scalability
Diagnose X'9C' Support
Specialty Engine Support
SCSI Performance Improvements
z/VM HyperPAV Support
Virtual Switch Link Aggregation
z/VM Version 5 Release 2.0
Summary of Key Findings
Changes That Affect Performance
Performance Improvements
Performance Considerations
Performance Management
Migration from z/VM 5.1.0
CP Regression Measurements
CP Disk I/O Performance
New Functions
Enhanced Large Real Storage Exploitation
Extended Diagnose X'44' Fast Path
QDIO Enhanced Buffer State Management
z/VM PAV Exploitation
Additional Evaluations
Linux Disk I/O Alternatives
Dedicated OSA vs. VSWITCH
Layer 3 and Layer 2 Comparisons
Guest Cryptographic Enhancements
z/VM Version 5 Release 1.0
Summary of Key Findings
Changes That Affect Performance
Performance Improvements
Performance Considerations
Performance Management
New Functions
24-Way Support
Emulated FBA on SCSI
Internet Protocol Version 6 Support
Virtual Switch Layer 2 Support
Additional Evaluations
z990 Guest Crypto Enhancements
z/VM Version 4 Release 4.0
Summary of Key Findings
Changes That Affect Performance
Performance Improvements
Performance Management
New Functions
Scheduler Lock Improvement
z/VM Virtual Switch
Queued I/O Assist
TCP/IP Stack Improvement Part 2
TCP/IP Device Layer MP Support
Additional Evaluations
Linux Guest Crypto on z990
z/VM Version 4 Release 3.0
Summary of Key Findings
Changes That Affect Performance
Performance Improvements
Performance Considerations
Performance Management
New Functions
Enhanced Timer Management
VM Guest LAN: QDIO Simulation
Linux Guest Crypto Support
Improved Utilization of Large Real Storage
Accounting for Virtualized Network Devices
Large Volume CMS Minidisks
TCP/IP Stack Performance Improvements
z/VM Version 4 Release 2.0
Summary of Key Findings
Changes That Affect Performance
Performance Improvements
Performance Management
New Functions
HiperSockets
64-bit Fast CCW Translation
64-bit Asynchronous Page Fault Service (PFAULT)
Guest Support for FICON CTCA
DDR LZCOMPACT Option
IMAP Server
Additional Evaluations
Linux Connectivity Performance
Linux Guest DASD Performance
z/VM Version 4 Release 1.0
Summary of Key Findings
Changes That Affect Performance
Performance Improvements
Performance Management
New Functions
Fast CCW Translation for Network I/O
z/VM Version 3 Release 1.0
Summary of Key Findings
Changes That Affect Performance
Performance Improvements
Performance Considerations
Performance Management
Migration from VM/ESA 2.4.0 and TCP/IP FL 320
CMS-Intensive
2064 2-Way LPAR, 1G/2G
2064-1C8, 2G/6G
2064-1C8, 2G/10G
VSE/ESA Guest
TCP/IP
Telnet
FTP
Migration from Other VM Releases
New Functions
CP 64-Bit Support
Real Storage Sizes above 2G
Minidisk Cache with Large Real Storage
The 2G Line
Queued Direct I/O Support
Secure Socket Layer Support
Additional Evaluations
Linux Guest IUCV Driver
Virtual Channel-to-Channel Performance
Migration from VTAM to Telnet
Comparison of CMS1 to FS8F
Workloads
AWM Workload
Apache Workload
Linux IOzone Workload
Linux OpenSSL Exerciser
z/OS Secure Sockets Layer (System SSL) Performance Workload
z/OS DB2 Utility Workload
z/OS Java Encryption Performance Workload
z/OS Integrated Cryptographic Service Facility (ICSF) Performance Workload
CMS-Intensive (FS8F)
CMS-Intensive (CMS1)
VSE Guest (DYNAPACE)
z/OS File System Performance Tool
z/OS IP Security (IPSec) Performance Workload
Virtual Storage Exerciser (VIRSTOEX or VIRSTOCX)
PING Workload
PFAULT Workload
BLAST Workload
ISFC Workloads
IO3390 Workload
z/VM HiperDispatch Workloads
Middleware Workload DayTrader (DT)
Master Processor Exerciser (VIRSTOMP)
Glossary of Performance Terms
Footnotes
Notices
The information contained in this document has not been submitted to any formal IBM test and is distributed on an as is basis without any warranty either expressed or implied. The use of this information or the implementation of any of these techniques is a customer responsibility and depends on the customer's ability to evaluate and integrate them into the customer's operational environment. While each item may have been reviewed by IBM for accuracy in a specific situation, there is no guarantee that the same or similar results will be obtained elsewhere. Customers attempting to adapt these techniques to their own environments do so at their own risk.
Performance data contained in this document were determined in various controlled laboratory environments and are for reference purposes only. Customers should not adapt these performance numbers to their own environments as system performance standards. The results that may be obtained in other operating environments may vary significantly. Users of this document should verify the applicable data for their specific environment.
This publication refers to some specific APAR numbers that have an effect on performance. The APAR numbers included in this report may have prerequisites, corequisites, or fixes in error (PEs). The information included in this report is not a replacement for normal service research.
References in this publication to IBM products, programs, or services do not imply that IBM intends to make these available in all countries in which IBM operates. Any reference to an IBM licensed program in this publication is not intended to state or imply that only IBM's program may be used. Any functionally equivalent product, program, or service that does not infringe any of the intellectual property rights of IBM may be used instead of the IBM product, program, or service. The evaluation and verification of operation in conjunction with other products, except those expressly designated by IBM, are the responsibility of the user.
IBM may have patents or pending patent applications covering subject matter in this document. The furnishing of this document does not give you license to these patents. You can send inquiries, in writing, to the IBM Director of Licensing, IBM Corporation, North Castle Drive, Armonk, NY, 10594-1785 USA.
Back to Table of Contents.
Programming Information
This publication is intended to help the customer understand the performance of z/VM on various IBM processors. The information in this publication is not intended as the specification of any programming interfaces that are provided by z/VM. See the IBM Programming Announcement for the z/VM releases for more information about what publications are considered to be product documentation.
Back to Table of Contents.
Trademarks
The following terms are trademarks of the IBM Corporation in the United States or other countries or both:
- AIX
- ACF/VTAM
- CICS
- DS6000
- DS8000
- ECKD
- ES/9000
- ESCON
- FICON
- GDPS
- HiperSockets
- HyperSwap
- IBM
- MVS
- OMEGAMON
- OS/2
- PR/SM
- Performance Toolkit for VM
- Processor Resource/Systems Manager
- PR/SM
- RACF
- RAMAC
- RS/6000
- System/390
- S/390
- System z
- System z9
- System z10
- Tivoli
- Virtual Machine/Enterprise Systems Architecture
- VM/ESA
- VM/XA
- VSE/ESA
- VTAM
- z Systems
- z13
- zSeries
- z/Architecture
- z/VM
- 3090
Linux is a trademark of Linus Torvalds in the United States, other countries, or both.
Windows NT is a trademark of Microsoft Corporation in the United States and other countries.
Pentium is a trademark of Intel Corporation in the United States and other countries.
Cisco is a trademark of Cisco Systems Inc., in the United States and other countries.
SUSE is a trademark of Novell, Inc., in the United States and other countries.
Other company, product, and service names might be trademarks or service marks of others.
Back to Table of Contents.
Acknowledgements
The following people contributed to this report:
Cherie Barnes
Bill Bitner
Victor Boyarintsev
Bill Cosnett
Dean DiTommaso
Tom Doster
Wes Ernsberger
Bill Guzior
Steve Jones
Virg Meredith
Bob Neill
Bernd Nitsch
Dorin Pascar
Bailey (Bei) Peng
Patty Rando
Walter Roth
Ann Shepherd
Dave Spencer
Marek Szermutzky
Joe Tingley
Xenia Tkatschow
Brian Wade
Editor's Note for the z/VM 5.4 Edition
In June 2008 our long-time z/VM Performance Report editor, Wes Ernsberger, retired after more than 39 years of faithful service to IBM, many of which he gave to z/VM and its predecessors. Starting with z/VM 5.4, the responsibility of coordinating, editing, and publishing the report falls to me.
In 1785 Benjamin Franklin retired from his six-year post as American Minister to France. Appointed to fill the position was none other than Thomas Jefferson. When Jefferson arrived in France, the French Foreign Minister, Charles Gravier, comte de Vergennes, asked him: "Is it you who replace Dr. Franklin?" Jefferson, himself a genius statesman, replied, "Sir, I am only his successor. No one can replace Dr. Franklin."
And so it is with you, Wes. Best wishes in your retirement.
Brian Wade
September 19, 2008
Editor's Note for the z/VM 6.4 Edition
During the development of z/VM 6.4 our longtime mentor, colleague, and friend Virg Meredith retired after 52 years of faithful service to the performance of IBM's mainframes. Virg spent many of those years helping both the z/VM product and literally generations of z/VMers to become the best they could be. Virg, we miss you and wish you the very best in your retirement.
Brian Wade
November 11, 2016
Other Notes
In memoriam, Joe Tingley, May 10, 2012.
Back to Table of Contents.
Introduction
The z/VM Performance Report summarizes the z/VM performance evaluation results. For each z/VM release, discussion covers the performance changes in that release, the performance effects of migrating from the prior release, measurement results for performance-related new functions, and additional evaluations that occurred during the time frame of that release.
Back to Table of Contents.
Update Log
This document is refreshed as additional z/VM performance information becomes available. These updates are listed below:
Date |
Action |
11 Nov 2016 | z/VM 6.4 |
27 Mar 2015 | z/VM for z13 |
12 Jun 2014 | Added section "CPU Pooling" |
09 Aug 2013 | z/VM 6.3 |
11 May 2012 | Added section "High Performance FICON" |
02 Dec 2011 | z/VM 6.2 |
16 Dec 2008 | Added section "CMS-Based SSL Server" |
19 Sep 2008 | z/VM 5.4 |
19 Feb 2008 | Added section "Memory Management: VMRM-CMM and CMMA" |
08 Nov 2007 | Added section "Virtual Switch Link Aggregation" |
01 Nov 2007 | Added section "Diagnose X'9C' Support" |
29 Jun 2007 | z/VM 5.3 |
07 Aug 2006 | Added section "z/VM PAV Exploitation" |
01 Feb 2006 | Added section "QDIO Enhanced Buffer State Management" |
12 Jan 2006 | Added section "Layer 3 and Layer 2 Comparisons" |
16 Dec 2005 | z/VM 5.2 |
05 Jan 2005 | Added section "Virtual Switch Layer 2 Support" |
24 Sep 2004 | z/VM 5.1 |
23 Feb 2004 | "Queued I/O Assist" and "TCP/IP Device Layer MP Support" sections added |
15 Aug 2003 | z/VM 4.4 |
18 Jun 2002 | "Enhanced Timer Management" and "VM Guest LAN: QDIO Simulation" sections added |
31 May 2002 | z/VM 4.3 |
03 May 2002 | Added section "Guest Support for FICON CTCA" |
27 Mar 2002 | z/VM 4.2 |
22 Jun 2001 | z/VM 4.1 |
16 Mar 2001 | Added section "Linux Guest IUCV Driver" |
22 Feb 2001 | z/VM 3.1 (base document) |
Back to Table of Contents.
Referenced Publications
The following publications and documents are referred to in this report.
- z/VM: Saved Segments Planning and Administration
- z/VM: Getting Started with Linux on System z
- z/VM: Performance
- z/VM: CP Planning and Adminstration
- z/VM: CP Commands and Utilities Reference
- z/VM: Running Guest Operating Systems
- z/VM: CMS Commands and Utilities Reference
- z/VM: Connectivity
- VM Performance Reporting Facility
- z/VM Performance Toolkit
These can be found on our publications page.
The following publications are performance reports for earlier VM releases:
- VM/ESA Version 2 Release 4.0 Performance Report
- VM/ESA Version 2 Release 3.0 Performance Report
- VM/ESA Version 2 Release 2.0 Performance Report
- VM/ESA Version 2 Release 1.0 Performance Report
- VM/ESA Release 2.2 Performance Report
- VM/ESA Release 2.1 Performance Report
- VM/ESA Release 2 Performance Report
- VM/ESA Release 1.1 Performance Report
- VM/ESA Release 1.0 Performance Report
These are available as PDF files at our performance reports page. Much additional VM performance information is available on our performance page.
Back to Table of Contents.
z/VM 6.4
z/VM 6.4 brings increased memory scalability, increased paging scalability, and improvements to the CP scheduler. It also brings encryption of RSCS TCPNJE connections and changes to the SSL default cipher strength.
The following sections discuss the performance characteristics of z/VM 6.4 and the results of the performance evaluation.
Back to Table of Contents.
Summary of Key Findings
This section summarizes key z/VM 6.4 performance items and contains links that take the reader to more detailed information about each one.
Further, the Performance Improvements article gives information about other performance enhancements in z/VM 6.4.
For descriptions of other performance-related changes, see the z/VM 6.4 Performance Considerations and Performance Management sections.
To compare the performance of z/VM 6.4 to the performance of previous releases, IBM ran a variety of workloads on the two systems. For the base case, IBM used z/VM 6.3 plus all Control Program (CP) PTFs available as of March 31, 2016. For the comparison case, IBM used z/VM 6.4 at the "code freeze" level of August 15, 2016. The runs were done on a mix of zEC12 and z13.
Regression measurements comparing these two z/VM levels showed improvement on z/VM 6.4 compared to z/VM 6.3. ETRR had mean 1.10 and standard deviation 0.25. ITRR had mean 1.15 and standard deviation 0.37.
Runs showing large improvements tended to be either memory-constrained workloads that got the benefit of the memory management and paging work or networking runs that got the benefit of repairs to the handling of jumbo frames. Most of the rest of the runs showed ratios in the neighborhood of 1.
Key Performance Improvements
z/VM 6.4 contains the following enhancements that offer performance improvements compared to previous z/VM releases:
Memory Constraint Relief and 2 TB Exploitation: z/VM can now use a central storage size of 2 TB (2048 GB). This is due in part to serialization constraint relief that was done in the memory management subsystem. For more information, read the chapter.
HyperPAV and zHPF Paging: z/VM can now use HyperPAV aliases for paging. It also can now use High Performance FICON, aka zHPF, channel programs for paging. For more information, read the chapter.
Other Functional Enhancements
These additional functional enhancements since z/VM for z13 are also notable:
CP Scheduler Improvements: In 2014 a customer reported z/VM's scheduler did not observe or enforce share setting correctly in certain situations. z/VM 6.4 made repairs to the scheduler. For more information, read the chapter.
Encryption of RSCS TCPNJE Connections: In z/VM 6.3 with the PTF for APAR VM65788 IBM shipped service for RSCS that will let it encrypt the traffic that flows across a TCPNJE link. To accomplish this RSCS exploits z/VM TCP/IP's Secure Sockets Layer or SSL. Though there is some performance impact compared to running the TCPNJE link unencrypted, some customers might wish to make the tradeoff. For more information, read the chapter.
TCP/IP Encryption Uplift: In z/VM 6.4 certain TCP/IP encryption defaults are strengthened and a new version of System SSL is present. Using two Telnet workloads IBM evaluated all of these changes. For more information, read the chapter.
Back to Table of Contents.
Changes That Affect Performance
This chapter contains descriptions of various changes in z/VM 6.4 that affect performance. It is divided into three sections -- Performance Improvements, Performance Considerations, and Performance Management.
Back to Table of Contents.
Performance Improvements
Large Enhancements
In Summary of Key Findings this report gives capsule summaries of the performance notables in z/VM 6.4.
Small Enhancements
z/VM 6.4 contains several small functional enhancements related to performance.
VM65733: Support for the new z Systems Vector Facility (SIMD).
VM65716: Support for the z13 Driver D27, including LPAR Group Absolute Capacity Capping. Also included were exploitation of Single Increment Assign Control to make dynamic memory upgrade more efficient and decreasing CP's real crypto adapter polling interval to benefit APVIRT users.
VM65680: Support for prorated core time. This in turn lets ILMT work correctly.
VM65583: Support for multi-VSWITCH link aggregation.
Service Since z/VM for z13
z/VM 6.4 also contains a number of performance repairs that were first shipped as service to earlier releases. Because IBM refreshes this report only occasionally, IBM has not yet had a chance to describe these PTFs.
VM64587: VDISK pages were not being stolen aggressively enough.
VM64770: The read-in of guest PGMBKs at guest logoff was inefficient.
VM64890: A bad loop counter caused excessive CPU consumption in Minidisk Cache (MDC).
VM64941: In some situations the guest change-bit could end up being wrongly set for an IBR page. This could in turn cause excess processing in the guest.
VM65097: PGMBK prefetch can slow the system when Diag x'10' requests are single-page.
VM65101: Invalid-but-resident (IBR) pages on the global aging list were being rewritten to DASD even though they had never been changed since having been read from DASD.
VM65189: An error in memory management was causing excessive and useless PGMBK reclaim work to be stacked on SYSTEMMP.
VM65199: Errors in the dispatcher were causing failures in how SYSTEMMP work was being handled. One failure was that once the master CPU started processing SYSTEMMP work, it would not process anything else until the SYSTEMMP queue was empty. Another failure was that some CPUs eligible to handle SYSTEMMP work were not being awakened when SYSTEMMP work needed to be done.
VM65420: Frames that should have been stolen from MDC were not being stolen.
VM65692: A defect in HCPARD was causing a certain interception control bit to remain on when it should not. This was causing excessive simulation overhead in CP.
VM65709: MDC processing was being done even though the MDIMDCP flag, which is supposed to inhibit MDC, was set. This useless processing caused waste of CPU time.
VM65748: Certain zHPF (High Performance FICON) features were unavailable to guests even though the hardware supported them.
VM65762: Under some circumstances CP might fail to deliver PCI thin interrupts to guests.
VM65794: MDC might fail to work for RDEVs whose device number is greater than or equal to x'8000'.
VM65801: Even though its OSA uplink port had reached its capacity, VSWITCH continued to redrive the uplink port, causing excessive CPU consumption.
VM65820: Because of a PE in VM65189, PGMBK reclaim could exit without releasing an important lock. This stopped all future PGMBK reclaim, which in turn made PGMBKs into a memory leak, which in turn consumed memory unnecessarily.
VM65824: The administrator had set Minidisk Cache (MDC) off for a given real volume, but if a user then logged on and said user had a DEVNO minidisk defined on that real volume, the system would turn on MDC for that volume.
VM65837: If a DASD recovery I/O gets queued at an inopportune moment, I/O to the DASD device can stall.
VM65845: If a hyperswap occurs at an inopportune moment, I/O to the swapped device can stall.
VM65869: Remove excessive LOGOFF delay for QDIO-exploitive guests.
VM65886: CCW fast-trans wrongly marked some minidisk I/Os as ineligible to be performed on HyperPAV aliases.
Miscellaneous Repairs
IBM continually improves z/VM in response to customer-reported or IBM-reported defects or suggestions. In z/VM 6.4 the following small improvements or repairs are notable:
Excessive SCSI retries: When IPLing the LPAR from a SCSI LUN, if one or more of the paths to the LUN were offline, the IPL would take a long time. It was found there were excessive retries of Exchange Config Data. The retry limit was decreased.
Lock hierarchy violation: A violation of a lock acquisition hierarchy slowed down processing in VSWITCH. The violation was repaired.
Memory leak in QUERY PROCESSORS: The handler for the CP QUERY PROCESSORS command contained a memory leak. If the leak were hit enough times the system could slow down. The leak was repaired.
Unnecessary VSWITCH real device redrives: Under some circumstances HCPIQRRD unnecessarily redrove an uplink or bridge port real device. The unnecessary redrives were removed.
Unnecessary emergency replenishment scans: Memory management would do unnecessary emergency replenishment scans in some situations. The scans could hang the system. The reason for the unnecessary scans was found and repaired.
Incorrect SMT dispatcher adjustments: In z/VM 6.3 the dispatcher behaved slightly differently for SMT than for non-SMT. This difference was in play for SMT-1 when it should not have been. The result of the error was that SMT-1 performance was worse than non-SMT performance. z/VM 6.4 repairs the system so that the difference is in play for only SMT-2. This change makes SMT-1 perform the same as non-SMT.
Unnecessary calls to MDC steal: Memory management was found to be making calls to steal MDC frames even when it was known MDC was using no frames. The unnecessary calls were removed.
Back to Table of Contents.
Performance Considerations
As customers begin to deploy z/VM 6.4, they might wish to give consideration to the following items.
Regression Behavior
Our regression findings included results from both memory-rich and memory-constrained workloads. The memory-constrained workloads tended to get improvements in ETR and ITR, especially if they were large N-core configurations. This was because of the compounding of the effects of the paging improvements and the memory scalability improvements. If your workloads are memory-constrained and large N-core, IBM would appreciate hearing your experience; please send us a feedback.
Dynamic SMT
z/VM 6.4 lets the system administrator switch the system between SMT-1 mode and SMT-2 mode without an IPL. In this way the administrator can try SMT-2, measure its behavior, and then return to SMT-1 mode if SMT-2 mode is found unsuitable.
Customers must remain mindful that SMT-1 mode is not the same as non-SMT mode. IBM did measure the performance of z/VM 6.4 in SMT-1 mode compared to non-SMT mode, core counts being equal. Differences were slight if visible at all. However, the total computing capacity achievable in non-SMT mode still exceeds, and will forever exceed, what can be achieved in SMT-1 mode or SMT-2 mode. In non-SMT mode z/VM can make use of 64 cores in the LPAR whereas in SMT-1 mode or SMT-2 mode z/VM can make use of only 32 cores. Customers running z/VM in non-SMT mode in LPARs having more than 32 cores will have to give up some cores to get to SMT-1 or to SMT-2. Switching z/VM between non-SMT mode and one of the SMT modes still requires an IPL.
In using Dynamic SMT to audition SMT-2, please remember to collect reliable measurement data and to use your data to drive your decision about how to proceed. While you are in SMT-1 mode, collect both application-specific performance data, such as transaction rates, and MONWRITE data. Be sure to collect CPU MF data as part of your MONWRITE collection. Then switch to SMT-2 and collect the very same data. Then compare the two sets of results. Try to compare results collected during times when workload was about the same. For example, for your situation it might make sense to compare Tuesday at 2 PM this week to Tuesday at 2 PM last week.
IBM is interested to hear the experiences of customers who use Dynamic SMT to audition SMT-2. Please take time to send us a feedback. We will be grateful if you will let us have copies of your measurement data and of your comparison analysis.
HyperPAV and zHPF Paging
In our article we discuss the z/VM 6.4 changes that let CP use HyperPAV aliases for paging I/O. We also discuss the changes that let CP use High Performance FICON (zHPF) for paging I/O.
Achieving paging I/O concurrency is one reason customers have been asking for paging I/O to exploit HyperPAV aliases. Customers who have defined large numbers of paging volumes only for the purpose of achieving I/O concurrency can now use HyperPAV aliases to achieve the concurrency. Doing this will let them return the excess paging DASD to other uses. In doing this remember not to decrease the total amount of paging space below a safe level for your workload.
Performance Toolkit for VM has not yet been enhanced to depict what the monitor records report about CP's use of HyperPAV aliases. In the meantime there is a VM Download Library package called HPALIAS you can use.
Memory Scalability
The work done in the memory scalability improvement let IBM increase the central storage support limit from 1 TB to 2 TB. The increase will help customer who are feeling memory constraints. The heart of the work was to split the memory manager state data from one monolithic structure into a structure that could be used concurrently by multiple logical CPUs without undue spin lock contention.
Customers wanting to increase memory need to remember that very often a system can grow effectively only when all resource types are increased in proportion to one another. CPUs, memory, channels, networking, paging DASD space, and paging DASD exposures are some examples of resources that need to be considered together when planning system growth.
CP Scheduler Improvements
In our article we discuss the improvements made in the CP scheduler in z/VM 6.4. The purpose of the improvements was to address VM65288, in which a customer demonstrated CP did not honor share settings in certain situations. In the tests we tried, CP now honors share settings more accurately than it did in previous z/VM releases.
Some customers might have finely tuned their systems by adjusting share settings until the system behaved just the way they wanted. Customers who have done so might find they need to retune now that the scheduler has been repaired.
On systems that are not completely busy, in a very large, macro sense, share settings in theory do not matter. As a consequence, unused capacity in the LPAR is often taken as a sign that all users are getting all of the CPU time they want. During our study of z/VM 6.4, though, we found that when there are only a few users and their demands add up to a good fraction of the LPAR's capacity, there can still be unfulfilled demand even though the LPAR is not completely busy. The Perfkit reports FCX114 USTAT, FCX114 INTERIM USTAT, FCX164 USTATLOG, and FCX315 USTMPLOG can help you to find users who want more CPU power than they are being given. FCX135 USTLOG is less useful because it does not cite users individually.
In the scenarios we tried, z/VM 6.4 often dispatched users with less delay than did the previous release. In other words, the amount of time between the instant a virtual CPU became ready for dispatch and the instant CP dispatched the virtual CPU tended to be less on z/VM 6.4 than it was on the previous release. This bodes well for workloads where response time is important or for situations where a physical phenomenon, such as a network device interrupt, must be serviced quickly to avoid a problem such as a timeout or a data overrun.
During our study we also evaluated the LIMITSOFT and RELATIVE LIMITHARD features of the CP scheduler. We found those two features not to work correctly in the scenarios we tried. Customers depending upon LIMITSOFT or RELATIVE LIMITHARD might wish to evaluate whether their use of those features is having the intended effect.
Back to Table of Contents.
Performance Management
These changes in z/VM 6.4 affect the performance management of z/VM:
- Monitor Changes
- Command or Output Changes
- Effects on Accounting Data
- Performance Toolkit for VM Changes
- Omegamon XE Changes
Monitor Changes
Several z/VM 6.4 enhancements affect CP monitor data. The changes are described below. The detailed monitor record layouts are found on the control blocks page.
z/VM 6.4 enhancements enable hypervisor intialization and termination, the Stand-Alone Program Loader (SAPL), DASD Dump Restore (DDR), Stand-Alone Dump, and other stand-alone utilities to run entirely in z/Architecture mode.
The following monitor records have been updated for this support:
| Monitor Record | Record Name |
|---|---|
| Domain 0 Record 1 | System Data (Per Processor) |
| Domain 0 Record 15 | Logical Partition Configuration |
| Domain 4 Record 2 | User Logoff Data |
| Domain 4 Record 3 | User Activity Data |
| Domain 4 Record 9 | User Activity Data at Transaction End |
z/VM is enhanced to provide support for the Enhanced-DAT Facility, which allows a guest to exploit 1 MB pages in addition to the supported 4 KB pages.
The following monitor record is updated for this support:
| Monitor Record | Record Name |
|---|---|
| Domain 5 Record 11 | Instruction Counts (per processor) |
Support for Simultaneous Multithreading (SMT) is enhanced with the addition of the SET MULTITHREAD command. Once z/VM 6.4 has been IPLed with multithreading enabled in the system configuration file, this command can be used to switch non-disruptively between one and two activated threads per IFL core.
The following new monitor record has been created for this support:
| Monitor Record | Record Name |
|---|---|
| Domain 5 Record 21 | SMT Configuration Change Event |
The following monitor records have been updated for this support:
| Monitor Record | Record Name |
|---|---|
| Domain 0 Record 2 | Processor Data (Per Processor) |
| Domain 1 Record 4 | System Configuration Data |
| Domain 5 Record 1 | Vary on processor |
| Domain 5 Record 2 | Vary off processor |
| Domain 5 Record 20 | MT CPUMF Counters |
IBM z13 and z13s are the last z Systems servers to support expanded storage (XSTORE). z/VM 6.4 does not support XSTORE for either host or guest usage.
The following monitor records are no longer generated:
| Monitor Record | Record Name |
|---|---|
| Domain 0 Record 5 | Expanded Storage Data (per processor) |
| Domain 1 Record 17 | Expanded Storage Data |
| Domain 3 Record 9 | Expanded Storage Data |
| Domain 3 Record 10 | Expanded Storage Data (per user) |
The following monitor records have been updated for the removal of this support:
| Monitor Record | Record Name |
|---|---|
| Domain 0 Record 14 | Minidisk Cache Data (Global) |
| Domain 1 Record 16 | Scheduler Settings |
| Domain 2 Record 4 | Add User to Dispatch List |
| Domain 2 Record 5 | Drop User from Dispatch List |
| Domain 2 Record 6 | Add User to Eligible List |
| Domain 2 Record 7 | SET SRM Changes |
| Domain 3 Record 3 | Shared Storage Management (per NSS or DCSS) |
| Domain 3 Record 14 | Address Space Information Record |
| Domain 3 Record 16 | NSS/DCSS/SSP Removed From Storage |
| Domain 4 Record 2 | User Logoff Data |
| Domain 4 Record 3 | User Activity Data |
| Domain 4 Record 9 | User Activity Data at Transaction End |
A z/VM storage administrator can now use FlashSystem storage as a z/VM-system-attached DASD, directly attached to the host without the need for an intermediate SAN Volume Controller (SVC). Previously, though FlashSystem could be used by a Linux virtual machine without an SVC, to use it for z/VM system volumes or EDEVs for virtual machines, an external or internal SVC was required. This enhancement removes that requirement.
The following monitor records have been updated for this support:
| Monitor Record | Record Name |
|---|---|
| Domain 1 Record 6 | Device Configuration Data |
| Domain 6 Record 1 | Vary on Device |
| Domain 6 Record 3 | Device Activity |
The IBM z Unified Resource Manager (zManager) is no longer supported by z/VM. The virtual switch types of IEDN and INMN have been removed from CP and TCP/IP commands and other externals.
The following monitor records have been updated for this support:
| Monitor Record | Record Name |
|---|---|
| Domain 1 Record 4 | System Configuration Data |
| Domain 1 Record 19 | QDIO Device Configuration |
| Domain 6 Record 23 | Virtual Switch Recovery |
| Domain 6 Record 25 | QDIO Device Activation Event |
| Domain 6 Record 27 | QDIO Device Deactivation Event |
| Domain 8 Record 1 | Virtual NIC Session Activity |
| Domain 8 Record 2 | Virtual NIC Guest Link State - Link Up |
| Domain 8 Record 3 | Virtual NIC Guest Link State - Link Down |
Improvements to memory management algorithms provide a basis for future enhancements that can increase the performance of workloads that experience available list spin lock contention.
The following monitor records have been updated for this support:
| Monitor Record | Record Name |
|---|---|
| Domain 0 Record 4 | Real Storage Data (Per Processor) |
| Domain 0 Record 23 | Formal Spin Lock Data |
| Domain 3 Record 1 | Real Storage Management (Global) |
Virtual machines that do not consume all of their entitled CPU power, as determined by their share setting, generate surplus CPU power. This enhancement distributes the surplus to other virtual machines in proportion to their share setting. This is managed independently for each processor type (General Purpose, IFL, zIIP, and so on) across virtual machines.
The following monitor records have been updated for this support:
| Monitor Record | Record Name |
|---|---|
| Domain 2 Record 4 | Add User to Dispatch List |
| Domain 2 Record 5 | Drop User from Dispatch List |
| Domain 2 Record 6 | Add User to Eligible List |
| Domain 2 Record 13 | Add VMDBK to the Limit List |
| Domain 2 Record 14 | Drop VMDBK from the Limit List |
z/VM paging now exploits the ability for an IBM DS8000 device to execute multiple I/O requests to an ECKD volume in parallel from a single z/VM image. In HyperPAV mode, I/O resources can be assigned on demand as needed. If the base volume is busy, z/VM selects a free alias device from a pool, binds the alias device to the base device, and starts the I/O. When the I/O completes, the alias device is returned to the pool to be used for another I/O to the same logical subsystem (LSS).
The following monitor records have been updated for this support:
| Monitor Record | Record Name |
|---|---|
| Domain 1 Record 7 | Memory Configuration Data |
| Domain 1 Record 20 | HyperPAV Pool Definition |
| Domain 3 Record 1 | Real Storage Management (Global) |
| Domain 3 Record 4 | Auxiliary Storage Management |
| Domain 3 Record 8 | Block Paging Data |
| Domain 3 Record 11 | Auxiliary Shared Storage Management |
| Domain 6 Record 3 | Device Activity |
| Domain 6 Record 28 | HyperPAV Pool Activity |
| Domain 6 Record 32 | Indicates an HPF Feature Change |
To provide additional debug information for system and performance problems, z/VM 6.4 added or changed these monitor records:
| Monitor Record | Record Name |
|---|---|
| Domain 0 Record 15 | Logical Partition Configuration |
| Domain 0 Record 21 | System Execution Space (Global) |
| Domain 1 Record 31 | CP Service Configuration |
| Domain 5 Record 18 | Dispatch Vector High Frequency Data |
| Domain 6 Record 4 | Cache Activity Data |
| Domain 6 Record 10 | Automated Tape Library Statistics |
| Domain 6 Record 22 | Virtual Switch Failover |
| Domain 6 Record 30 | LSS PAV Transition |
| Domain 6 Record 34 | Virtual Switch Bridge Port Deactivation |
| Domain 6 Record 40 | Guest Disables a PCI Function |
| Domain 6 Record 42 | PCI Function Added to the System |
| Domain 6 Record 45 | Real PCI Function varied on |
Command or Output Changes
This section cites new or changed commands or command outputs that are relevant to the task of performance management. It is not an inventory of every new or changed command.
The section does not give syntax diagrams, sample command outputs, or the like. Current copies of z/VM publications can be found in the online library.
Related to VSWITCH
- SET VSWITCH adds COUNTERS CLEAR to clear debug counters.
Related to HyperPAV Paging
- SET PAGING and QUERY PAGING work with the new paging driver.
- SET CU and QUERY CU work with alias shares.
- SET AGELIST and QUERY AGELIST work with the new paging driver.
- SET IPLPARMS controls the new PAGING63 IPL parameter.
Related to Installed Service
- QUERY CPSERVICE displays the service table.
Related to EDEV and DASD Management
- QUERY EDEVICE returns inquiry pages and vital product data pages.
- QUERY DASD returns device configuration and characteristics information.
- IOEXPLOR returns device information.
Related to EDEV RAS
- SET MITIME no longer applies to EDEVs.
- SET CPTRACE adds trace codes for the SCSI container.
- SET EDEVICE adds a usage note on best practices for configuration.
Related to Support of SCSI Flash Systems
- SET EDEVICE adds the keyword FLASH.
- QUERY EDEVICE adds the output FLASH.
Related to System Shutdown
- QUERY SHUTDOWN adds command output.
- QUERY SHUTDOWNTIME is a new command.
Related to Dynamic SMT
- SET MULTITHREAD is a new command.
- QUERY MULTITHREAD has new output.
- INDICATE MULTITHREAD has documentation changes.
- VARY CORE has documentation changes.
- SET CPTRACE has documentation changes.
Related to RSCS TCPNJE Encryption
- RSCS DEFINE can now specify TLSLABEL=.
- RSCS START can now specify TLSLABEL=.
Related to Perfkit Using Memory > 2 GB
- FCONTROL HMA is new.
- FCONTROL STORUSED is new.
- FCONTROL LIMIT has new threshold variables.
Related to the Removal of XSTORE
All of the following commands were hit by the removal of XSTORE:
- ATTACH XSTORE
- DETACH XSTORE
- FOR
- INDICATE LOAD
- INDICATE NSS
- INDICATE PAGING
- INDICATE SPACES
- INDICATE USER
- LOGOFF
- LOGON
- MONITOR SAMPLE
- QUERY AGELIST
- QUERY MDCACHE
- QUERY RESERVED
- QUERY SRM
- QUERY VIRTUAL ALL
- QUERY VIRTUAL XSTORE
- QUERY XSTORE
- RETAIN XSTORE
- SET AGELIST
- SET CPTRACE
- SET MDCACHE
- SET RESERVED
- SET SRM
- VMRELOCATE
Effects on Accounting Data
z/VM 6.4 did not change accounting.
Performance Toolkit for VM Changes
Performance Toolkit for VM has been enhanced since z/VM for z13. Find below descriptions of the enhancements.
VM65656: Pipelines Input Stage
With VM65656 Performance Toolkit for VM now includes a CMS Pipelines stage called PERFKIT. This stage constitutes a Pipelines input interface through which Perfkit can read blocks of MONWRITE files.
VM65528: Multi-VSWITCH Link Aggregation
With VM65528 Performance Toolkit for VM includes support for Multi-VSWITCH Link Aggregation.
The following reports are new:
Performance Toolkit for VM: New Reports
| Name | Number | Title | Description |
| GLONACT | FCX317 | Global Networking Object Activity | Displays activity data related to global VSWITCHes. |
The following reports have been changed:
Performance Toolkit for VM: Changed Reports
| Name | Number | Title | What Changed |
| MONDATA | FCX155 | Monitor Data Statistics | Added information related to global VSWITCHes. |
| IOCHANGE | FCX185 | I/O Configuration Changes | Added information related to global VSWITCHes. |
| VSWITCH | FCX240 | Virtual Switch Activity | Added information related to global VSWITCHes. |
| GVSWITCH | FCX266 | General Virtual Switch Description | Added information related to global VSWITCHes. |
| EVSWITCH | FCX267 | Extended Virtual Switch Description | Added information related to global VSWITCHes. |
VM65699: New and Repaired Function
With VM65699 Performance Toolkit for VM includes several improved reports and numerous internal repairs.
The following reports have been changed:
Performance Toolkit for VM: Changed Reports
| Name | Number | Title | What Changed |
| FCHANNEL | FCX215 | FICON Channel Load | Changed to add channel read and write speeds. |
| MONDATA | FCX155 | Monitor Data Statistics | Displays all event records that arrived after the last sample interval. |
| USTAT | FCX114 | User Wait States | In headers, %Time spent in was changed to %Samples showing. |
| USTLOG | FCX135 | User Wait States Log | In headers, %Time spent in was changed to %Samples showing. |
| USTATLOG | FCX164 | User Wait States Log | In headers, %Time spent in was changed to %Samples showing. |
| USTMPLOG | FCX315 | Multiprocessor User Wait States Log | In headers, %Time spent in was changed to %Samples showing. |
| LPAR | FCX126 | LPAR Load | In headers, LPU was changed to Core. |
| LPARLOG | FCX202 | LPAR Load Log | In headers, LPU was changed to Core. |
| PROCCONF | FCX234 | Processor/Core Configuration Log | In headers, LPU was changed to Core. |
| LPARCONF | FCX235 | LPAR Configuration Log | In headers, LPU was changed to Core. |
| TOPOLOG | FCX287 | System Topology Machine Organization | In headers, LPU was changed to Core. |
| PUORGLOG | FCX298 | Logical Core Organization Log | In headers, LPU was changed to Core. |
| PHYSLOG | FCX302 | Real Core Utilization Log | In headers, LPU was changed to Core. |
| LSHARACT | FCX306 | Logical Partition Share | In headers, LPU was changed to Core. |
| LPARLOGM | FCX307 | Logical Partition Logs Menu | In headers, LPU was changed to Core. |
| SYSCONF | FCX180 | System Configuration | Displays CPC type-model and Model-Capacity Identifier when available. |
| PUCFGLOG | FCX299 | Logical PU (Core and Threads) Configuration Log | Uses "Core" in description. |
| SYSLOG | FCX179 | System Facilities Log | User exits columns now show %Busy, and calculation of existing usec is changed. |
VM65698: IBM z13 GA2 and z13s
With VM65698 Performance Toolkit for VM includes support for the IBM z13 2964 GA2 and the IBM z13s 2965.
The following reports are new:
Performance Toolkit for VM: New Reports
| Name | Number | Title | Description |
| PCIACT | FCX322 | PCI Function Activity, Format 3 | Displays activity for format-3 PCI functions. |
| PCILOG | FCX323 | PCI Function Activity Log, Format 3 | Displays a log of activity for a selected format-3 PCI function. |
The following reports have been changed:
Performance Toolkit for VM: Changed Reports
| Name | Number | Title | What Changed |
| PCIMENU | FCX310 | PCI Function Menu | Added entry for format-3 PCI functions. |
| PCICONF | FCX311 | PCI Function Configuration | Added information for format-3 PCI functions. |
VM65697: CPU Pooling, LPAR Group Capping, and Prorated Core Time
With VM65697 Performance Toolkit for VM includes support for CPU Pooling, LPAR Group Capping, and Prorated Core Time.
The following reports are new:
Performance Toolkit for VM: New Reports
| Name | Number | Title | Description |
| CPLMENU | FCX324 | CPU Pool Menu | Displays a menu of choices related to CPU Pooling. |
| CPLCONF | FCX308 | CPU Pool Configuration | Displays configuration information related to CPU Pooling. |
| CPLACT | FCX309 | CPU Pool Activity Data | Displays activity data related to CPU Pooling. |
The following reports have been changed:
Performance Toolkit for VM: Changed Reports
| Name | Number | Title | What Changed |
| MENU | FCX124 | Performance Data Selection Menu | Added selection 2A. |
| UCONF | FCX226 | Performance Data Selection Menu | Added column for CPU pool name. |
| LPAR | FCX126 | LPAR Load Screen |
|
| LPARLOG | FCX202 | LPAR Load Screen |
|
| LSHARACT | FCX306 | Logical Partition Share | Added GrpCapNm and GrpCap columns. |
z/VM 6.4: New Function
With z/VM 6.4 Performance Toolkit for VM includes support for a new report, LOCKACT.
The following reports are new:
Performance Toolkit for VM: New Reports
| Name | Number | Title | Description |
| CPUMENU | FCX325 | CPU Data Menu | The CPU Data Menu Screen shows a selection menu of CPU options, namely, CPU, DSVBKACT, and LOCKACT. |
| LOCKACT | FCX326 | Spin Lock Collision Activity | The Spin Lock Collision Activity Screen shows mean lock behavior. To see the interval-to-interval lock statistics, use INTERIM LOCKACT. These are available when z/VM 6.4 Performance Toolkit reduces data from any supported z/VM system. |
The following reports have been changed:
Performance Toolkit for VM: Changed Reports
| Name | Number | Title | What Changed |
| MENU | FCX124 | Performance Screen Selection Menu | Changed number 1 to go to menu CPUMENU instead of to report CPU. |
| LOCKLOG | FCX265 | Spin Lock Log | This data screen can not be produced when z/VM 6.4 Performance Toolkit reduces data from a z/VM 6.4 or later system. |
Take note: The z/VM 6.4 version of Performance Toolkit must run on z/CMS.
With z/VM 6.4 Performance Toolkit for VM now provides support for using memory above the 2 GB line (called High Memory Area or HMA). To have a HMA and use memory above 2 GB, the PERFSVM directory entry needs to include memory above 2 GB. It is recommended that PERFSVM includes the entire 2 GB to 4 GB range of memory. With this support, z/VM 6.4 Performance Toolkit has two changed commands:
- FCONTROL HMA was added to query the current HMA usage.
- FCONTROL LIMIT was changed to add three new threshold limits; namely, HMAPAGE, HMAPRINT, and STORB2G.
Performance Toolkit for VM has not yet been enhanced to depict what the monitor records report about CP's use of HyperPAV aliases. In the meantime there is a VM Download Library package called HPALIAS you can use.
Omegamon XE Changes
OMEGAMON XE has added a new workspace so as to expand and enrich its ability to comment on z/VM system performance. OMEGAMON XE will now display data on any CPU pools that you have defined for your z/VM system. It will allow you to see the usage of your CPU pools and determine which pools are near capacity and which ones are under-utilized.
To support these OMEGAMON XE endeavors, Performance Toolkit for VM now puts additional CP Monitor data into the PERFOUT DCSS.
Back to Table of Contents.
New Functions
This section contains discussions of the following performance evaluations:
- Memory Management Serialization Contention Relief
- z/VM Paging Improvements
- CP Scheduler Improvements
- RSCS TCPNJE Encryption
- TLS/SSL Server Changes
Back to Table of Contents.
Memory Management Serialization Contention Relief and 2 TB Central Storage Support
Abstract
Memory Management Serialization Contention Relief (hence, the enhancement) provides performance improvements to the memory management subsystem. It enables workload scaling up to the new z/VM 6.4 maximum supported central storage size of 2 TB.
Spin lock contention in the memory management subsystem has been a barrier to supporting central storage sizes above 1 TB. With z/VM 6.4 extensive changes were made to lock structures resulting in reduced spin lock contention. With these lock structure changes, along with other memory management subsystem changes, IBM measurements demonstrate the ability to scale workloads up to the new z/VM 6.4 maximum supported central storage size of 2 TB.
Background
As systems increase in memory size and number of processors, workloads can grow, putting more demand on the frame manager. The frame manager is the collection of modules in the z/VM memory management subsystem that maintains lists of available frames, manages requests for frames, and coalesces frames as they are returned.
Prior to z/VM 6.4 there were two locks providing serialized access to the lists of available frames: one lock for below-2-GB frames and one lock for above-2-GB frames. Contention for these locks, particularly on the lock for frames above 2 GB (RSA2GLCK), was noticeable with various workloads. This contention was limiting the growth of real memory z/VM could support.
The primary change made in the frame manager for z/VM 6.4 was to organize central storage into available list zones. An available list zone represents a range of central storage, much like the below-2-GB available lists and the above-2-GB available lists represented a range of central storage in prior releases. Management of the available frames within a zone is serialized by a lock unique to that zone. Zone locks are listed as AVZAnnnn and AVZBnnnn in monitor record D0 R23 MRSYTLCK, where nnnn is the zone number. The number and size of zones is determined internally by z/VM and can depend on the maximum potential amount of central storage, the number of attached processors, and whether the zone represents central storage above 2 GB or below 2 GB.
Other improvements to the frame manager include:
- The ability to queue frame returns so a task returning a frame is not delayed when the zone lock is not available.
- Improved defer logic which will check the global Invalid But Resident (IBR) aging list for a satisfactory frame before deferring the requestor.
- Enhanced available list replenishment logic which can run simultaneously to the global IBR aging list replenishment.
- More appropriate thresholds for available frame requests.
Another area where improvements have been made is in Page Table Resource Manager (PTRM) page allocations. In heavy paging environments significant lock contention was observed with a single PTRM address space allocation lock. The contention is now avoided by using CPU address to spread PTRM allocations across the 128 PTRM address spaces.
All of these items combined have enabled a new z/VM 6.4 maximum supported central storage size of 2 TB.
Method
A scan of previous IBM measurements revealed the Sweet Spot Priming workload (which uses the Virtual Storage Exerciser) experienced the highest level of spin lock contention on the available lists locks. Based on that finding the Sweet Spot Priming workload was chosen to measure the effectiveness of the enhancement.
In addition, both the Sweet Spot Priming workload and the Apache Scaling workload were used to measure the scalability of workloads up to the new z/VM 6.4 maximum supported central storage size of 2 TB.
Sweet Spot Priming Workload Using VIRSTOEX
The Sweet Spot Priming workload was designed to place high demand on the memory management subsystem. It consists of four sets of users which "prime" their virtual memory by changing data in a predetermined number of pages. This may be viewed as analogous to a customer application reading a database into memory. The workload is designed to overcommit memory by approximately 28%. The four sets of users are logged on sequentially. Each group completes its priming before the next group is logged on. The first three sets of users do not cause paging during priming. For the first three sets of users, only elapsed time is of interest. Each user touches a fixed number of pages based on virtual machine size. The fourth set of users does cause paging during priming. For the fourth set of users, ETR is defined as thousands of pages written to paging DASD per second.
Sweet Spot Priming workload measurements were used to evaluate the reduced lock contention and illustrate the improved performance of the workload as a result. The number of CPUs was held constant while central storage size and the virtual memory size of the users were increased to maintain a constant memory overcommitment level.
A modified z/VM 6.3 Control Program was used to obtain measurements with central storage sizes larger than the z/VM 6.3 maximum supported central storage size of 1 TB.
Table 1 shows the Sweet Spot Priming workload configurations used.
| Table 1. Sweet Spot Priming Workload Configurations. | ||||||||
| Central Storage in GB | 256 | 512 | 768 | 1024 | 1280 | 1536 | 1792 | 2048 |
| IFL Cores | 64 | 64 | 64 | 64 | 64 | 64 | 64 | 64 |
| CM1x Users | 88 | 88 | 88 | 88 | 88 | 88 | 88 | 88 |
| CM2x Users | 88 | 88 | 88 | 88 | 88 | 88 | 88 | 88 |
| CM3x Users | 88 | 88 | 88 | 88 | 88 | 88 | 88 | 88 |
| CM4x Users | 88 | 88 | 88 | 88 | 88 | 88 | 88 | 88 |
| CMx Virtual Memory Size in GB | 6.5 | 11 | 15.5 | 20 | 24.5 | 29 | 33.5 | 38 |
| Notes: The number of CPUs was held constant while central storage size and virtual memory size of the users were increased to maintain a constant memory overcommitment level. CEC model 2964-NC9. Dedicated LPAR with 64 IFL cores in non-SMT mode. The VIRSTOEX program only touches virtual memory above 2 GB. | ||||||||
Apache Scaling Workload Using Linux
The Apache Scaling workload was used to illustrate a Linux-based webserving workload that scales up to a central storage size of 2 TB. The Apache Scaling workload has a small amount of memory overcommitment. The memory overcommitment was kept small to avoid a large volume of paging that would cause the DASD paging subsystem to become the limiting factor for the workload as it were scaled up with cores, memory, and AWM clients and servers.
To allow comparisons with central storage sizes above 1 TB a modified z/VM 6.3 Control Program was used to obtain measurements with central storage sizes larger than the z/VM 6.3 maximum supported central storage size of 1 TB.
Table 2 shows the Apache Scaling workload configurations used.
| Table 2. Apache Scaling Workload Configurations | ||||
| Central storage in GB | 512 | 1024 | 1536 | 2048 |
| IFL cores | 8 | 16 | 24 | 32 |
| AWM clients (1 GB) | 4 | 8 | 12 | 16 |
| AWM servers (30 GB) | 24 | 48 | 72 | 96 |
| Notes: AWM clients and servers are arranged in groups to keep the total number of client/server sessions manageable. Each AWM client has a session with 6 servers. CEC model 2964-NC9. Dedicated LPAR with IFL cores in non-SMT mode. | ||||
Results and Discussion
Sweet Spot Priming Workload Measurements Results
Table 3 contains selected results of z/VM 6.3 measurements. Table 4 contains selected results of z/VM 6.4 measurements. Table 5 contains comparisons of selected results of z/VM 6.4 measurements to z/VM 6.3 measurements.
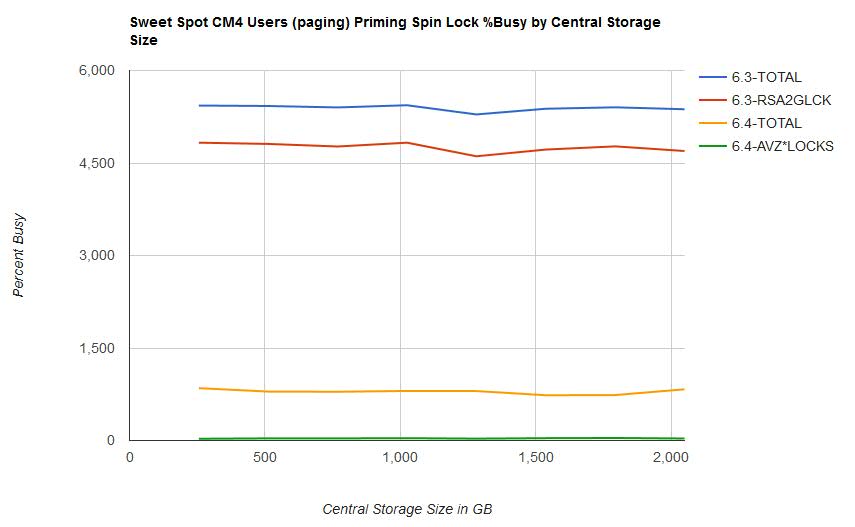
- Overall spin lock contention decreased from z/VM 6.3 to z/VM 6.4. This was the expected result of the enhancement. See Figure 1.
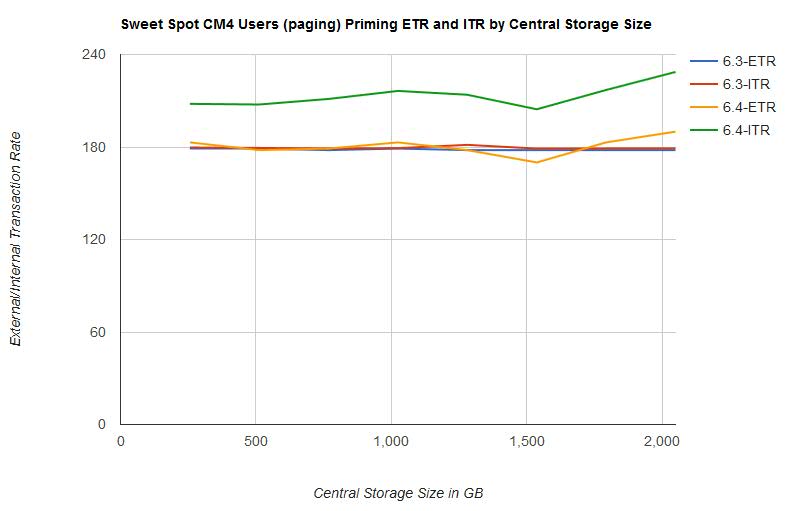
- ETR was relatively the same in both z/VM 6.3 and z/VM 6.4. This was the expected result. The workload is limited by test system DASD paging infrastructure. See Figure 4.
- ITR increased from z/VM 6.3 to z/VM 6.4. See Figure 4.
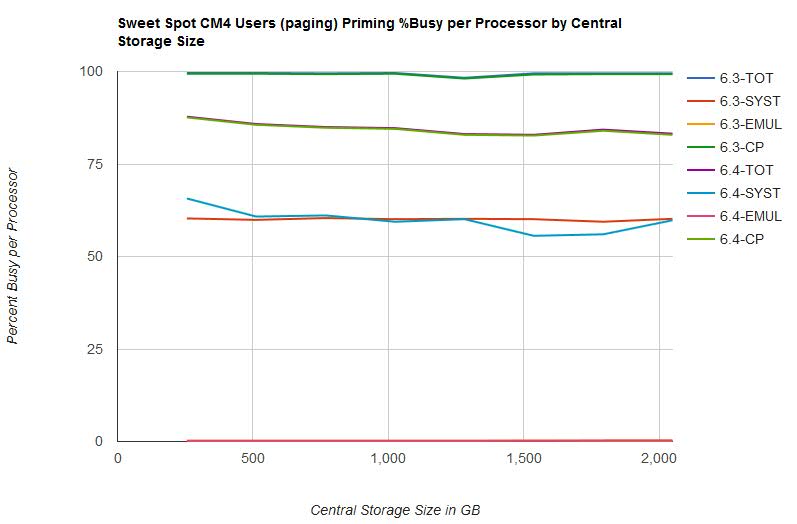
- Processor utilization decreased from z/VM 6.3 to z/VM 6.4. See Figure 5.
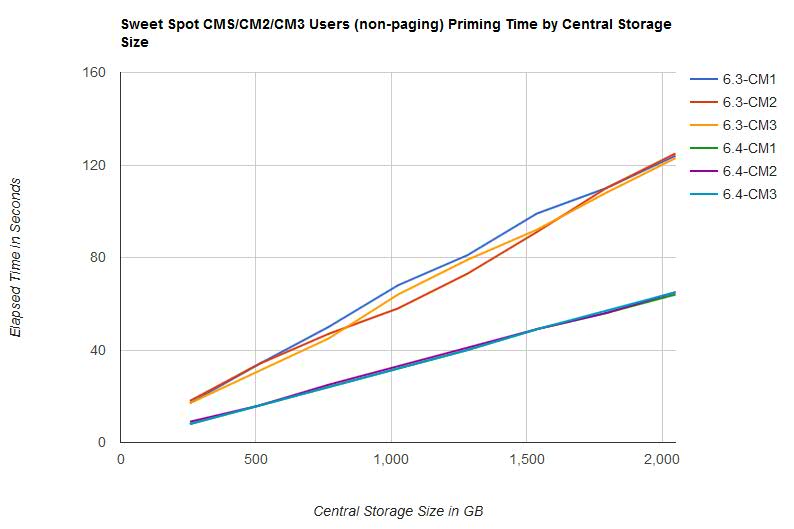
- Elapsed time for CM1, CM2, and CM3 users (non-paging) priming phases decreased from z/VM 6.3 to z/VM 6.4. Elapsed time scaled linearly as central storage size increased. See Figure 2.
- Elapsed time for CM4 users (paging) priming phase remained relatively the same from z/VM 6.3 to z/VM 6.4. The workload is limited by test system DASD paging infrastructure.
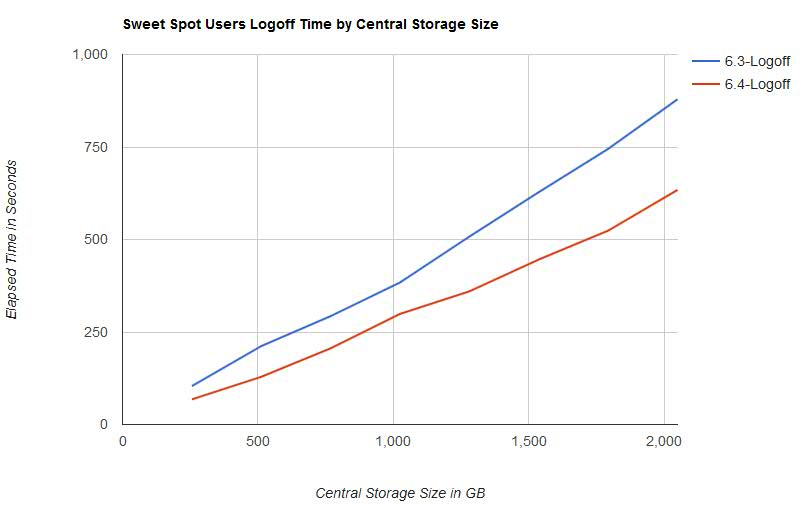
- Elapsed time for logoff of all users decreased from z/VM 6.3 to z/VM 6.4. Elapsed time scaled linearly as central storage size increased. See Figure 3.
Figure 1 illustrates the spin lock percent busy for the CM4 users (paging) priming phase by central storage size.
| Figure 1. Sweet Spot CM4 Users (paging) Priming Spin Lock %Busy by Central Storage Size. |
|
Figure 2 illustrates the elapsed time for the CM1, CM2, and CM3 users (non-paging) priming phases by central storage size.
| Figure 2. Sweet Spot CM1/CM2/CM3 Users (non-paging) Priming Time by Central Storage Size. |
|
Figure 3 illustrates the elapsed time for the logoff phase by central storage size.
| Figure 3. Sweet Spot Users Logoff Time by Central Storage Size. |
|
Figure 4 illustrates the external and internal transaction rate for the CM4 users (paging) priming phase by central storage size.
| Figure 4. Sweet Spot CM4 Users (paging) Priming ETR and ITR by Central Storage Size. |
|
Figure 5 illustrates the percent busy per processor for the CM4 users (paging) phase by central storage size.
| Figure 5. Sweet Spot CM4 Users (paging) Priming %Busy per Processor by Central Storage Size. |
|
Table 3 shows the Sweet Spot Priming workload results on z/VM 6.3.
| Table 3. Sweet Spot Priming Workload z/VM 6.3 results. | ||||||||
| Central Storage in GB | 256 | 512 | 768 | 1024 | 1280 | 1536 | 1792 | 2048 |
| Runid | SSXS6287 | SSXS6288 | SSXS6289 | SSXS628A | SSXS628B | SSXS628C | SSXS628D | SSXS628E |
| ETR | 179.02 | 178.65 | 178.25 | 178.59 | 178.35 | 178.07 | 178.24 | 178.23 |
| ITR | 179.7 | 179.4 | 179.1 | 179.3 | 181.4 | 179.0 | 179.1 | 179.1 |
| Total Busy per Processor | 99.6 | 99.6 | 99.5 | 99.6 | 98.3 | 99.5 | 99.5 | 99.5 |
| System Busy per Processor | 60.3 | 59.9 | 60.4 | 60.1 | 60.2 | 60.1 | 59.4 | 60.2 |
| Emulation Busy per Processor | 0.2 | 0.2 | 0.2 | 0.2 | 0.2 | 0.3 | 0.2 | 0.2 |
| CP Busy per Processor | 99.4 | 99.4 | 99.3 | 99.4 | 98.1 | 99.2 | 99.3 | 99.3 |
| T/V Ratio | 404.3 | 404.3 | 409.2 | 408.9 | 406.3 | 395.1 | 412.5 | 412.6 |
| Total Spin Lock Busy | 5432.05 | 5424.83 | 5401.44 | 5436.85 | 5287.71 | 5380.59 | 5403.33 | 5372.19 |
| RSA2GLCK Spin Lock Busy | 4829.77 | 4809.88 | 4767.82 | 4829.73 | 4609.50 | 4718.28 | 4770.21 | 4694.73 |
| CM1 Users Priming Time | 17 | 34 | 50 | 68 | 81 | 99 | 110 | 124 |
| CM2 Users Priming Time | 18 | 34 | 47 | 58 | 73 | 91 | 110 | 125 |
| CM3 Users Priming Time | 17 | 31 | 45 | 64 | 79 | 92 | 108 | 123 |
| CM4 Users Priming Time | 116 | 234 | 338 | 452 | 565 | 678 | 789 | 903 |
| Logoff Time | 104 | 212 | 293 | 384 | 508 | 628 | 745 | 879 |
| Notes: CEC model 2964-NC9. Dedicated LPAR with 64 IFL cores in non-SMT mode. | ||||||||
Table 4 shows the Sweet Spot Priming workload results on z/VM 6.4.
| Table 4. Sweet Spot Priming Workload z/VM 6.4 results. | ||||||||
| Central Storage in GB | 256 | 512 | 768 | 1024 | 1280 | 1536 | 1792 | 2048 |
| Runid | SSYS8154 | SSYS8155 | SSYS8156 | SSYS8151 | SSYS8157 | SSYS8158 | SSYS8159 | SSYS8150 |
| ETR | 182.64 | 178.16 | 179.50 | 183.30 | 177.78 | 169.57 | 182.95 | 190.30 |
| ITR | 208.0 | 207.6 | 211.2 | 216.4 | 213.9 | 204.5 | 217.0 | 228.7 |
| Total Busy per Processor | 87.8 | 85.8 | 85.0 | 84.7 | 83.1 | 82.9 | 84.3 | 83.2 |
| System Busy per Processor | 65.7 | 60.8 | 61.1 | 59.4 | 60.1 | 55.6 | 56.0 | 59.8 |
| Emulation Busy per Processor | 0.2 | 0.2 | 0.2 | 0.2 | 0.2 | 0.2 | 0.3 | 0.3 |
| CP Busy per Processor | 87.6 | 85.6 | 84.8 | 84.5 | 82.9 | 82.7 | 84.0 | 82.9 |
| T/V Ratio | 356.8 | 356.8 | 351.3 | 341.1 | 350.6 | 360.0 | 336.2 | 329.3 |
| Total Spin Lock Busy | 848.49 | 793.67 | 791.25 | 804.14 | 802.47 | 733.87 | 737.75 | 830.40 |
| AVZLOCKS Spin Lock Busy | 28.90 | 34.52 | 34.79 | 38.38 | 31.04 | 38.20 | 41.31 | 33.18 |
| CM1 Users Priming Time | 8 | 16 | 24 | 32 | 40 | 49 | 56 | 64 |
| CM2 Users Priming Time | 9 | 16 | 25 | 33 | 41 | 49 | 56 | 65 |
| CM3 Users Priming Time | 8 | 16 | 24 | 32 | 40 | 49 | 57 | 65 |
| CM4 Users Priming Time | 116 | 229 | 338 | 444 | 563 | 706 | 767 | 845 |
| Logoff Time | 68 | 129 | 206 | 299 | 360 | 446 | 524 | 634 |
| Notes: CEC model 2964-NC9. Dedicated LPAR with 64 IFL cores in non-SMT mode. | ||||||||
Table 5 shows the comparison of z/VM 6.4 results to z/VM 6.3 results.
| Table 5. Sweet Spot Priming Workload z/VM 6.4 results compared to z/VM 6.3 results. | ||||||||
| Central Storage in GB | 256 | 512 | 768 | 1024 | 1280 | 1536 | 1792 | 2048 |
| ETR | +2.0% | +0.3% | +0.7% | +2.6% | -0.3% | -4.8% | +2.6% | +6.8% |
| ITR | +15.7% | +15.7% | +17.9% | +20.7% | +17.9% | +14.2% | +21.2% | +27.7% |
| Total Busy per Processor | -11.8% | -13.9% | -14.6% | -15.0% | -15.5% | -16.7% | -15.3% | -16.4% |
| System Busy per Processor | +9.0% | +1.5% | +1.2% | -1.2% | -0.2% | -7.5% | -5.7% | -0.7% |
| Emulation Busy per Processor | 0.0% | 0.0% | 0.0% | 0.0% | 0.0% | -33.3% | +50.0% | +50.0% |
| CP Busy per Processor | -11.9% | -13.9% | -14.6% | -15.0% | -15.5% | -16.6% | -15.4% | -16.5% |
| T/V Ratio | -11.7% | -11.7% | -14.1% | -16.6% | -13.7% | -8.9% | -18.5% | -20.2% |
| Total Spin Lock Busy | -84.4% | -85.4% | -85.4% | -85.2% | -84.8% | -86.4% | -86.3% | -84.5% |
| Available List Spin Locks Busy | -99.4% | -99.3% | -99.3% | -99.2% | -99.3% | -99.2% | -99.1% | -99.3% |
| CM1 Users Priming Time | -52.9% | -52.9% | -52.0% | -52.9% | -50.6% | -50.5% | -49.1% | -48.4% |
| CM2 Users Priming Time | -50.0% | -52.9% | -46.8% | -43.1% | -43.8% | -46.2% | -49.1% | -48.0% |
| CM3 Users Priming Time | -52.9% | -48.4% | -46.7% | -50.0% | -49.4% | -46.7% | -47.2% | -47.2% |
| CM4 Users Priming Time | 0.0% | -2.1% | 0.0% | -1.8% | -0.4% | +4.1% | -2.8% | -6.4% |
| Logoff Time | -34.6% | -39.2% | -29.7% | -22.1% | -29.1% | -29.0% | -29.7% | -27.9% |
| Notes: All deltas are percentage difference of z/VM 6.4 measurements compared to z/VM 6.3 measurements. CEC model 2964-NC9. Dedicated LPAR with 64 IFL cores in non-SMT mode. | ||||||||
Apache Scaling Workload Measurements Results
Table 6 contains selected results of z/VM 6.3 measurements. Table 7 contains selected results of z/VM 6.4 measurements. Table 8 contains comparisons of the selected results of z/VM 6.4 measurements to z/VM 6.3 measurements.
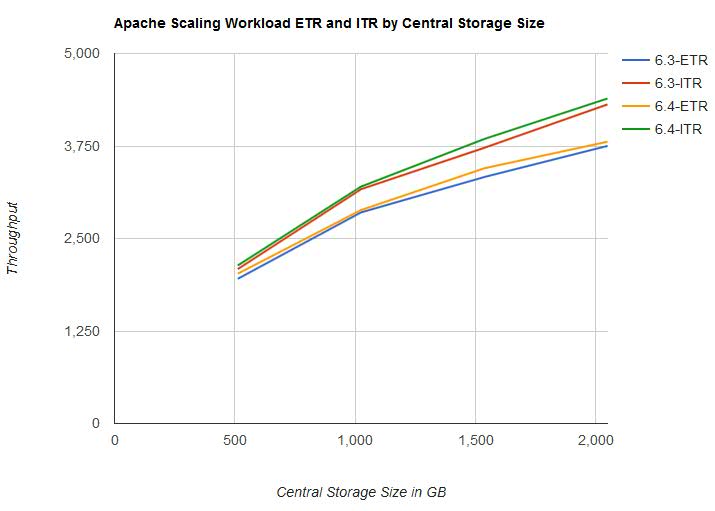
- Both ETR and ITR improved from z/VM 6.3 to z/VM 6.4 with the largest difference occurring between 1 TB and 2 TB of central storage. See Figure 6.
- Processor utilization was mostly unchanged from z/VM 6.3 to z/VM 6.4. There was a small variation at the lower increments of central storage but almost none from 1 TB to 2 TB. See Table 6, Table 7, and Table 8.
Figure 6 illustrates the external and internal transaction rate for the Apache Scaling workload by central storage size.
| Figure 6. Apache Scaling workload - ETR and ITR by Central Storage Size. |
|
Table 6 shows the Apache Scaling workload results on z/VM 6.3.
| Table 6. Apache Scaling workload z/VM 6.3 results. | ||||
| IFL Cores | 8 | 16 | 24 | 32 |
| Central Storage in GB | 512 | 1024 | 1536 | 2048 |
| Run ID | A51X628Z | A1TX628Z | A15X628Z | A2TX628Z |
| ETR | 1955.76 | 2853.14 | 3330.71 | 3751.85 |
| ITR | 2087.30 | 3166.60 | 3725.60 | 4312.50 |
| Total Busy per Processor | 93.7 | 90.1 | 89.4 | 87.0 |
| Emulation Busy per Processor | 68.6 | 66.3 | 61.9 | 59.9 |
| CP Busy per Processor | 25.1 | 23.8 | 27.5 | 27.1 |
| T/V Ratio | 1.37 | 1.36 | 1.44 | 1.45 |
| Notes: CEC model 2964-NC9. Dedicated LPAR with IFL cores in non-SMT mode. | ||||
Table 7 shows the Apache Scaling workload results on z/VM 6.4.
| Table 7. Apache Scaling Workload z/VM 6.4 results. | ||||
| IFL Cores | 8 | 16 | 24 | 32 |
| Central Storage in GB | 512 | 1024 | 1536 | 2048 |
| Run ID | A51Y715Z | A1TY715Z | A15Y715Z | A2TY715Z |
| ETR | 2024.75 | 2884.61 | 3449.17 | 3808.00 |
| ITR | 2135.80 | 3201.60 | 3845.20 | 4392.20 |
| Total Busy per Processor | 94.8 | 90.1 | 89.7 | 86.7 |
| Emulation Busy per Processor | 68.6 | 66.1 | 62.3 | 59.6 |
| CP Busy per Processor | 26.2 | 24.0 | 27.4 | 27.1 |
| T/V Ratio | 1.38 | 1.36 | 1.44 | 1.45 |
| Notes: CEC model 2964-NC9. Dedicated LPAR with IFL cores in non-SMT mode. | ||||
Table 8 shows the Apache Scaling workload results of z/VM 6.4 compared to z/VM 6.3.
| Table 8. Apache Scaling Workload z/VM 6.4 results compared to z/VM 6.3 results. | ||||
| IFL Cores | 8 | 16 | 24 | 32 |
| Central Storage in GB | 512 | 1024 | 1536 | 2048 |
| ETR | +3.5% | +1.1% | +3.6% | +1.5% |
| ITR | +2.3% | +1.1% | +3.2% | +2.0% |
| Total Busy per Processor | +1.2% | 0.0% | +0.3% | -0.3% |
| Emulation Busy per Processor | 0.0% | -0.3% | +0.6% | -0.5% |
| CP Busy per Processor | +4.4% | +0.8% | -0.4% | 0.0% |
| T/V Ratio | +0.7% | 0.0% | 0.0% | 0.0% |
| Notes: All deltas are percentage difference of z/VM 6.4 measurements compared to z/VM 6.3 measurements. CEC model 2964-NC9. Dedicated LPAR with IFL cores in non-SMT mode. | ||||
Summary and Conclusions
Memory Management Serialization Contention Relief provides performance improvements as central storage size is increased. The results of IBM measurements demonstrate spin lock contention is reduced and workloads scale up to the new z/VM 6.4 maximum supported central storage size of 2 TB.
Back to Table of Contents.
z/VM Paging Improvements
Abstract
z/VM 6.4 provides several paging enhancements. The Control Program (CP) was improved to increase both I/O payload sizes and the efficiency of page blocking. Also, CP can use the HyperPAV feature of the IBM System Storage DS8000 line of storage controllers for paging I/O. Further, CP can also use High Performance FICON (zHPF) transport-mode I/O for paging I/O. For amenable z/VM paging workloads, these enhancements can result in increased throughput or the equivalent throughput with fewer physical volumes.
IBM experiments using the command-mode paging driver resulted in a 42% transaction rate improvement. Adding HyperPAV aliases to a paging workload with I/Os queueing on the paging devices resulted in a 42% transaction rate improvement. Using transport-mode I/O resulted in a 98% transaction rate improvement. Using HyperPAV aliases and transport-mode I/Os resulted in a 234% transaction rate improvement.
Introduction
In z/VM 5.3 IBM introduced HyperPAV support for DASD volumes containing guest minidisks. z/VM 6.4 exploits HyperPAV for paging extents. Readers not familiar with HyperPAV or not familiar with z/VM's HyperPAV support should read IBM's HyperPAV technology description before continuing here.
In z/VM 6.2 IBM introduced zHPF support for guest operating system use. z/VM 6.4 exploits zHPF for paging I/O. Readers not familiar with zHPF or not familiar with z/VM's zHPF support for guests should read IBM's High Performance FICON description before continuing here. To use zHPF for paging I/Os, FICON Express8S or newer is required.
z/VM 6.4 also features enhancements to the paging subsystem improving logical page blocking and increasing I/O payload.
The command-mode I/O driver is the default paging I/O driver for z/VM 6.4. zHPF and HyperPAV aliases are optional and need to be enabled for use. Improvements were also made in the paging subsystem to increase the number of contiguous slots written on a single volume by one channel program, resulting in larger I/O payloads.
Method
Paging Evaluations
The new paging I/O options were evaluated with a Virtual Storage Exerciser (VIRSTOR) workload. The particulars of the workload held constant across all paging measurements were:
- z13, dedicated LPAR, eight IFL cores, non-SMT, 128 GB central storage
- Paging volumes on a single LCU of a DS8800
- Eight 18 GB virtual uniprocessor users running VIRSTOEX, a memory thrasher, with VIRSTOEX configured to cause heavy paging by looping through a 16 GB loop touching every page.
- VIRSTOR parameters: loops=1,cpus=01,i=4,v=4,w=50
Command-Mode Paging Driver Measurement
This measurement compares the command-mode paging driver to the z/VM 6.3 paging driver. Both runs use the same four paging extents.
Transport-Mode Paging Driver Measurement
This measurement compares the transport-mode paging driver to the command-mode paging driver. Both runs use the same four paging extents.
HyperPAV Alias Paging Measurement
This measurement demonstrates the effect of adding HyperPAV aliases to a paging workload capable of using them. Both runs use the same four paging extents. The comparison run has four HyperPAV aliases enabled for use with the paging volumes.
HyperPAV Alias Paging DASD Reduction Measurement
This measurement demonstrates the effect of using HyperPAV aliases to replace paging volumes to achieve the same parallelism. The base run uses eight paging extents. The comparison run uses four paging extents and four HyperPAV aliases enabled for use with the paging volumes.
Transport-Mode Paging Driver and HyperPAV Alias Paging Measurement
This measurement demonstrates the effect of using z/VM 6.4 with HyperPAV aliases and transport-mode both enabled for use by four paging volumes.
HyperPAV Alias Sharing Measurement
In z/VM 6.4 the CP SET CU command was enhanced to let an administrator specify a sharing policy the Control Program should observe when minidisk I/O and paging I/O are competing for the HyperPAV aliases of an LCU. The sharing policy implements a relative-share model matching the notion of relative CPU share as implemented by CP SET SHARE. In the present case of the sharing of HyperPAV aliases, minidisk I/O and paging I/O are the "users" and the HyperPAV aliases are the contended-for resource to be shared. When there is more demand for HyperPAV aliases than there are HyperPAV aliases available, the Control Program hands out the aliases to minidisk I/O and to paging I/O in accordance with their respective CU alias share settings.
To measure the effect of the CP SET CU command, IBM set up a hybrid, memory-constrained workload consisting of two groups of users. The first group had a high demand for minidisk I/O. Further, via CP SET RESERVED this first group was kept protected from central storage contention. The second group, memory thrashers, had a high demand for paging I/O. The real DASD volumes holding the minidisks and the real DASD volumes holding the paging space resided together in a single LCU along with some HyperPAV aliases. By using the CP SET CU command to vary the alias-share settings for minidisk I/O and paging I/O, IBM was able to observe whether the Control Program enforced the CU share settings correctly. IBM was also able to see the effect the CU share settings had on the performance of the two groups of users.
The particulars of the workload were:
- z13, dedicated LPAR, four cores, non-SMT, 8 GB central.
- A single LCU of a DS8800, said LCU equipped with four DASD volumes holding minidisks, two DASD volumes holding paging space, and sixteen HyperPAV aliases attached to SYSTEM.
- Thirty-two virtual uniprocessor guests running the IO3390 DASD I/O exerciser, each such guest protected from memory contention via CP SET RESERVED. In this group of guests, a transaction is a minidisk I/O. Notice IBM used more IO3390 guests than there were SYSTEM-attached HyperPAV aliases. This was done so MDISK alias demand would always be high enough to use all the aliases.
- Twelve virtual uniprocessor users running VIRSTOCX, a memory thrasher, with VIRSTOCX configured to cause heavy paging. In this group of guests, a transaction is 1000 references to pages. A reference might or might not cause a page fault. Notice IBM used fewer VIRSTOCX guests than the number of SYSTEM-attached HyperPAV aliases. This was done so PAGING would not have enough alias demand to use all of its alias entitlement when its alias entitlement was very high.
IBM did fifteen runs of this workload. Each run used a different pair of relative-share settings for MDISK and PAGING. The pairs of settings were chosen to cover the spectrum from heavy favor for MDISK, to equal weight, to heavy favor for PAGING. IBM recorded the ETR of the minidisk users and also the ETR of the paging users. IBM also used the D6 R28 MRIODHPP monitor records to observe whether the Control Program were respecting the CU share settings.
Results and Discussion
Command-Mode Paging Driver Measurement
Table 1 reports the result of the command-mode measurement.
| Table 1. Effect of command-mode paging driver. | ||||
| Run ID | V4DVX001 | V4DVY000 | Delta | Pct |
| CP level | 6.3.0 | 6.4.0 | ||
| Type and model | 2964-NC9 | 2964-NC9 | ||
| Processors | 8 | 8 | 0 | 0.0 |
| SYSGEN storage | 131072 | 131072 | 0 | 0.0 |
| Paging devices | 4 | 4 | 0 | 0.0 |
| ETR | 0.0310 | 0.0442 | 0.0132 | 42.6 |
| Total busy | 12.0 | 15.4 | 3.4 | 28.3 |
| Guest busy | 2.5 | 3.7 | 1.2 | 48.0 |
| Chargeable CP busy | 1.1 | 1.2 | 0.1 | 9.1 |
| Nonchargeable CP busy | 8.4 | 10.5 | 2.1 | 25.0 |
| Chargeable CP busy, /tx | 0.0355 | 0.0271 | -0.0084 | -23.7 |
| Nonchargeable CP busy, /tx | 0.2710 | 0.2376 | -0.0334 | -12.3 |
| Pages written to DASD, /sec | 31985 | 44459 | 12474 | 39.0 |
| Pages read from DASD, /sec | 32027 | 44466 | 12439 | 38.8 |
| Paging SSCH insts, /sec | 1487 | 1578 | 91 | 6.1 |
| Pages per SSCH | 43.0 | 56.4 | 13.4 | 31.1 |
| Page read blocking | 28 | 38 | 10 | 35.7 |
| Page write blocking | 27 | 32 | 5 | 18.5 |
| Page slot utilization, % | 11 | 15 | 4 | 36.4 |
| DASD connect time, /IO, ms | 2.250 | 1.970 | -0.280 | -12.4 |
| DASD disconnect time, /IO, ms | 0.019 | 0.006 | -0.013 | -68.4 |
| DASD pending time, /IO, ms | 0.135 | 0.139 | 0.004 | 3.0 |
| DASD service time, /IO, ms | 2.400 | 2.110 | -0.290 | -12.1 |
| Notes: z13, dedicated 8-core, non-SMT, 128 GB central. DS8800 with single LCU containing four DASD volumes holding paging extents, eight VIRSTOEX users, virtual uniprocessor, configured to page heavily. | ||||
The z/VM 6.4 command-mode paging I/O driver and paging subsystem improvements improved ETR 42.6% over z/VM 6.3. Improvements in the paging subsystem increased the pages per SSCH 31.1%, the read blocking 35.7%, and the write blocking 18.5%. Service time improved 12.1% led by a 68.4% decrease in disconnect time. These measurements show the low CPU cost of paging. The z/VM 6.4 command-mode measurement was able to page at a rate of 44,459 pages per second using only 11.7% of an IFL core in chargable-CP and non-chargeable-CP busy.
Transport-Mode Paging Driver Measurement
Table 2 reports the result of the transport-mode measurement.
| Table 2. Effect of transport-mode paging driver. | ||||
| Run ID | V4DVY000 | V4DVYH04 | Delta | Pct |
| CP level | 6.4.0 | 6.4.0 | ||
| Type and model | 2964-NC9 | 2964-NC9 | ||
| Processors | 8 | 8 | 0 | 0.0 |
| SYSGEN storage | 131072 | 131072 | 0 | 0.0 |
| Paging devices | 4 | 4 | 0 | 0.0 |
| ETR | 0.0442 | 0.0877 | 0.0435 | 98.4 |
| Total busy | 15.4 | 29.4 | 14.0 | 90.9 |
| Guest busy | 3.7 | 7.1 | 3.4 | 91.9 |
| Chargeable CP busy | 1.2 | 2.3 | 1.1 | 91.7 |
| Nonchargeable CP busy | 10.5 | 20.0 | 9.5 | 90.5 |
| Chargeable CP busy, /tx | 0.0271 | 0.0262 | -0.0009 | -3.3 |
| Nonchargeable CP busy, /tx | 0.2376 | 0.2281 | -0.0095 | -4.0 |
| Pages written to DASD, /sec | 44459 | 87857 | 43398 | 97.6 |
| Pages read from DASD, /sec | 44466 | 87896 | 43430 | 97.7 |
| Paging SSCH insts, /sec | 1578 | 3172 | 1594 | 101.0 |
| Page read blocking | 38 | 39 | 1 | 2.6 |
| Page write blocking | 32 | 32 | 0 | 0.0 |
| Page slot utilization, % | 15 | 29 | 14 | 93.3 |
| DASD connect time, /IO, ms | 1.970 | 0.965 | -1.005 | -51.0 |
| DASD disconnect time, /IO, ms | 0.006 | 0.007 | 0.001 | 16.7 |
| DASD pending time, /IO, ms | 0.139 | 0.138 | -0.001 | -0.7 |
| DASD service time, /IO, ms | 2.110 | 1.110 | -1.000 | -47.4 |
| Notes: z13, dedicated 8-core, non-SMT, 128 GB central. DS8800 with single LCU containing four DASD volumes holding paging extents, eight VIRSTOEX users, virtual uniprocessor, configured to page heavily. | ||||
The transport-mode I/O driver showed a 98.4% ETR increase over the command-mode I/O driver. The DASD service time decreased 47.4% allowing the paging subsystem to do twice as many I/Os per second.
HyperPAV Alias Paging Measurement
Table 3 reports the result of the HyperPAV alias measurement.
| Table 3. Effect of using HyperPAV aliases for paging. | ||||
| Run ID | V4DVY000 | V4DVYA00 | Delta | Pct |
| CP level | 6.4.0 | 6.4.0 | ||
| Type and model | 2964-NC9 | 2964-NC9 | ||
| Processors | 8 | 8 | 0 | 0.0 |
| SYSGEN storage | 131072 | 131072 | 0 | 0.0 |
| Paging devices | 4 | 4 | 0 | 0.0 |
| Paging aliases | 0 | 8 | 8 | - |
| ETR | 0.0442 | 0.0628 | 0.0186 | 42.1 |
| Total busy | 15.4 | 29.5 | 14.1 | 91.6 |
| Guest busy | 3.7 | 7.1 | 3.4 | 91.9 |
| Chargeable CP busy | 1.2 | 2.3 | 1.1 | 91.7 |
| Nonchargeable CP busy | 10.5 | 20.1 | 9.6 | 91.4 |
| Chargeable CP busy, /tx | 0.0271 | 0.0263 | -0.0008 | -3.0 |
| Nonchargeable CP busy, /tx | 0.2376 | 0.2297 | -0.0079 | -3.3 |
| Pages written to DASD, /sec | 44459 | 62640 | 18181 | 40.9 |
| Pages read from DASD, /sec | 44466 | 62674 | 18208 | 40.9 |
| Page read blocking | 38 | 39 | 1 | 2.6 |
| Page write blocking | 32 | 32 | 0 | 0.0 |
| Page slot utilization, % | 15 | 21 | 6 | 40.0 |
| DASD connect time, /IO, ms | 1.970 | 4.580 | 2.610 | 132.5 |
| DASD disconnect time, /IO, ms | 0.006 | 0.001 | -0.005 | -83.3 |
| DASD pending time, /IO, ms | 0.139 | 0.203 | 0.064 | 46.0 |
| DASD service time, /IO, ms | 2.110 | 4.780 | 2.670 | 126.5 |
| Notes: z13, dedicated 8-core, non-SMT, 128 GB central. DS8800 with single LCU containing four DASD volumes holding paging extents, eight VIRSTOEX users, virtual uniprocessor, configured to page heavily. | ||||
Adding eight aliases and enabling them for use by the paging subsystem improved ETR 42.1%.
The data below shows the experience for a single paging volume in each measurement. Adding aliases resulted in the I/O rate to the volume (T_IOR) increasing and volume percent busy (T_PBSY) increasing. Alias contribution can cause a volume's percent busy to exceed 100%. The queue on the base device (B_QD) did not go to zero because the workload has latent demand.
V4DVY000:
RDEV ___Interval_End____ ___B_QD___ __T_IOR___ __T_PBSY__
BE00 2016-09-14_16:12:10      3.267      408.5       85.3
BE00 2016-09-14_16:12:40      3.933      392.1       84.9
BE00 2016-09-14_16:13:10      3.600      393.3       85.1
BE00 2016-09-14_16:13:40      3.067      395.1       84.9
BE00 2016-09-14_16:14:10      2.200      393.7       85.1
BE00 2016-09-14_16:14:40      3.600      391.6       85.1
BE00 2016-09-14_16:15:10      1.733      394.0       84.5
V4DVYA00:
RDEV ___Interval_End____ ___B_QD___ __T_IOR___ __T_PBSY__
BE00 2016-09-14_19:06:44      2.067      555.6      267.2
BE00 2016-09-14_19:07:14      2.000      556.3      270.4
BE00 2016-09-14_19:07:44      2.733      556.1      273.3
BE00 2016-09-14_19:08:14      3.133      552.9      269.2
BE00 2016-09-14_19:08:44      2.267      557.9      272.4
BE00 2016-09-14_19:09:14      2.000      552.0      271.6
BE00 2016-09-14_19:09:44      1.667      557.4      267.7
HyperPAV Alias Paging DASD Reduction Measurement
Table 4 reports the result of the HyperPAV alias DASD reduction measurement.
| Table 4. Effect of using aliases to reduce paging volume count. | ||||
| Run ID | V8DVY000 | V4DVYA40 | Delta | Pct |
| CP level | 6.4.0 | 6.4.0 | ||
| Type and model | 2964-NC9 | 2964-NC9 | ||
| Processors | 8 | 8 | 0 | 0.0 |
| SYSGEN storage | 131072 | 131072 | 0 | 0.0 |
| Paging devices | 8 | 4 | -4 | -50.0 |
| ETR | 0.0578 | 0.0591 | 0.0013 | 2.2 |
| Total busy | 19.6 | 20.3 | 0.7 | 3.6 |
| Guest busy | 4.7 | 4.8 | 0.1 | 2.1 |
| Chargeable CP busy | 1.5 | 1.6 | 0.1 | 6.7 |
| Nonchargeable CP busy | 13.4 | 13.9 | 0.5 | 3.7 |
| Chargeable CP busy, /tx | 0.0260 | 0.0271 | 0.0011 | 4.2 |
| Nonchargeable CP busy, /tx | 0.2318 | 0.2352 | 0.0034 | 1.5 |
| Pages written to DASD, /sec | 57921 | 59243 | 1322 | 2.3 |
| Pages read from DASD, /sec | 57957 | 59268 | 1311 | 2.3 |
| Page slot utilization, % | 10 | 21 | 11 | 110.0 |
| Notes: z13, dedicated 8-core, non-SMT, 128 GB central. DS8800 with single LCU containing four DASD volumes holding paging extents, eight VIRSTOEX users, virtual uniprocessor, configured to page heavily. | ||||
Reducing the paging devices by four and replacing them with four HyperPAV aliases yielded an ETR within run variation. Paging slot utilization increased 110% because there are fewer physical volumes and the same amount of pages on them.
Transport-Mode Paging Driver and HyperPAV Alias Paging Measurement
Table 5 reports the result of the HyperPAV alias and transport-mode measurement.
| Table 5. Effect of transport-mode and HyperPAV aliases for paging. | ||||
| Run ID | V4DVX001 | V4DYA001 | Delta | Pct |
| CP level | 6.3.0 | 6.4.0 | ||
| Type and model | 2964-NC9 | 2964-NC9 | ||
| Processors | 8 | 8 | 0 | 0.0 |
| SYSGEN storage | 131072 | 131072 | 0 | 0.0 |
| Paging devices | 4 | 4 | 0 | 0.0 |
| ETR | 0.0310 | 0.1037 | 0.0727 | 234.5 |
| Total busy | 12.0 | 35.3 | 23.3 | 194.2 |
| Guest busy | 2.5 | 8.4 | 5.9 | 236.0 |
| Chargeable CP busy | 1.1 | 2.7 | 1.6 | 145.5 |
| Nonchargeable CP busy | 8.4 | 24.2 | 15.8 | 188.1 |
| Chargeable CP busy, /tx | 0.0355 | 0.0260 | -0.0095 | -26.8 |
| Nonchargeable CP busy, /tx | 0.2710 | 0.2334 | -0.0376 | -13.9 |
| Pages written to DASD, /sec | 31985 | 103704 | 71719 | 224.2 |
| Pages read from DASD, /sec | 32027 | 103740 | 71713 | 223.9 |
| Paging SSCH insts, /sec | 1487 | 1752 | 265 | 17.8 |
| Page read blocking | 28 | 39 | 11 | 39.3 |
| Page write blocking | 27 | 32 | 5 | 18.5 |
| Page slot utilization, % | 11 | 34 | 23 | 209.1 |
| DASD connect time, /IO, ms | 2.250 | 1.830 | -0.420 | -18.7 |
| DASD disconnect time, /IO, ms | 0.019 | 0.006 | -0.013 | -68.4 |
| DASD pending time, /IO, ms | 0.135 | 0.157 | 0.022 | 16.3 |
| DASD service time, /IO, ms | 2.400 | 2.000 | -0.400 | -16.7 |
| Notes: z13, dedicated 8-core, non-SMT, 128 GB central. DS8800 with single LCU containing four DASD volumes holding paging extents, eight VIRSTOEX users, virtual uniprocessor, configured to page heavily. | ||||
The transport-mode I/O driver with aliases enabled for use by the paging subsystem yielded the best result in the study. ETR increased 234.5% when compared to z/VM 6.3.
HyperPAV Alias Sharing Measurement
Table 6 reports the result of the set of alias sharing measurements.
| Table 6. Effect of SET CU Command on Hybrid Workload. | |||||
| Run Name | Alias share ratio MDISK:PAGING | Mdisk ETR | Paging ETR | MDISK Avg Aliases In Use | Paging Avg Aliases In Use |
| QRBKW048 | 15:1 | 35904 | 31667 | 14.98 | 1.01 |
| QRBKW049 | 14:2 | 32992 | 43333 | 13.98 | 2.01 |
| QRBKW050 | 13:3 | 30592 | 50943 | 12.98 | 3.01 |
| QRBKW051 | 12:4 | 28640 | 54446 | 11.98 | 4.01 |
| QRBKW052 | 11:5 | 26272 | 62229 | 10.99 | 5.01 |
| QRBKW053 | 10:6 | 24096 | 66212 | 9.99 | 6.00 |
| QRBKW054 | 9:7 | 22400 | 67209 | 8.99 | 7.00 |
| QRBKW055 | 8:8 | 20192 | 71358 | 8.00 | 7.99 |
| QRBKW056 | 7:9 | 18144 | 75481 | 7.01 | 8.98 |
| QRBKW057 | 6:10 | 16288 | 79300 | 6.03 | 9.96 |
| QRBKW058 | 5:11 | 14400 | 83013 | 5.07 | 10.93 |
| QRBKW059 | 4:12 | 12768 | 86452 | 4.12 | 11.88 |
| QRBKW060 | 3:13 | 11136 | 90317 | 3.19 | 12.81 |
| QRBKW061 | 2:14 | 9760 | 93130 | 2.29 | 13.71 |
| QRBKW062 | 1:15 | 8448 | 98224 | 1.47 | 14.53 |
| Notes: z13, dedicated 4-core LPAR, non-SMT, 8 GB central. z/VM 6.4 plus VM65886. DS8800 with single LCU containing four DASD volumes holding minidisks, two DASD volumes holding paging extents, and sixteen HyperPAV aliases. Thirty-two IO3390 users, virtual uniprocessor, protected by SET RESERVED. Twelve VIRSTOCX users, virtual uniprocessor, configured to page heavily. | |||||
The results above show the following:
-
As alias entitlement moved
away from minidisk I/O and
toward paging I/O,
two things happened:
- For the minidisk workload, its use of aliases decreased and its ETR decreased;
- For the paging workoad, its use of aliases increased and its ETR increased.
- In the first few runs, where both kinds of I/O had alias demands exceeding their entitlements, CP distributed the alias use according to the CU share settings. Each of the two types of I/O was permitted to use only the number of aliases prescribed by its entitlement.
- In the last few runs, where paging I/O wanted aliases but did not quite want its entitlement thereof and minidisk I/O still wanted all the alias power the alias scheduler would let it use, CP let minidisk I/O use the aliases paging I/O did not want.
Figure 1 plots the scaled ETRs of the minidisk I/O and paging I/O portions of the workload. IBM scaled each portion's ETR according to the ETR the portion achieved when it had entitlement for only one alias. By scaling the ETRs IBM has made it easy for a single graph to demonstrate that as aliases moved from paging to minidisk, the minidisk ETR increased and the paging ETR decreased.
| Figure 1. z13, HyperPAV alias hybrid workload. Relative ETR as f(MDISK-alias-share). |
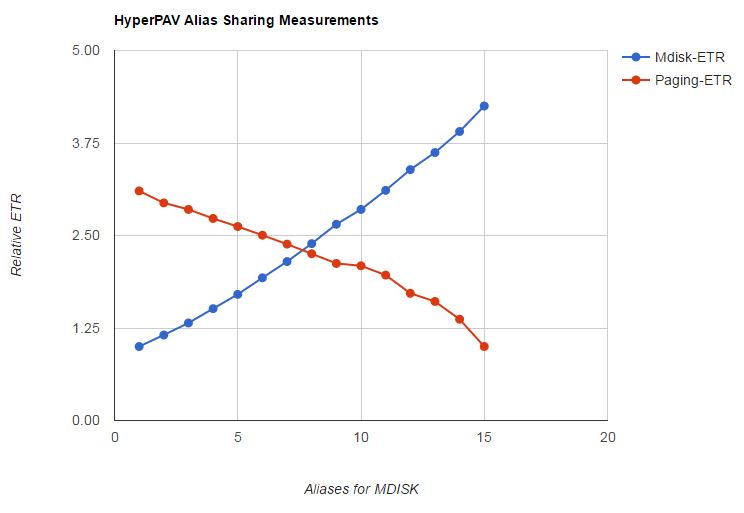
|
Summary and Conclusions
For amenable z/VM paging workloads, paging subsystem enhancements provided with z/VM 6.4 can result in increased throughput and/or the equivalent throughput with fewer physical volumes.
For the alias-sharing support, when demand for aliases exceeds availability, CP shares the aliases correctly between minidisk I/O and paging I/O. To move the power of the aliases between a minidisk-intensive workload and a paging-intensive workload, the administrator can issue the CP SET CU command to change the alias share settings.
Back to Table of Contents.
CP Scheduler Improvements
Abstract
In July 2014 in APAR VM65288 a customer reported the z/VM Control Program did not enforce relative CPU share settings correctly in a number of scenarios. IBM answered the APAR as fixed-if-next, aka FIN. In z/VM 6.4 IBM addressed the problem by making changes to the z/VM scheduler. The changes solved the problems the customer reported. The changes also repaired a number of other scenarios IBM discovered were failing on previous releases. This article presents an assortment of such scenarios and illustrates the effect of the repairs.
Introduction
In July 2014 in APAR VM65288 a customer reported the z/VM Control Program (CP) did not enforce relative CPU share settings correctly in a number of scenarios. Some of the scenarios were cases in which each guest wanted as much CPU power as CP would let it consume. All CP had to do was to hand out the CPU power in proportion to the share settings. Other scenarios involved what is called excess power distribution, which is what CP must accomplish when some guests want less CPU power than their share settings will let them consume while other guests want more CPU power than their share settings will let them consume. In such scenarios CP must distribute the unconsumed entitlement to the aspiring overconsumers in proportion to their shares with respect to each other.
To solve the problem IBM undertook a study of the operation of the CP scheduler, with focus on how CP maintains the dispatch list. For this article's purposes we can define the dispatch list to be the ordered list of virtual machine definition blocks (VMDBKs) representing the set of virtual CPUs that are ready to be run by CP. The order in which VMDBKs appear on the dispatch list reflects how urgent it is for CP to run the corresponding virtual CPUs so as to distribute CPU power according to share settings. VMDBKs that must run very soon are on the front of the list, while VMDBKs that must endure a wait appear farther down in the list.
The study of how the dispatch list was being maintained revealed CP's algorithms failed to keep the dispatch list in the correct order. One problem found was that CP was never forgetting the virtual CPUs' CPU consumption behavior from long ago; rather, CP kept track of the relationship since logon between the virtual CPU's entitlement to CPU power and its consumption thereof. Another problem found was that the virtual CPUs' entitlements were being calculated over only the set of virtual CPUs present on the dispatch list. As dispatch list membership changed, the entitlements for the members on the dispatch list were not being recalculated and so the VMDBKs' placements in the dispatch list were wrong. Another problem found was that certain heuristics, rather than mathematically justifiable algorithms, were being used to try to adjust or correct VMDBKs' relationships between entitlement and consumption when it seemed the assessment of the relationship was becoming extreme. Another problem found was that the CPU consumption limit for relative limit-shares was not being computed correctly. Still another problem found was that a normalizing algorithm meant to correct entitlement errors caused by changes in dispatch list membership was not having the intended effect.
In its repairs IBM addressed several of the problems it found. The repairs consisted of improvements that could be made without imposing the computational complexity required to keep the dispatch list in exactly the correct order all the time. In this way IBM could improve the behavior of CP without unnecessarily increasing the CPU time CP itself would spend doing scheduling.
Background
In any system consisting of a pool of resource, a resource controller or arbiter, and a number of consumers of said resource, ability to manage the system effectively depends upon there being reliable policy controls whose purpose is to inform the arbiter of how to make compromises when there is more demand for resource than there is resource available to be doled out. For example, when there is a shortage of food, water, or gasoline, rationing rules specify how the controlling authority should hand out those precious commodities to the consumers.
A z/VM system consists of a number of CPUs and a number of users wanting to consume CPU time. The first basic rule for CPU consumption in z/VM is this: for as long as there is enough CPU capacity available to satisfy all users, CP does not restrict, limit, or ration the amount of CPU time the respective users are allowed to consume. The second basic rule for CPU consumption in z/VM is this: when the users want more CPU time than the system has available to distribute, policy expressed in the form of share settings informs CP about how to make compromises so as to ration the CPU time to the users in accordance with the administrator's wishes.
z/VM share settings come in two flavors. The first, absolute share, expresses a user's ration as a percent of the capacity of the system. For example, in a system consisting of eight logical CPUs, a user having an ABSOLUTE 30% share setting should be permitted to run (800 x 0.30) = 240% busy whenever it wants, no matter what the other users' demands for CPU are. In other words, this user should be permitted to consume 2.4 engines' worth of power whenever it desires. The second, relative share, expresses a user's ration relative to other users. For example, if two users have RELATIVE 100 and RELATIVE 200 settings respectively, when the system becomes CPU-constrained and those two users are competing with one another for CPU time, CP must ration CPU power to those users in ratio 1:2.
Share settings are the inputs to the calculation of an important quantity called CPU entitlement. Entitlement expresses the amount of CPU power a user will be permitted to consume whenever it wants. Entitlement is calculated using the system's capacity and the share settings of all the users. Here is a simple example that introduces the principles of the entitlement calculation:
- Suppose the system consists of six logical CPUs, so its capacity is 600%.
- Suppose user UA has a share setting of ABSOLUTE 15%. This share setting means user UA can run (600 x 0.15) = 90% busy whenever it wants.
- The system's promise of 90% to user UA leaves the system with (600-90) = 510% with which to make promises to the other users.
- If we further have users UR1, UR2, and UR3 with
share settings RELATIVE 100, RELATIVE 200, and RELATIVE
300 respectively, those three users' guarantees for,
or entitlements to, CPU power will go like this:
- UR1: 510 x 100/600 = 85%
- UR2: 510 x 200/600 = 170%
- UR3: 510 x 300/600 = 255%
Users' actual CPU consumptions are sometimes below their entitlements. Users who consume below their entitlements leave excess power that can be distributed to users who want to consume more than their entitlements. The principle of excess power distribution says that the power surplus created by underconsuming users should be available to aspiring overconsumers according to their share settings with respect to each other. For example, if we have a RELATIVE 100 and a RELATIVE 200 user competing to run beyond their own entitlements, whatever power the underconsuming users left fallow should be made available to those two overconsumers in a ratio of 1:2.
In addition to letting a system administrator express an entitlement policy, z/VM also lets the administrator specify a limiting policy. By limiting policy we mean z/VM lets the administrator specify a cap, or limit, for the CPU time a user ought to be able to consume, and further, the conditions under which the cap ought to be enforced. The size of the cap can be expressed in either ABSOLUTE or RELATIVE terms; the expression is resolved to a CPU consumption value using the entitlement calculation as illustrated above. The enforcement condition can be either LIMITSOFT or LIMITHARD. The former, LIMITSOFT, expresses that the targeted user is to be held back only to the extent needed to let other users have more power they clearly want. The latter, LIMITHARD, expresses that the targeted user is to be held back no matter what.
The job of the CP scheduler is to run the users in accordance with the capacity of the system, and the users' demands for power, and the entitlements implied by the share settings, and the limits implied by the share settings. In the rest of this article we explore z/VM's behaviors along these lines.
Method
On a production system it can be very difficult to determine whether the scheduler is handing out CPU power according to share settings. The reason is this: the observers do not know the users' demands for CPU power. By demand we mean the amount of CPU power a user would consume if CP were to let the user consume all of the power it wanted. By consumption we mean the amount of CPU power the user actually consumed. Monitor measures consumption; it doesn't measure demand.
To check the CP scheduler for correct behavior it is necessary to run workloads where the users' demands for CPU power are precisely known. To that end, for this project IBM devised a scheduler testing cell consisting of a number of elements.
-
First, IBM built a means, a scripting language of sorts, for
defining a library of scheduler scenarios.
For each such scenario, the scripting language allowed
the definition of all of the following parameters of the
scenario:
- How many logical CPUs (LPUs) are in the LPAR, and what are their types? For example, the LPAR might consist of four CP LPUs, two zIIP LPUs, and three IFL LPUs.
- What is the set of users that will be running during the scenario? For example, users U1, U2, U3, and U4 might all be logged on and competing for CPU time.
- For each such user, what are its share settings for the various LPU types? For example, user U1 might have a relative 100 share on CPs, a relative 200 share on IFLs, and an absolute 30% share on zIIPs.
- For each such user, what virtual CPUs are defined for it? For example, user U1 might have a virtual CP at virtual CPU address 0 and a virtual IFL at virtual CPU address 1.
- For each such virtual CPU, what is its demand for CPU power? For example, for U1's virtual CPU 2, the virtual CPU might run to 35% busy if it could get all of the CPU power it wanted.
-
Next, IBM built a number
of scenarios for the scenario library.
The scenarios were devised
to exercise CP in a number of different
ways, for example:
- The scenarios reported in VM65288
- Scenarios in which every virtual CPU in the scenario wanted to consume as much CPU power as CP would allow, so CP ought to distribute the CPU power according to the share settings
- Scenarios in which some virtual CPUs wanted less CPU power than their share settings would permit, while other virtual CPUs wanted more, so to solve the scenario CP would have to implement excess power distribution correctly
- Scenarios that mixed relative-share users and absolute-share users
- Scenarios that exercised LIMITSOFT
- Scenarios that exercised LIMITHARD
-
Next, IBM built software that would
read a scenario definition and
calculate mathematically what the virtual CPUs'
CPU utilizations would be
if CP were to
behave exactly correctly. This program, called the solver,
used the mathematics behind the problem of excess power distribution
to do the computation.
-
Next, IBM built a CPU burner program
that could run in a virtual N-way
guest. The burner's command line would accept a description of
the virtual CPUs of the guest and the CPU utilization target it
should
try to achieve on each virtual CPU. For example, if
the guest were a virtual 2-way with one virtual CP and one
virtual IFL, the burner could be told to try to run the virtual
CP 65% busy and the virtual IFL 81% busy.
On each virtual CPU,
to achieve the utilization target
the burner used a combination of
a spin loop, plus
calls to Diag x'0C', plus
the clock comparator.
-
Next, IBM built software that would
read a scenario definition and
instantiate the problem on an LPAR:
configure the LPAR with the correct numbers and types of logical CPUs,
log on all of the scenario's users,
define for each user its prescribed virtual CPUs,
issue for each user its prescribed CP SET SHARE commands, and
set each user in motion running the CPU burner according to
the CPU utilization targets specified for the user's
virtual CPUs.
This program, called the runner,
also included job steps
to start and stop MONWRITE, and
to run Perfkit to reduce the MONWRITE file, and
to mine the Perfkit listing so
as to extract the actual CPU consumptions of the virtual CPUs
comprising the scenario.
-
Last, IBM built software
for comparing the correct answers
calculated by the solver to
the observed behaviors produced
by the runner.
This program, called the comparator,
was able to form a scalar expression of the error CP
committed during the running of the scenario.
The scalar error
was calculated by treating
the solver's correct answer and
the runner's observed result
each as an N-dimensional vector,
where each dimension expressed the CPU consumption of one of
the N virtual CPUs of the measurement.
The N-dimensional vector drawn
from the tip of the correct result's vector
to the tip of the
observed result's vector,
called the error vector, represents the error CP
committed in the running of the scenario.
The CP error was then quantified
as the
magnitude of the error vector divided by the magnitude
of the correct answer vector.
The magnitudes of the correct answer vector
and the error vector
were calculated
using the Cartesian
distance formula for N dimensions.
Figure 1 illustrates the error calculation for an experiment using two virtual CPUs. The correct utilizations and observed utilizations appear in the table on the left of the figure. The correct answer vector and the error vector are illustrated in the graph on the right. The run error is calculated as the magnitude of the error vector divided by the magnitude of the correct answer vector. The error is then converted to a percent by multiplying by 100. When the scenario uses more than two virtual CPUs, it becomes difficult to plot the vectors but the calculation proceeds in the same way.
Figure 1. Calculating scheduler error. 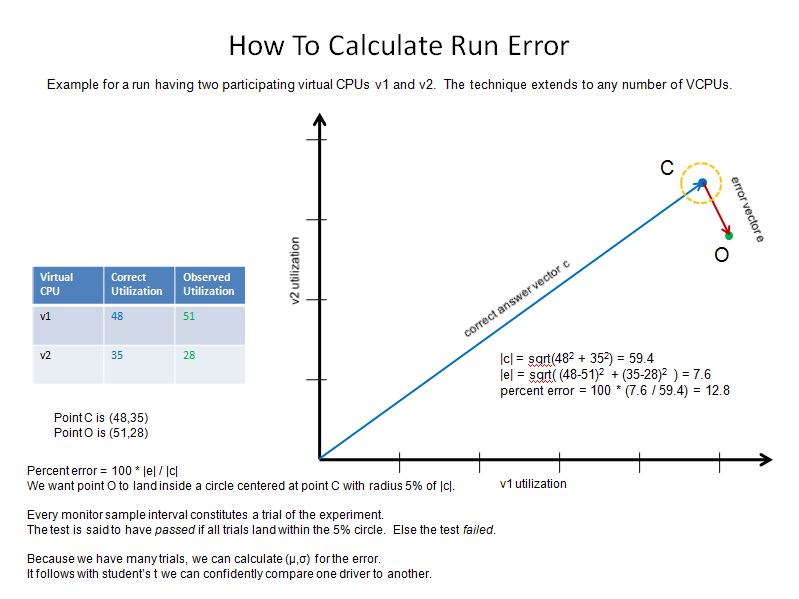
Results and Discussion
The scenario library used was too large for this report to illustrate every case. Rather for this report we have chosen an assortment of scenarios so as to illustrate results from a variety of configurations.
Infinite Demand, Equal Share
Figure 2 illustrates the scenario for the simplest problem reported in VM65288. In this scenario, which we called J1, each virtual CPU wants as much power as CP will let it consume. All CP has to do is distribute power according to the share settings. Further, the share settings are equal to one another, so all virtual CPUs should run equally busy.
| Figure 2. Scenario J1 from VM65288. Two logical CPs, four virtual uniprocessor guests, all virtual CPUs wanting infinite power, and all guests having relative 100 share on CPs. |
|
|
In such a scenario each of the four virtual CPUs should run (200/4) = 50% busy constantly. However, that is not what happened. Figure 3 illustrates the result of running scenario J1 on z/VM 6.3. The graph portrays CPU utilization as a function of time for each of the four virtual CPUs of the measurement: QGP00000.0, QGP00001.0, QGP00002.0, and QGP00003.0. The four users' CPU consumptions are not steady, and further, virtual CPU QGP00000.0 shows an excursion near the beginning of the measurement. Mean CP error was 4.76% with a max error of 23.78%. We classified this result as a failure.
| Figure 3. Scenario J1 run on z/VM 6.3 with all service closed as of November 19, 2015. Machine type is z13. |
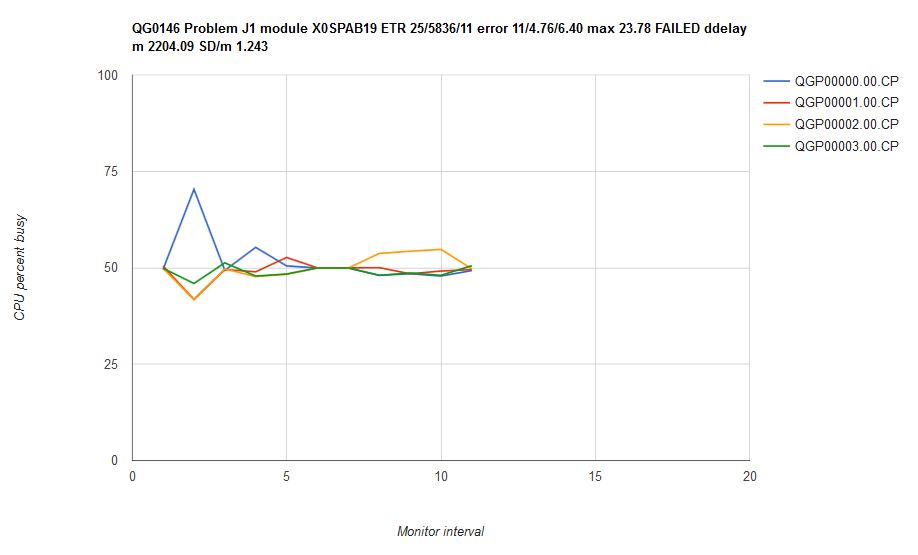
|
Figure 4 illustrates what happened when we ran scenario J1 on an internal CP driver containing the scheduler fixes. Each of the four virtual CPUs runs with 50% utilization, and further, the utilizations are all constant over time. Mean CP error was 0.26% with a max error of 0.58%. We classified this result as a success.
| Figure 4. Scenario J1 run on internal driver CPL50X8D which contains the scheduler repairs. Machine type is z13. |
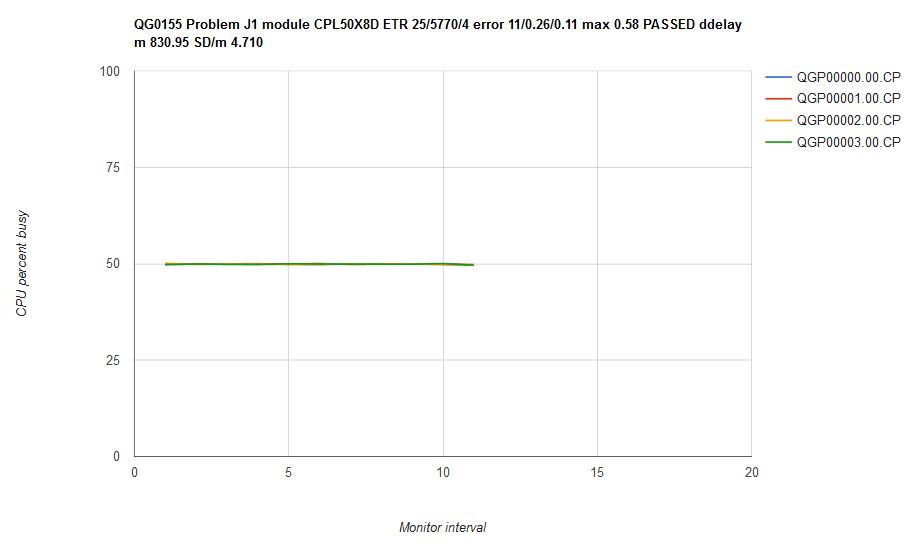
|
A side effect of repairing the scheduler was that the virtual CPUs' dispatch delay (on the chart title, ddelay) experience improved. In the z/VM 6.3 measurement above, virtual CPUs ready to run experienced a mean delay of 2204 microseconds between the instant they became ready for dispatch and the instant CP dispatched them. In the measurement on the internal driver, mean dispatch delay dropped to 831 microseconds. The dispatch delay measurement came from monitor fields the March 2015 SPEs added to D4 R3 MRUSEACT.
Infinite Demand, Unequal Share
Figure 5 illustrates the scenario for another problem reported in VM65288. In this scenario, which we called J2, each virtual CPU wants as much power as CP will let it consume. All CP has to do is distribute power according to the share settings. Unlike J1, though, the share settings are unequal. In this case CP should distribute CPU power in proportion to the share settings.
| Figure 5. Scenario J2 from VM65288. Two logical CPs, four virtual uniprocessor guests, all virtual CPUs wanting infinite power, and the guests having unequal relative share settings. |
|
|
In such a scenario the four virtual CPUs should run with CPU utilizations in ratio of 1:2:1:4, just as their share settings are. However, that is not what happened. Figure 6 illustrates the result of running scenario J2 on z/VM 6.3. The four users' CPU consumptions are not steady, and further, the consumptions are out of proportion. Mean CP error was 27.1% with a max error of 41.4%. We classified this result as a failure.
| Figure 6. Scenario J2 run on z/VM 6.3 with all service closed as of November 19, 2015. Machine type is z13. |
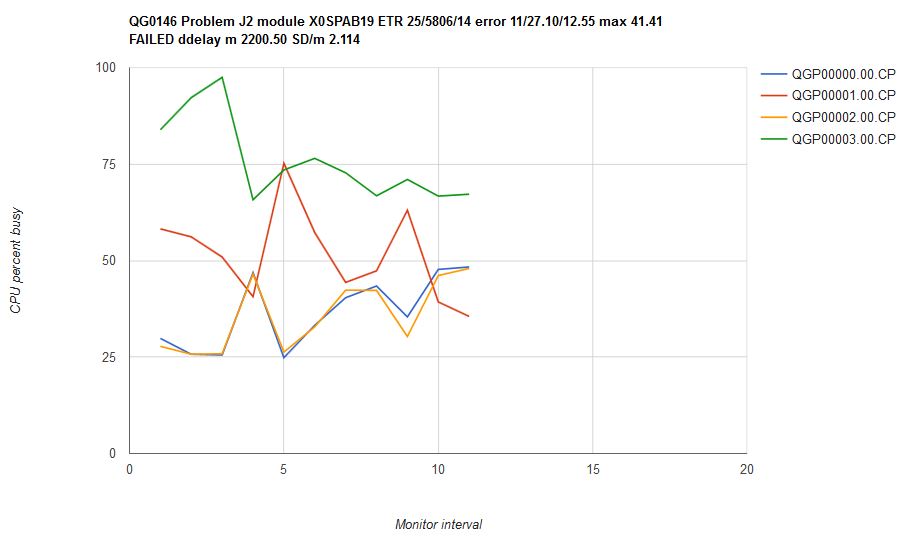
|
Figure 7 illustrates what happened when we ran scenario J2 on an internal CP driver containing the scheduler fixes. The CPU consumptions are steady over time and are in correct proportion. Mean CP error was 1.58% with a max error of 1.81%. We classified this result as a success.
| Figure 7. Scenario J2 run on internal driver CPL50X8D which contains the scheduler repairs. Machine type is z13. |
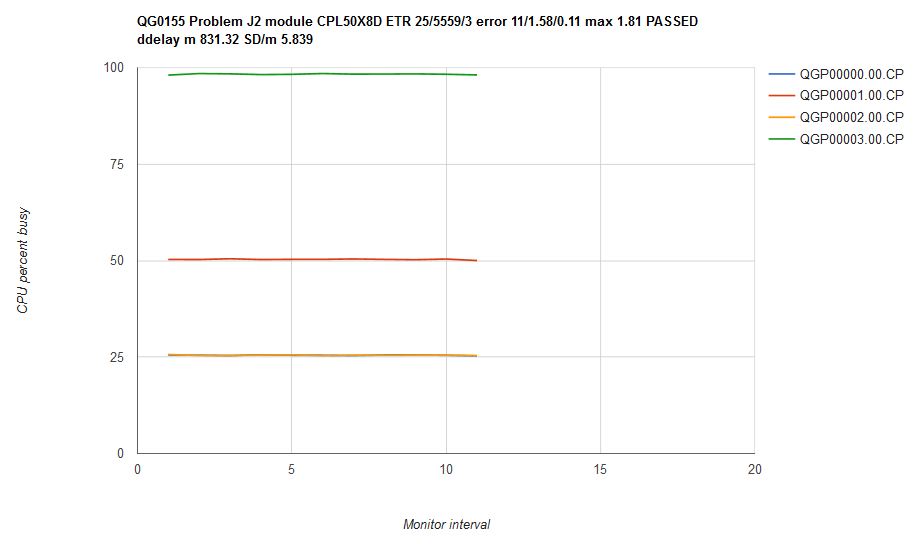
|
Donors and Recipients, Unequal Shares
Figure 8 illustrates a scenario inspired by what we saw reported in VM65288. In this scenario, which we called J3, some virtual CPUs, called donors, require less CPU time than their entitlements assure them. Further, other virtual CPUs, called recipients, have infinite demand. To behave correctly CP must distribute the donor users' unconsumed entitlement to the aspiring overconsumers in proportion to their share settings with respect to each other. In other words, CP must correctly implement the principle of excess power distribution.
| Figure 8. Scenario J3 inspired by VM65288. Two logical CPs, six virtual uniprocessor guests, some virtual CPUs wanting infinite power, and other virtual CPUs wanting less power than that to which they are entitled. Share settings vary. |
|
|
Unlike in the previous scenarios, the correct answer for scenario J3 isn't easily computed mentally. This is where we made use of the solver. Figure 9 illustrates the solver's output for scenario J3. The solver implements the mathematics of excess power distribution to calculate what CP's behavior ought to be.
| Figure 9. Scenario J3 solution computed by the solver. |
|
Figure 10 illustrates what happened when we ran scenario J3 on z/VM 6.3. The CPU consumptions are unsteady over time and are not in correct proportion. Mean CP error was 20.29% with a max error of 32.02%. We classified this result as a failure.
| Figure 10. Scenario J3 run on z/VM 6.3 with all service closed as of November 19, 2015. Machine type is z13. |
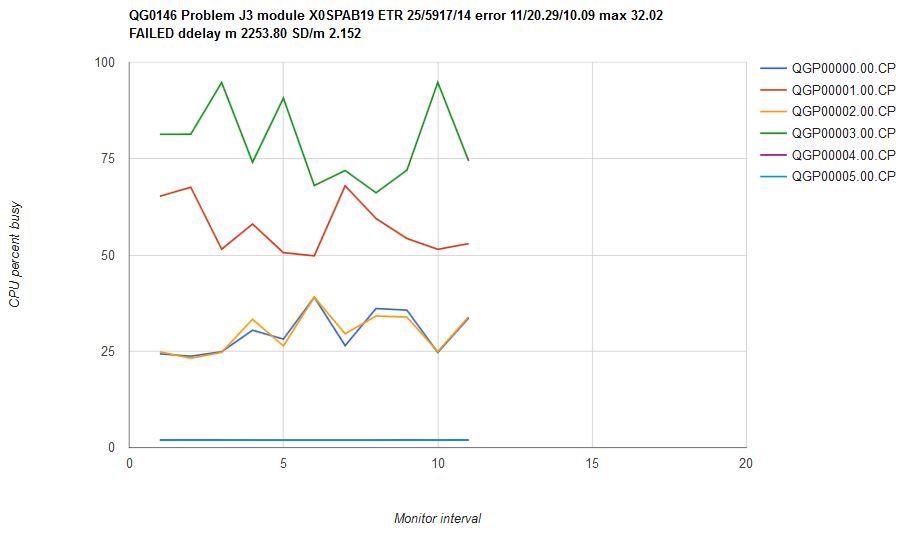
|
Figure 11 illustrates what happened when we ran scenario J3 on an internal CP driver containing the scheduler fixes. The CPU consumptions are steady over time and are in correct proportion. Mean CP error was 1.59% with a max error of 1.90%. We classified this result as a success.
| Figure 11. Scenario J3 run on internal driver CPL50X8D which contains the scheduler repairs. Machine type is z13. |
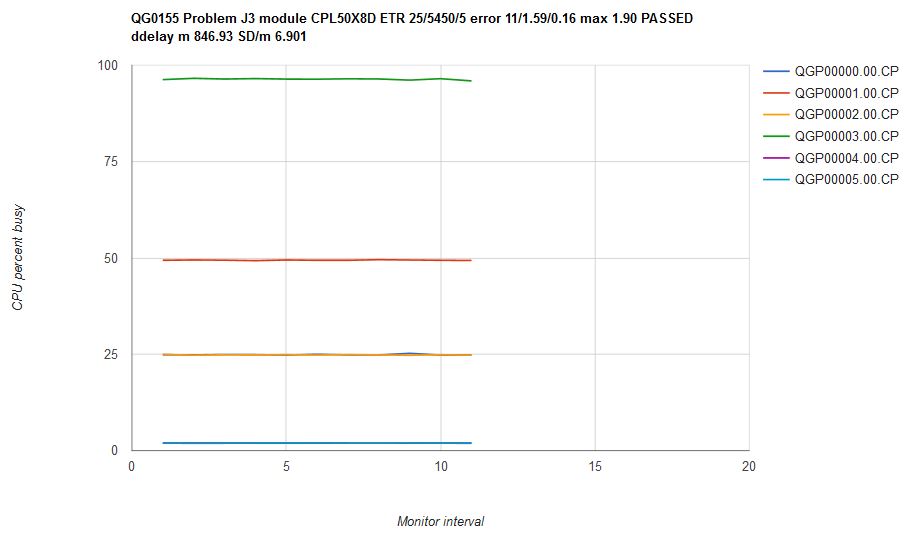
|
More Donors, More Recipients, and Unequal Shares
Figure 12 illustrates scenario MZ0 that is a more complex variant of scenario J3. Here there are more donors and more recipients. Also, the scenario runs on the zIIPs of a mixed-engine LPAR. Again, to run this scenario CP must correctly implement the principle of excess power distribution.
| Figure 12. Scenario MZ0. |
|
|
As was true for J3, to see the correct answer for MZ0 we need to use the solver. Figure 13 illustrates the solver's output for scenario MZ0.
| Figure 13. Scenario MZ0 solution computed by the solver. |
|
Figure 14 illustrates what happened when we ran scenario MZ0 on z/VM 6.3. The CPU consumptions are fairly steady over time, but they are not in correct proportion. The high-entitlement users got a disproportionately large share of the excess. Mean CP error was 81.04% with a max error of 83.02%. We classified this result as a failure.
| Figure 14. Scenario MZ0 run on z/VM 6.3 with all service closed as of November 19, 2015. Machine type is z13. |
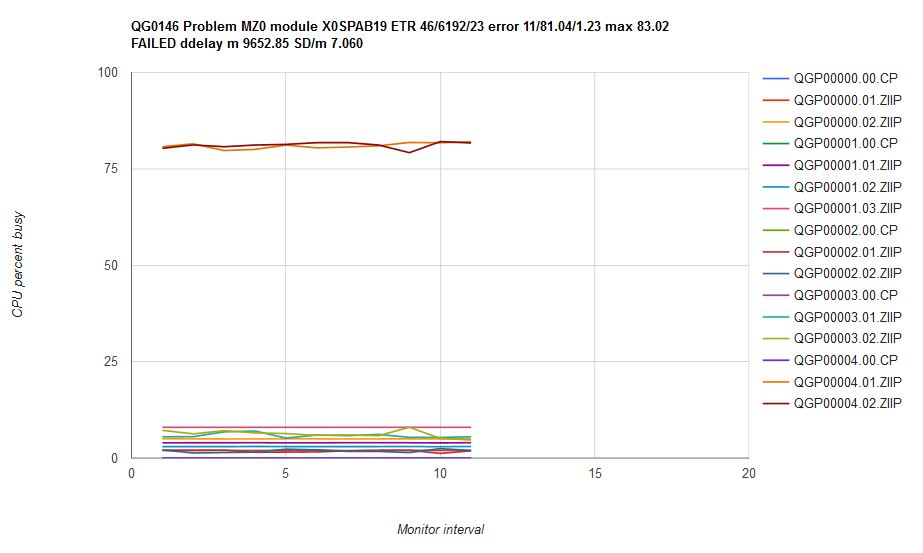
|
Figure 15 illustrates what happened when we ran scenario MZ0 on an internal CP driver containing the scheduler fixes. The CPU consumptions are fairly steady over time and are in about the correct proportion. Mean CP error was 5.17% with a max error of 6.48%. Our comparator printed "FAILED" on the graph, but given how much better the result was, we felt this was a success.
| Figure 15. Scenario MZ0 run on internal driver CPL50X8D which contains the scheduler repairs. Machine type is z13. |
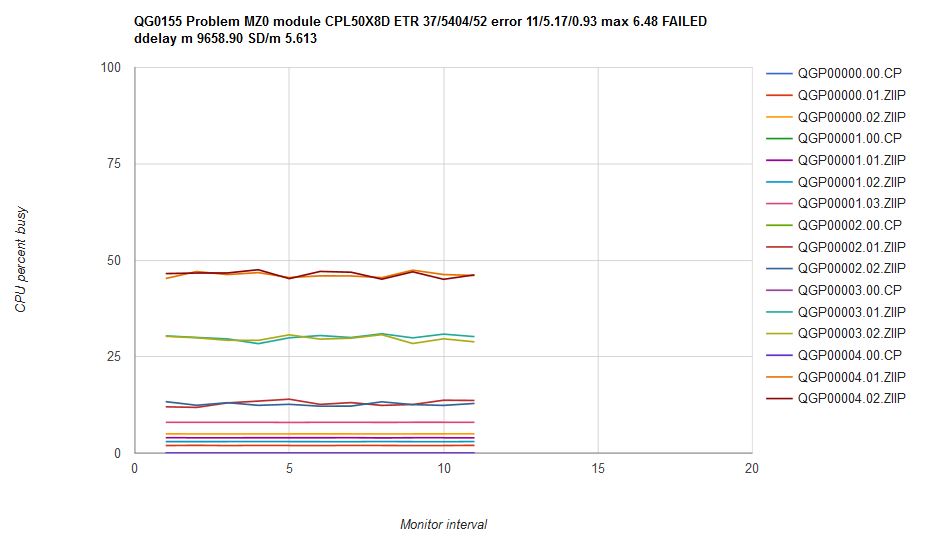
|
In studying the cause of the vibration in scenario MZ0 we decided to write an additional repair for the CP scheduler. We wrote a mathematically correct but potentially CPU-intensive modification we were certain would improve dispatch list orderings. We then ran scenario MZ0 on that experimental CP. Figure 16 illustrates what happened in that run. The CPU consumptions are steady and in correct proportion. Mean CP error was 0.88% with a max error of 0.98%. In other words, this experimental CP produced correct results. However, we were concerned the modification we wrote would not scale to systems housing hundreds to thousands of users, so we did not include this particular fix in z/VM 6.4.
| Figure 16. Scenario MZ0 run on internal driver UPDPRIO2 which contains the experimental scheduler repair. Machine type is z13. |
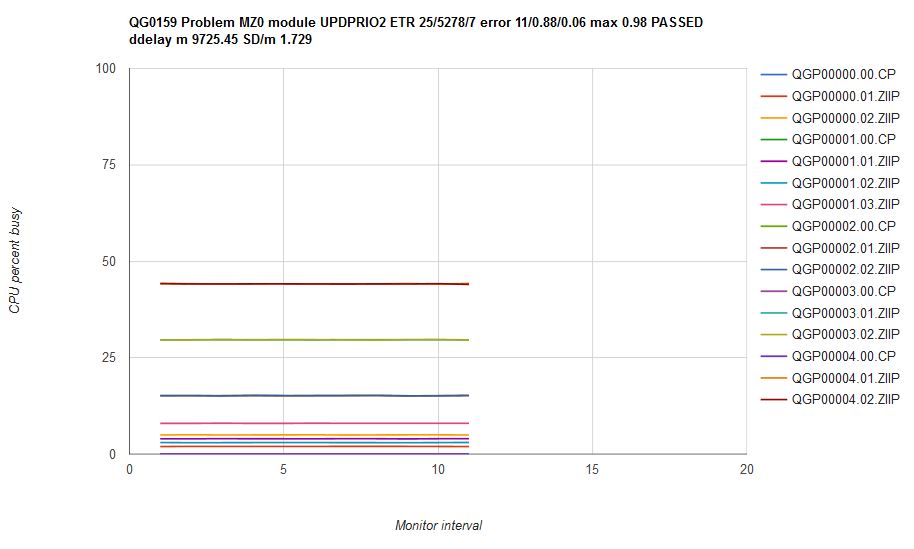
|
ABSOLUTE LIMITHARD, With a Twist
Figure 17 illustrates scenario AL1 which we wrote to check ABSOLUTE LIMITHARD. Here there are donors, recipients, and a LIMITHARD user. To run this scenario CP must hold back the LIMITHARD user to its limit and must correctly implement the principle of excess power distribution.
| Figure 17. Scenario AL1. |
|
|
The apparently correct answer for scenario AL1 is calculated like this:
- The LPAR has two logical zIIPs aka 200% capacity
- QGP00004.0 will run (200 x 0.25) = 50% busy
- This leaves (200-50) = 150% for the other three users
- QGP00001 and QGP00002 will consume (10+20) = 30%
- This leaves (150-30) = 120% for QGP00003 if it wants it
- But QGP00003 has only one virtual zIIP
- Therefore QGP00003 ought to run 100% busy
The solver found the above solution too. Figure 18 illustrates the solver's output for scenario AL1.
| Figure 18. Scenario AL1 solution computed by the solver. |
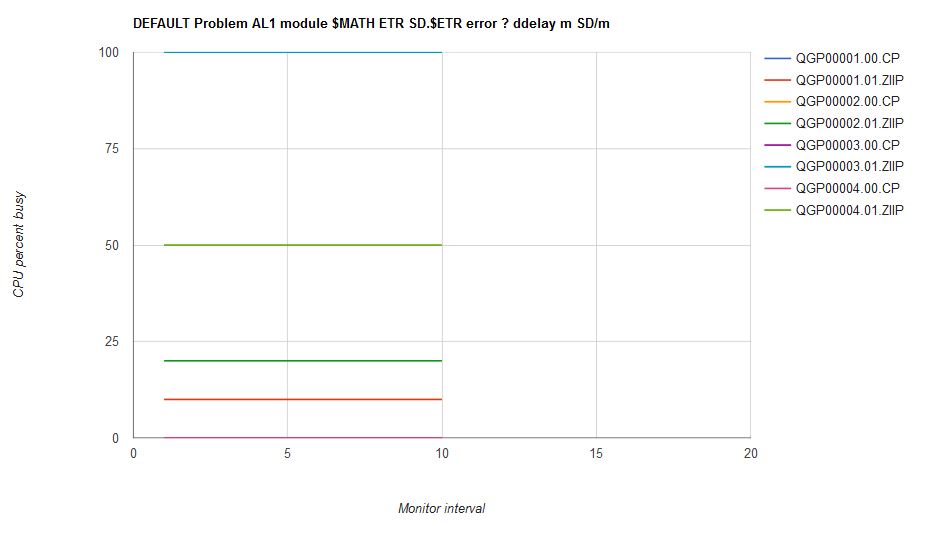
|
Figure 19 illustrates what happened when we ran scenario AL1 on an internal CP driver containing the scheduler fixes. The CPU consumptions are steady over time. Further, the two donor users and the ABSOLUTE LIMITHARD user all have correct CPU consumptions. It seems, though, there is a problem with the unlimited user. The solver calculated QGP00003 should have run 100% busy but it did not. Thus the comparator classified the run as a failure.
| Figure 19. Scenario AL1 run on internal driver CPL50X8D which contains the scheduler repairs. Machine type is z13. |
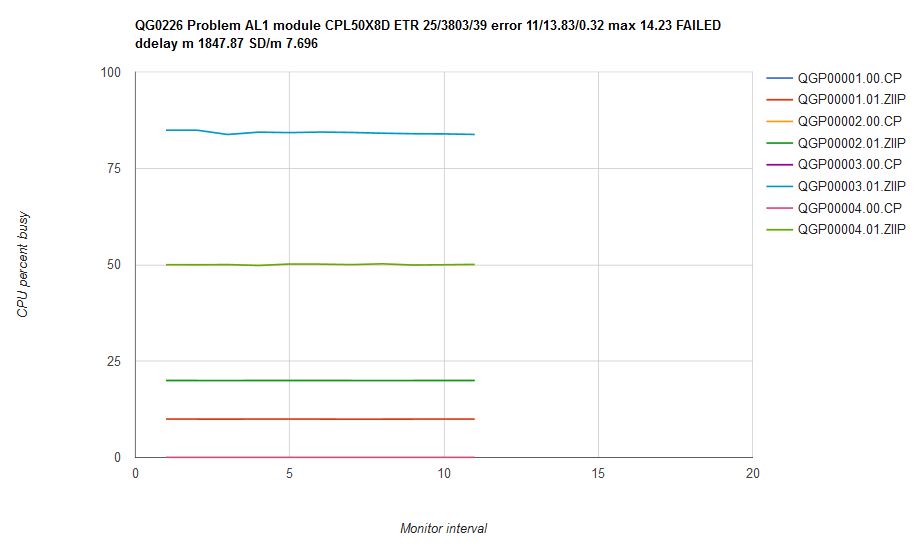
|
It took a while for us to figure out that the problem here was not that CP had run scenario AL1 incorrectly. In fact, CP had run the scenario exactly correctly; rather, it was the solver that was wrong. A basic assumption in the solver's math is that if there is more CPU power left to give away, and if there is a user who wants it, CP will inevitably give said power to said user. As we studied the result we saw said assumption is false. When there are only a few logical CPUs to use and the CPU consumptions of the virtual CPUs are fairly high, it is not necessarily true that CP will be able to give out every last morsel of CPU power to virtual CPUs wanting it. Rather, some of the CPU capacity of the LPAR will unavoidably go unused. The situation is akin to trying to put large rocks into a jar that is the size of two or three such rocks. Just because there is a little air space left in the jar does not mean one will be able to fit another large rock into the jar. The leftover jar space, the gaps between the large rocks, is unusable, even if the volume of the leftover space exceeds the volume of the desired additional rock. The same is true of the capacity of the logical CPUs in scenario AL1.
The proof of the large jar hypothesis for scenario AL1 lies in a probabilistic argument. Here is how the proof goes.
- The probabilities of the two donors and the LIMITHARD
user occupying logical CPUs are exactly their observed
CPU utilizations:
- QGP00001: p=0.10 (10% busy)
- QGP00002: p=0.20 (20% busy)
- QGP00004: p=0.50 (50% busy)
- If CP is behaving correctly, the probability that unlimited user QGP00003 is occupying a logical CPU ought to be exactly equal to the probability that CP has a logical CPU available to run it.
-
The probability that CP has a logical CPU available to run
QGP00003 is equal to 1 minus the sum of the probabilities
of the occupancy scenarios that prevent QGP00003 from running:
- QGP00001 and QGP00002: (0.10 x 0.20) = 0.02
- QGP00001 and QGP00004: (0.10 x 0.50) = 0.05
- QGP00002 and QGP00004: (0.20 x 0.50) = 0.10
- Sum = (0.10 + 0.05 + 0.02) = 0.17
- Occupancy opportunity for QGP00003 = 1 - 0.17 = 0.83
- Therefore QGP00003 ought to run 83% busy.
Some readers might notice that if the system administrator had used the CP DEDICATE command to dedicate a logical CPU to user QGP00003, CP might have satisifed all users, like so:
- QGP00003 dedicated onto logical CPU 1: 100% busy
- Users QGP00001, QGP00002, and QGP00004 sharing logical CPU 0: (10% + 20% + 50%) = 80% busy
There is an old maxim floating around the performance community. The saying goes, "When the system is not completely busy, every user must be getting all the CPU power he wants." Scenario AL1 teaches us the maxim is false. This lesson helps us to understand why in a Perfkit USTAT or USTATLOG report we might see %CPU samples even though the system is not completely busy, or why in a Perfkit PRCLOG report we might see logical CPU %Susp even though it appears the CPC has more power to give.
Notes on ETR
The CPU burner program prints a transaction rate that is proportional to the number of spin loops it accomplishes. The system's overall ETR is taken to be the sum of the users' individual transaction rates. Each of the graph titles above expresses the run's ETR in the form n/m/sd, where n is the number of samples of ETR we collected, m is the mean of the samples of ETR, and sd is the standard deviation of the samples of ETR. Readers will notice that we sometimes saw an ETR drop in z/VM 6.4 compared to z/VM 6.3. This must not be taken to be a failure of z/VM 6.4. Rather, it is inevitable that ETR will change because z/VM has changed how it distributes CPU power to the users comprising the measurement.
Notes on Dispatch Delay
In discussing the results for scenario J1 we mentioned that on z/VM 6.4 the virtual CPUs experienced reduced mean dispatch delay compared to z/VM 6.3. In surveying the results from the whole scenario library we found several scenarios experienced reduced mean delay. Figure 20 illustrates the scenarios' dispatch delay experience. Decreasing mean dispatch delay was not one of the project's formal objectives but the result was nonetheless welcome.
| Figure 20. Mean dispatch delay, z/VM 6.3 to z/VM 6.4. |
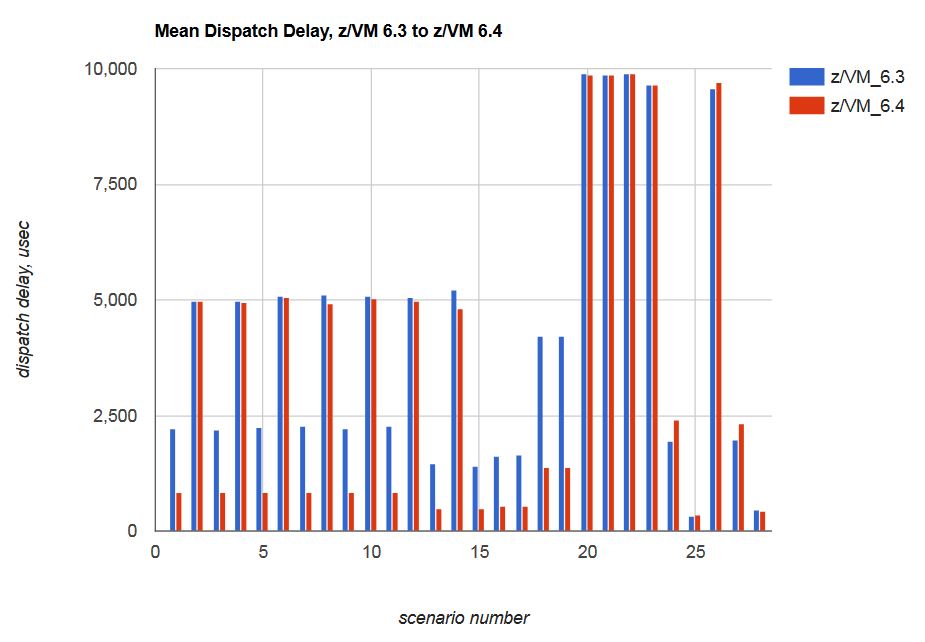
|
Remaining Problem Areas
Our scenario library included test cases that exercised share setting combinations we feel are less commonly used. We included a LIMITSOFT case and a RELATIVE LIMITHARD case. Our tests showed LIMITSOFT and RELATIVE LIMITHARD still need work.
LIMITSOFT
By LIMITSOFT we mean a consumption limit CP should enforce only when doing so lets some other user have more power. Another way to say this is that provided it wants the power, a LIMITSOFT user gets to have all of the power that remains after:
- All unlimited users consume all of the power they want, and
- All LIMITHARD users consume either their limit or all the power they want, whichever is less.
Figure 21 illustrates scenario SL3 that employs LIMITSOFT. The scenario runs on a single logical zIIP. There are three virtual CPUs: one donor, one unconstrained recipient, and one ABSOLUTE LIMITSOFT recipient.
| Figure 21. Scenario SL3, a LIMITSOFT scenario. |
|
|
We can calculate the correct answer for SL3. Here is how the calculation goes.
- The capacity of the LPAR is 100%.
- The users' entitlements are calculated using their min-shares.
- All users' min-shares are the same, RELATIVE 100.
- Therefore each user has entitlement (100/3) = 33% busy.
- Therefore donor QGP00001 will run 2% busy.
- The limit-share for user QGP00004 is ABSOLUTE 10% or (100 x 0.10) = 10% busy. Yes, this is less than its min-share entitlement of 33%, but the limit-share still governs.
- The system has 98% busy left to distribute between the unconstrained recipient and the ABSOLUTE LIMITSOFT user.
- The LIMITSOFT user QGP00004 will be held to 10% busy.
- The unconstrained recipient QGP00003 will run 88% busy.
The solver agrees. Figure 22 illustrates the solver's output for scenario SL3.
| Figure 22. Scenario SL3 solution computed by the solver. |
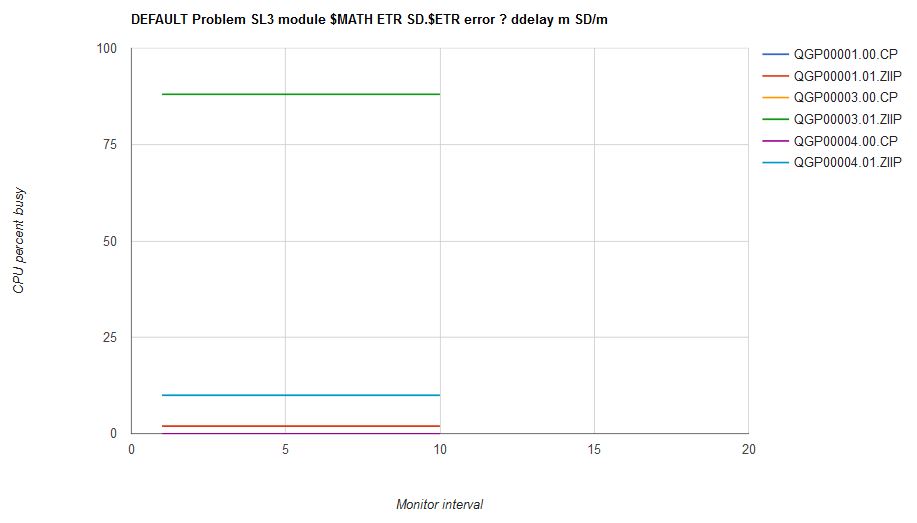
|
Figure 23 illustrates what happened when we ran scenario SL3 on an internal driver that contained the scheduler repairs.
| Figure 23. Scenario SL3 run on internal driver CPL50X8D which contains the scheduler repairs. Machine type is z13. |
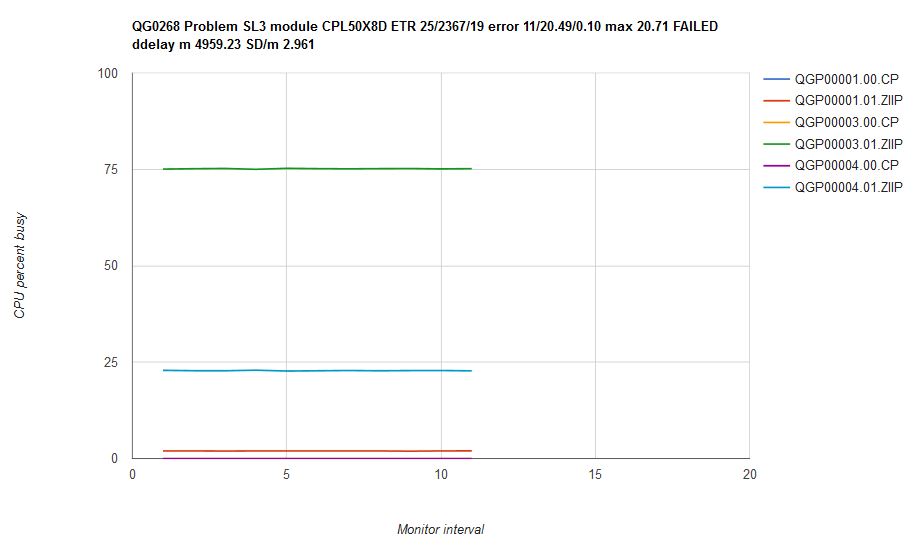
|
The LIMITSOFT user was not held back enough, and the unconstrained recipient did not get enough power.
RELATIVE LIMITHARD
Like ABSOLUTE LIMITHARD, RELATIVE LIMITHARD expresses a hard limit on CPU consumption. The difference is that the CPU consumption cap is expressed in relative-share notation rather than as a percent of the capacity of the system. As part of our work on this project we ran a simple RELATIVE LIMITHARD test to see whether CP would enforce the limit correctly.
Figure 24 illustrates scenario MR2 that employs RELATIVE LIMITHARD. The scenario runs on the logical zIIPs. There are two virtual CPUs: one that runs unconstrained and one that ought to be held back.
| Figure 24. Scenario MR2, a RELATIVE LIMITHARD scenario. |
|
|
The correct answer for scenario MR2 is calculated like this:
- The LPAR's capacity is 200%
- The sum of the relative shares relevant in the calculation of the limit for user QGP00001 is (200+50) = 250
- User QGP00001 should be limited to (200 x 50/250) = 40% busy
- The system has (200-40) = 160 capacity remaining
- User QGP00000 has only one virtual zIIP
- Therefore user QGP00000 should run 100% busy
Figure 25 shows us the solver produced the same answer:
| Figure 25. Scenario MR2 solution computed by the solver. |
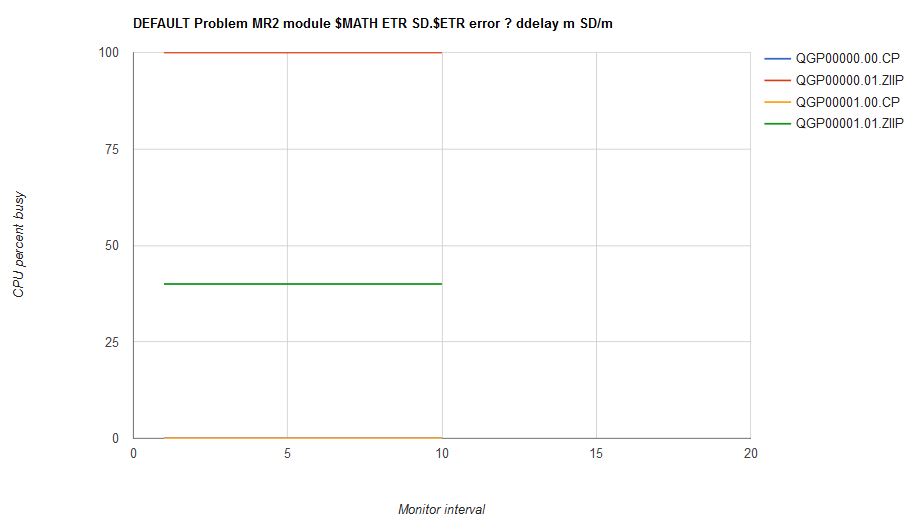
|
Figure 26 illustrates what happened when we ran scenario MR2 on an internal driver that contained the scheduler repairs.
| Figure 26. Scenario MR2 run on internal driver CPL50X8D which contains the scheduler repairs. Machine type is z13. |
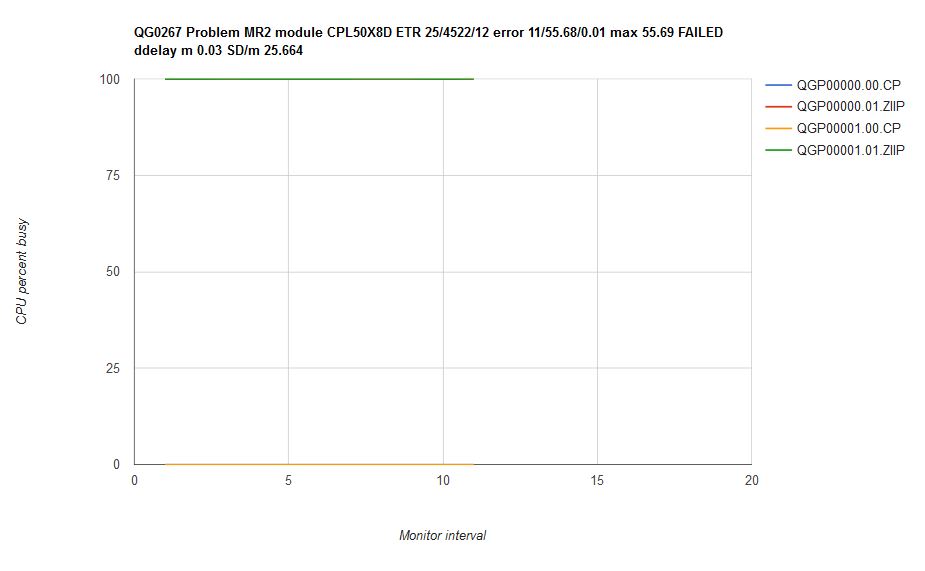
|
CP did not enforce the RELATIVE LIMITHARD limit, rather, it let user QGP00001's virtual zIIP run unconstrained.
Let's return to the hand calculation of the CPU consumption limit for scenario MR2's RELATIVE LIMITHARD user. When a user's limit-share is expressed with relative-share syntax, the procedure for calculating the CPU consumption limit is this:
- Form the set of min-share settings of all the guests. Call this set S.
- Remove from S the min-share setting for the RELATIVE LIMITHARD user.
- Add to S the limit-share setting for the RELATIVE LIMITHARD user.
- Using the adjusted set S and the usual procedure for calculating entitlement, calculate the entitlement for the RELATIVE LIMITHARD user.
- The result of the entitlement calculation is the CPU consumption limit for the RELATIVE LIMITHARD user.
For a couple of reasons, we question whether relative limit-share has any practical value as a policy knob. One reason is the complexity of the above calculation increases as the number of logged-on users increases. Another reason is that as users log on, log off, or incur changes in their share settings, the CPU consumption cap associated with the relative limit-share will change. For these reasons we feel on a large system it would be quite difficult to predict or plan the CPU utilization limit for a user whose limit-share were specified as relative. Overcoming this would require a tool such as this study's solver and would require the system administrator to run it each time his system incurred a logon, a logoff, or a CP SET SHARE command.
Mixing Share Flavors for a Single Guest
In a recent PMR IBM helped a customer to understand what was happening to a guest for which he had specified the share setting like this:
- Base case: SHARE ABSOLUTE 25%
- Comparison case: SHARE ABSOLUTE 25% RELATIVE 200 LIMITHARD
In the base case, the user consumed more than 25% of the system's capacity. In the comparison case, the user, whose demand had not changed, was being held back to less than 25% of the system's capacity.
Here is what happened. Owing to the share settings of the users on the customer's system, the limit-share setting, RELATIVE 200 LIMITHARD, calculated out to be a more restrictive policy than the min-share setting of ABSOLUTE 25%. The customer's mental model for what the command does -- which, by the way, was probably abetted by IBM's use of the phrases minimum share and maximum share in its description of the command syntax -- was that the limit-share clause of the SET SHARE command specifies a more permissive value than does the min-share clause of the command. Even though IBM calls those tokens minimum share and maximum share, the math will sometimes work out otherwise. The lesson here is to be very careful in mixing share flavors within the settings of a single guest.
Summary and Conclusions
Observing whether the scheduler is behaving correctly is very difficult on a production system. Therefore checking the scheduler requires the building of a measurement cell where all factors can be controlled.
In the scenarios of VM65288, and in several others IBM tried, z/VM 6.4 enforces share settings with less error than z/VM 6.3 did. A side effect was that dispatch delay was reduced in many of the scenarios.
The LIMITSOFT and RELATIVE LIMITHARD limiting features might fail to produce intended results in some situations.
The effect of a relative limit-share setting might be difficult to predict or to plan. Thus the practical value of relative limit-share as a policy tool is questionable.
Mixing share flavors on a single guest requires careful thought.
Back to Table of Contents.
RSCS TCPNJE Encryption
Abstract
Secure TCPNJE links for RSCS was introduced in z/VM 6.3 with the PTF for APAR VM65788. When compared to a non-secure RSCS link, transferring files across z/VM 6.3 LPARs over an RSCS link secured by TLS 1.0 and RSA_AES_256 resulted in total CPU/tx increasing by 56% for the SSL server, TCPIP, and RSCS combined.
Transferring files across z/VM LPARs in a z/VM 6.3 - TLS 1.2 - RSA_AES_128_SHA256 environment resulted in total CPU/tx decreasing by 2.1% for the SSL server when compared back to a z/VM 6.3 - TLS 1.0 - RSA_AES_256 environment.
With z/VM 6.4 the SSL default TLS protocol was increased from TLS 1.0 to TLS 1.2, the default cipher strength increased from RSA_AES_256 to RSA_AES_128_SHA256, and the System SSL level upgraded from V2.1 to V2.2. A z/VM 6.3 environment using the TLS 1.2, RSA_AES_128_SHA256 and System SSL level V2.1 experienced a slight increase in CPU/tx when upgrading to a z/VM 6.4 environment. The SSL server CPU/tx increased 6.3%.
Introduction
Encryption of TCPNJE connections was introduced in z/VM 6.3 with the PTF for APAR VM65788 which enables encrypted TCPNJE traffic over RSCS. A new TCPNJE-type link parameter called TLSLABEL has been added. This parameter specifies the label of a digital certificate that will be used to encrypt/decrypt all data flowing over the link. The same certificate label must be specified on both sides of the link. The specified certificate and its corresponding TLSLABEL must exist in the TLS/SSL server certificate database. For additional information on the TLS/SSL server and managing its certificate database refer to z/VM TCP/IP Planning and Customization.
Method
One workload was used to evaluate the CPU cost of encrypting/decypting data flowing over a secure RSCS TCPNJE link. Figure 1 shows how two LPARs were defined with a RSCS TCPNJE link. Two files were sent back and forth between USER1 located on LPAR 1 and USER2 located on LPAR 2 over the RSCS TCPNJE link. One file was a large CMS file with 1 million records and a F1024 LRECL. The second file was a small CMS file with 20 records and a F1024 LRECL. The RSCS REROUTE command was used to cause the files to bounce back and forth during the measurement. The RSCS REROUTE command instructs RSCS to reroute the files automatically once received.
When the link was started without the TLSLABEL parameter data flow did not include the SSL server. When the link was started with the TLSLABEL parameter data flowed to the SSL server for encryption/decryption processing.
The two LPARs communicated via OSA.
| Figure 1. Encryption of TCPNJE connections. |
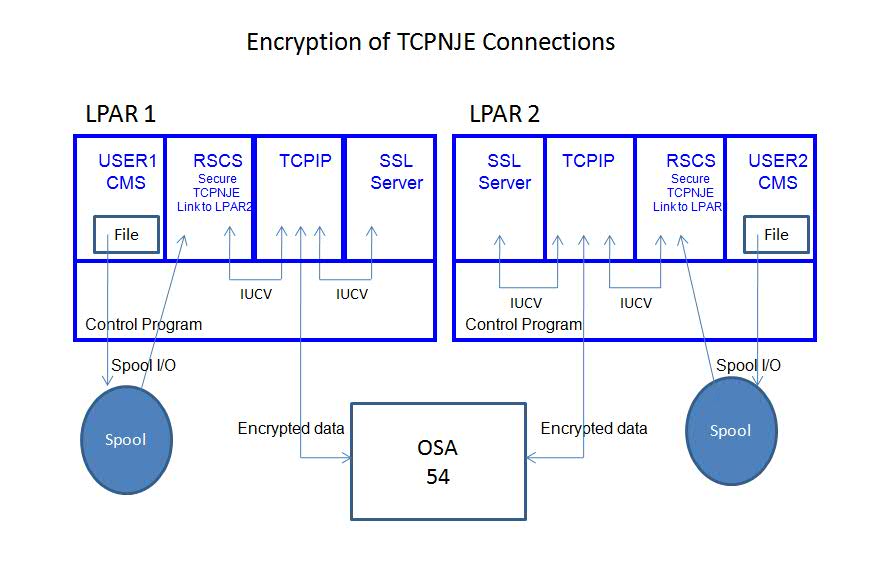
|
| Notes: Processor 2827-HA1, CP Assist for Cryptographic Function (CPACF) |
Table 1 contains configuration parameters for the four environments measured.
| Table 1. Configurations measured. | |||||
| Case Number | Security | z/VM Level | SSL Version | TLS Protocol | Cipher |
| case 1. | not secured | z/VM 6.3 with the PTF for APAR VM65788 | SSL V2.1 | na | na |
| case 2A. | secured | z/VM 6.3 with the PTF for APAR VM65788 | SSL V2.1 | TLS 1.0 | RSA_AES_256 |
| case 2B. | secured | z/VM 6.3 with the PTF for APAR VM65788 | SSL V2.1 | TLS 1.2 | RSA_AES_128_SHA256 |
| case 3. | secured | z/VM 6.4 | SSL V2.2 | TLS 1.2 | RSA_AES_128_SHA256 |
|
Notes:
CEC model 2827-HA1;
CP Assist for Cryptographic Function (CPACF) support: Yes
| |||||
For all measurements IBM used a 2827-HA1 processor and its CP Assist for Cryptographic Function (CPACF) facility. It should be noted the system configuration was designed to have no CPU constraints or memory constraints.
IBM collected MONWRITE data during measurement steady state and reduced it with Performance Toolkit for VM. External throughput (ETR) was calculated by summing the FCX215 FCHANNEL Write/s and Read/s columns for chpid 54 and then dividing by a scaling constant. Guest CPU utilization came from dividing the FCX112 USER TCPU value by the duration of the MONWRITE file in seconds. CPU time per transaction was then calculated by dividing CPU utilization by ETR. This was done for the SSL, TCPIP, and RSCS servers.
Results and Discussion
Table 2 shows a comparison of case 2A back to case 1. This illustrates the effect of adding basic encryption to a z/VM configuration.
| Table 2. Secure TCPNJE link vs. non-secure TCPNJE link. | ||||
| Non-Secure TCPNJE Link | Secure TCPNJE Link | Delta | Percent Difference (%) | |
| Runid | TCPX108D | TCPX1081 | ||
| ETR | 267 | 257 | -10.00 | -3.7 |
| SSL server CPU/tx | 0.000 | 0.047 | 0.047 | na |
| TCPIP server CPU/tx | 0.011 | 0.035 | 0.024 | 218.2 |
| RSCS server CPU/tx | 0.154 | 0.175 | 0.021 | 13.6 |
| Servers combined CPU/tx | 0.165 | 0.257 | 0.092 | 55.7 |
|
Notes:
CEC model 2827-HA1;
z/VM 6.3 with the PTF for APAR VM65788; TLS Protocol 1.0;
Cipher Strength RSA_AES_256.
| ||||
With a secure link the SSL server consumed 0.047 CPU/tx. The TCPIP server CPU/tx increased by 218.2%. The RSCS server CPU/tx increased by 13.6%.
Table 3 shows a comparison of case 2B back to case 2A. This illustrates the effect of increasing the encryption strength default.
| Table 3. Secure TCPNJE link with TLS 1.2 - RSA_AES_128_SHA256 vs. secure TCPNJE link with TLS 1.0 - RSA_AES_256. | ||||
| Secure Link with TLS 1.0 | Secure Link with TLS 1.2 | Delta | Percent Difference (%) | |
| Runid | TCPX1081 | TCPX108C | ||
| ETR | 257 | 270 | 13.00 | 5.1 |
| SSL server CPU/tx | 0.047 | 0.048 | 0.001 | 2.1 |
| TCPIP server CPU/tx | 0.035 | 0.033 | -0.002 | -5.7 |
| RSCS server CPU/tx | 0.175 | 0.148 | -0.027 | -15.4 |
| Servers combined CPU/tx | 0.257 | 0.229 | -0.028 | -10.9 |
|
Notes:
CEC model 2827-HA1;
z/VM 6.3 with the PTF for APAR VM65788.
| ||||
The SSL server CPU/tx increased by 2.1% with the higher TLS protocol and cipher strength. The CPU/tx for the TCPIP and RSCS servers decreased by 5.7% and 15.4% respectively.
Table 4 shows a comparison of case 3 back to case 2B. This illustrates the effect of moving from z/VM 6.3 to z/VM 6.4 while keeping the cipher strength constant.
| Table 4. Secure TCPNJE link z/VM 6.4 vs. secure TCPNJE link z/VM 6.3. | ||||
| Secure Link with z/VM 6.3 with the PTF for APAR VM65788 | Secure Link with z/VM 6.4 | Delta | Percent Difference (%) | |
| Runid | TCPX108C | TCPY722M | ||
| ETR | 270 | 332 | 62.00 | 23.0 |
| SSL server CPU/tx | 0.048 | 0.051 | 0.003 | 6.3 |
| TCPIP server CPU/tx | 0.033 | 0.036 | 0.003 | 9.1 |
| RSCS server CPU/tx | 0.148 | 0.166 | 0.018 | 12.2 |
| Servers combined CPU/tx | 0.229 | 0.253 | 0.024 | 10.5 |
|
Notes:
CEC model 2827-HA1;
TLS Protocol 1.2 - RSA_AES_128_SHA256.
| ||||
The SSL server CPU/tx increased by 6.3% in the z/VM 6.4 environment. The CPU/tx for the TCPIP and RSCS servers increased by 9.1% and 12.2% respectively.
Summary and Conclusions
Transferring files across z/VM 6.3 LPARs over an RSCS link secured by TLS 1.0 and RSA_AES_256 resulted in total CPU/tx increasing by 56% for the SSL server, TCPIP, and RSCS combined when compared back to a non-secure RSCS link.
Transferring files across z/VM LPARs in a z/VM 6.3 - TLS 1.2 - RSA_AES_128_SHA256 environment resulted in total CPU/tx increasing by 2.1% for the SSL server when compared back to a z/VM 6.3 - TLS 1.0 - RSA_AES_256 environment.
A z/VM 6.3 environment using TLS 1.2, RSA_AES_128_SHA256, and SSL V2.1 experienced a 6.3% increase in CPU/tx in the SSL server when upgrading to z/VM 6.4.
Back to Table of Contents.
TLS/SSL Server Changes
Abstract
In z/VM 6.4 the TLS default is changed to 1.2, the default cipher is changed to RSA_AES_128_SHA256, and the z/VM System SSL Cryptographic Library (herein, System SSL) is updated to V2.2. Two workloads were used to evaluate the changes.
In a first experiment using a Telnet connection rampup workload, as the number of existing connections increased to 600, the SSL server consumed more CPU per new connection. However, this experiment did not show regression when comparing z/VM 6.4 and its defaults to z/VM 6.3 and its defaults.
In a second experiment using a Telnet data transfer workload, increasing the TLS to 1.2 and the cipher strength to RSA_AES_128_SHA256 did not show regression when compared back to TLS 1.0 with cipher RSA_AES_256.
In a third experiment also using the Telnet data transfer workload, moving to z/VM 6.4 and SSL V2.2 increased CPU/tx by 13.6% compared to z/VM 6.3 and SSL V2.1.
Method
Two workloads were used to evaluate the new default TLS 1.2 protocol and the new default cipher strength RSA_AES_128_SHA256 in z/VM 6.4.
The first workload studied the Telnet-connect environment in which 600 remote Linux Telnet connections were established. A delay of two seconds was used between each connection. Once established the connection remained idle throughout the measurement.
Figure 1 describes the Telnet-connect workload setup.
| Figure 1. 600 Secure Telnet Logo Connections. |
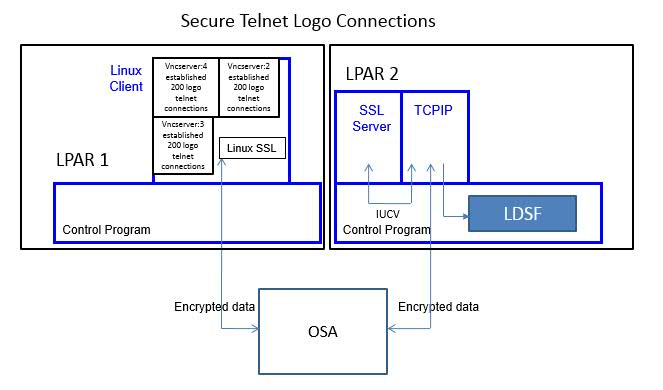
|
| Notes: CEC model 2827-HA1, CP Assist for Cryptographic Function (CPACF) Support |
A Linux client driving the workload was running on LPAR 1. The Linux client opened a total of three VNC servers. Each VNC server established 200 telnet connections to the SSU CMS guests on LPAR 2. The CMS-based SSL server was running on LPAR 2.
The two LPARs communicated via OSA.
IBM collected MONWRITE data during measurement steady state and reduced it with Performance Toolkit for VM. A transaction was one successful Telnet connection. The workload throughput was controlled by the Linux client initiating one Telnet connection every two seconds. The TCPU column in FCX162 USERLOG for the SSL server was used to calculate guest CPU per transaction.
The second workload studied a Telnet data-transfer environment in which 200 existing remote Linux Telnet connections issued 'QUERY DASD' within an exec in parallel for the duration of data collection. A delay of one second was used between queries. This resulted in the data being outbound from the z/VM system (LPAR 2).
Figure 2 describes the Telnet data-transfer setup. On LPAR 1 a Linux client driving the workload was running. The Linux client used five VNC servers to establish a total of 200 telnet connections. Each VNC server supported forty connections.
| Figure 2. 200 Secure Telnet Connections Doing Data Transfer. |
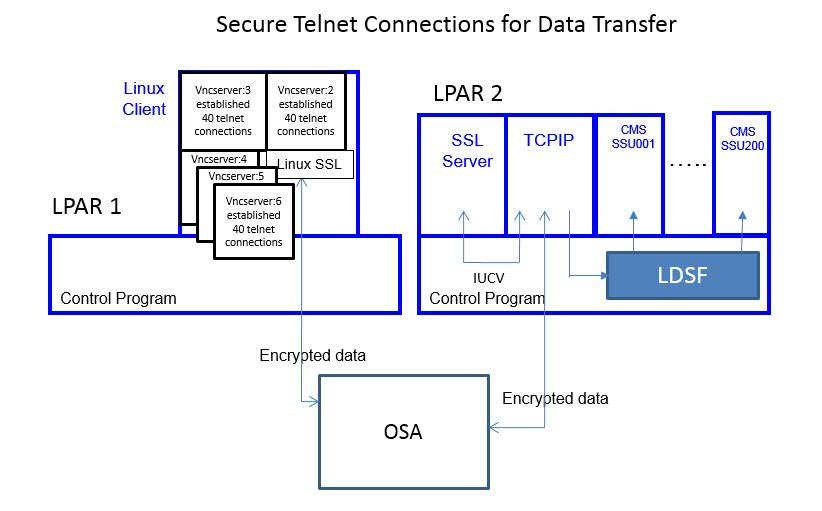
|
| Notes: CEC model 2827-HA1, CP Assist for Cryptographic Function (CPACF) Support |
If should be noted that in both workloads the system configuration was designed to have no CPU constraints or memory constraints.
IBM collected MONWRITE data during measurement steady state and reduced it with Performance Toolkit for VM. Workload throughput was controlled by the Linux client Telnet sessions issuing the CP command 'QUERY DASD' with a one-second sleep between each query. For this particular test case in which 200 Telnet sessions were issuing one 'QUERY DASD' command each second, the throughput was 200 transactions/second. The TCPU column in FCX112 USER was used to calculate guest CPU utilization per transaction for the SSL and TCPIP servers.
Results and Discussion
Telnet Connection
Chart 1 shows the CPU time to establish a new Telnet connection versus existing number of connections.
| Chart 1. SSL CPU Time to Establish a New Connection versus Existing Connections. |
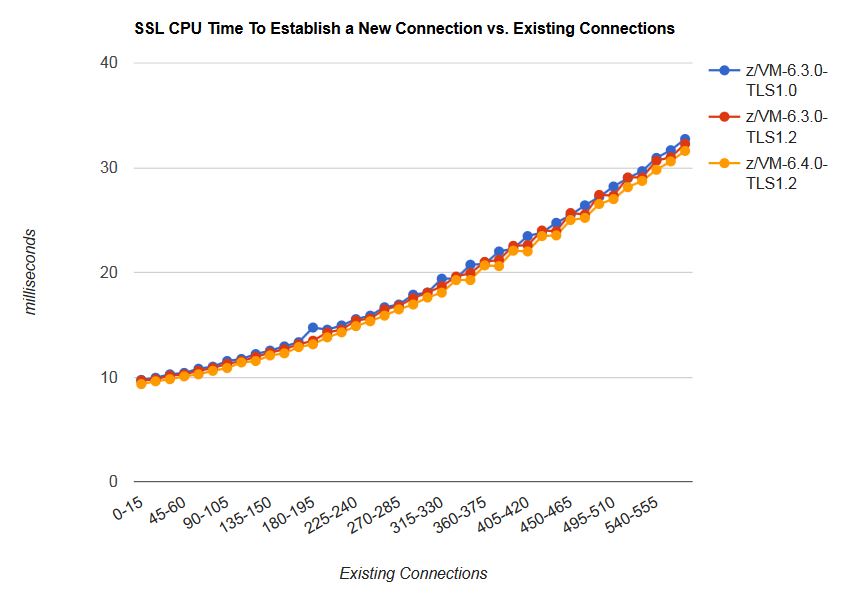
|
| Notes: CEC model 2827-HA1, CP Assist for Cryptographic Function (CPACF) Support |
In the z/VM 6.3 with TLS 1.0, the z/VM 6.3 with TLS 1.2, and the z/VM 6.4 with TLS 1.2 measurements, the CPU time to establish a new Telnet connection gradually increased with existing number of connections for the SSL server.
Telnet Data Transfer
Table 1 shows the CPU/tx cost for the Telnet data transfer workload in a z/VM 6.3 environment. This illustrates the effect of increasing the TLS and default encryption strength.
| Table 1. Telnet Data Transfer, z/VM 6.3, TLS 1.2 vs. TLS 1.0. | ||||
| Base | Comparison | Delta | Percent Difference (%) | |
| Runid | 2HDX108L | 2HDX108M | ||
| TLS level | TLS 1.0 | TLS 1.2 | ||
| Cipher | RSA_AES_256 | RSA_AES_128_SHA256 | ||
| ETR tx/sec | 200 | 200 | 0 | 0.0 |
| SSL server CPU/tx (p) | 0.445 | 0.440 | -0.005 | -1.1 |
| TCPIP server CPU/tx (p) | 0.205 | 0.205 | 0.000 | 0.0 |
|
Notes:
CEC model 2827-HA1;
z/VM 6.3;
CP Assist for Cryptographic Function (CPACF) Support;
SSL V2.1.
| ||||
The SSL server total CPU/tx decreased by 1.1% with the RSA_AES_128_SHA256 cipher when compared back to to the RSA_AES_256 cipher. The TCPIP server total CPU/tx remained constant.
Table 2 shows the CPU/tx cost for the Telnet data transfer workload. This illustrates the effect of moving from z/VM 6.3 to z/VM 6.4 and moving from SSL V2.1 to V2.2 while keeping the cipher strength and TLS constant.
|
Table 2.
Telnet Data Transfer,
z/VM 6.4 vs. z/VM 6.3. | ||||
| Base | Comparison | Delta | Percent Difference (%) | |
| Runid | 2HDX108M | 2HDX722M | ||
| z/VM Level | z/VM 6.3 | z/VM 6.4 | ||
| SSL Level | SSL V2.1 | SSL V2.2 | ||
| ETR tx/sec | 200 | 200 | 0 | 0.0 |
| SSL server CPU/tx (p) | 0.440 | 0.500 | 0.060 | 13.6 |
| TCPIP server CPU/tx (p) | 0.205 | 0.210 | 0.005 | 2.4 |
|
Notes:
CEC model 2827-HA1;
TLS Protocol: 1.2;
CP Assist for Cryptographic Function (CPACF) Support;
TLS 1.2;
Cipher RSA_AES_128_SHA256.
| ||||
The SSL server total CPU/tx increased by 13.6% with z/VM 6.4 and SSL V2.2 when compared back to z/VM 6.3 and SSL V2.1. The TCPIP server total CPU/tx increased by 2.4%.
Summary and Conclusions
In a 600 Telnet connection rampup environment, the SSL server consumed more CPU per new connection as the number of existing connections increased to 600. When compared back to z/VM 6.3 TLS 1.2 and z/VM 6.3 TLS 1.0 environments, the z/VM 6.4 TLS 1.2 environment did not show regression.
In the Telnet data transfer workload, increasing the TLS to 1.2 and the cipher strength to RSA_AES_128_SHA256 did not show regression when compared back to TLS 1.0 with cipher RSA_AES_256. In a z/VM 6.4 with z/VM System SSL Cryptographic Library V2.2, the SSL server CPU/tx increased by 13.6%.
Back to Table of Contents.
z/VM for z13
z/VM 6.3 with the PTF for APAR VM65586 exploits the Simultaneous Multithreading capability of the IBM z13 processor. The PTF also offers system scalability improvements.
To avoid cumbersome, awkward, or lengthy wording throughout the chapters that discuss z/VM 6.3 with the PTF for APAR VM65586, in this report we will call the new function simply z/VM for z13.
The following sections discuss the performance characteristics of z/VM for z13 and the results of the performance evaluation.
Back to Table of Contents.
Summary of Key Findings
This section summarizes key z/VM for z13 performance items and contains links that take the reader to more detailed information about each one.
Further, the Performance Improvements article gives information about other performance enhancements in z/VM for z13.
For descriptions of other performance-related changes, see the z/VM for z13 Performance Considerations and Performance Management sections.
To compare the performance of z/VM for z13 to the performance of previous releases, IBM ran a variety of workloads on the two systems. For the base case, IBM used z/VM 6.3 plus all Control Program (CP) PTFs available as of June 2, 2014. For the comparison case, IBM used z/VM for z13 at the "code freeze" level of February 10, 2015. All runs were done on zEC12.
Regression measurements comparing these two z/VM levels showed nearly identical results for most workloads. ETRR had mean 1.03 and standard deviation 0.03. ITRR had mean 1.02 and standard deviation 0.03.
Key Performance Improvements
z/VM for z13 contains the following enhancements that offer performance improvements compared to previous z/VM releases:
Simultaneous Multithreading: On z13 z/VM for z13 can exploit the multithreading feature of the z13. See the chapter for more information.
System Scaling Improvements: On z13 z/VM for z13 can run in an LPAR consisting of up to 64 logical CPUs. See the chapter for more information.
Back to Table of Contents.
Changes That Affect Performance
This chapter contains descriptions of various changes in z/VM for z13 that affect performance. It is divided into three sections -- Performance Improvements, Performance Considerations, and Performance Management.
Back to Table of Contents.
Performance Improvements
Large Enhancements
In Summary of Key Findings this report gives capsule summaries of the performance notables in z/VM for z13.
Small Enhancements
z/VM for z13 contains one small functional enhancement that might provide performance improvement for guest operating systems that are susceptible to the repaired problem.
IPTE Interlock Alternate:
Efficiencies in handling of guest DAT-serializing instructions (IPTE, IDTE, CSG, CSPG) were added because of the potential to have a larger number of virtual CPUs defined per guest virtual machine when exploiting SMT. An improved hardware interlocking mechanism was exploited which allows the relatively long running host translation process to proceed more efficiently. When a guest DAT-serializing instruction is executed in a guest for which a host translation is also being performed, the guest instruction is intercepted as before, but the instruction is no longer automatically simulated. Instead z/VM backs up the guest PSW instruction address and gives control back to the guest to reexecute the DAT-serializing instruction. This process is referred to as IPTE redrive even though it applies to the whole family of supported DAT-serializing instructions. z/VM does still resort to simulation in exceptional circumstances, such as when instruction tracing is active, or when the guest is redriving excessively without making forward progress, or when the guest is running under a hypervisor which itself is running in a z/VM virtual machine.
With this performance enhancement, a virtual machine that issues a high number of DAT-serializing instructions should experience a reduction in simulation overhead and in turn an increase in guest utilization.
Service Since z/VM 6.3
z/VM for z13 also contains a number of changes or improvements that were first shipped as service to earlier releases. Because IBM refreshes this report only occasionally, IBM has not yet had a chance to describe the improvements shipped in these PTFs.
VM64460: Minidisk Cache (MDC) would stop working in some circumstances. The failure was due to MDC PTEs not being reclaimed in a timely way. The PTF repairs the problem.
VM65425: COPYFILE exhibited poor performance when the source file resided in the CMS Shared File System. A change to DMSCPY to use larger read buffers repaired the problem.
VM65426: A system hang was possible because HCPHPH inadvertently acquired PTIL and shadow table lock on the SYSTEM VMDBK. The error was introduced in the PTF for VM64715. The PTF for VM65426 repairs the problem.
VM65476: Response output from the NETSTAT TELNET and NETSTAT CONN commands displayed slowly if file ETC HOSTS was not found on any CMS accessed minidisk or SFS directory. The PTF repaired the problem.
VM65518: The MAPMDISK REMOVE function would hang if the system were under paging load. This problem was the result of a defect in the PTF for APAR VM65468. The PTF for VM65518 repairs the problem.
VM65549: Page reads from EDEV paging devices were not being counted. The PTF solves the problem.
VM65655: Virtual storage release processing was slow because an IPTE was being done on an invalid PTE. The PTF repairs the problem.
VM65683: The Control Program's spin lock manager issues Diag x'9C' to PR/SM when the acquiring CPU finds the lock held and detects that the holder could be expedited by issuing the Diagnose against the holding CPU. A defect in the loop that identifies the lock holders caused the Control Program to issue excessive numbers of these Diag x'9C' instructions. The PTF repairs the problem.
VM65696: This moves the scheduler lock to its own cache lines. The lock's SYNBK is now alone on its own line, as is its SYNBX.
Miscellaneous Repairs
IBM continually improves z/VM in response to customer-reported or IBM-reported defects or suggestions. In z/VM for z13 the following small improvements or repairs are notable:
Long LOGOFF Times: LOGOFF can take a long time in the presence of parked logical CPUs. The repair solves the problem.
Back to Table of Contents.
Performance Considerations
As customers begin to deploy the z13 and z/VM for z13, they might wish to give consideration to the following items.
The z13: Notable Characteristics
The IBM z13 offers processor capacity improvements over the IBM zEC12. Understanding important aspects of how the machine is built will help customers to realize capacity gains in their own installations.
One way z13 achieves capacity improvements is that its caches are larger than zEC12. Compared to the zEC12, on the z13 the L1 I-cache is 50% larger, the L1 D-cache is 33% larger, the L2 is 100% larger, the L3 is 33% larger, and the L4 is 25% larger. With suitable memory reference habits, the workload will benefit from the increased cache size.
Another way z13 achieves capacity improvements is that its CPU cores are multithreaded. Where on zEC12 each CPU core ran exactly one stream of instructions, on z13 each CPU core can run two instruction streams concurrently. This strategy lets the instruction streams share resources of the core. The theory is that the two streams are likely not to need exactly the same core resources at exactly the same instant all the time. It follows that while one thread is using one part of the core, the other thread can use another part of it. This can result in higher productivity from the core, if the instruction streams' behaviors are sufficiently symbiotic.
Previous System z machines such as the zEC12 used a three-level topology as regards how the cores and memory were connected to one another. The hierarchy was this: cores were on chips, chips were on nodes, and the nodes fitted into the machine's frame. On z13 there's an additional layer in the hierarchy: cores are on chips, chips are on nodes, nodes are fitted into drawers, and the drawers are in turn connected together. This means that depending upon drawer boundaries, off-node L4 or off-node memory can be either on-drawer, which is closer, or off-drawer, which is farther away. The latter means longer access times.
In the next section we'll explore how to take these factors into account so as to achieve good performance from the z13.
How to Get Performance from the z13
To get good performance from the z13, it's necessary to think about how the machine works and then to adapt the workload's traits to exploit the machine's strengths.
For example, consider cache. A workload that stays within the z13's cache has a good chance of running well on z13. Use the CPU Measurement Facility host counters and the z/VM Download Library's CPUMF tool to observe your workload's behavior with respect to cache. See our CPU MF article for help on understanding a z/VM CPU MF host counters report. If the workload is spilling out of cache, perhaps rebalancing work among LPARs will help. One workload of ours that did very well on z13 had an L1 miss rate of about 1% and resolved about 85% of its L1 misses at L3 or higher.
The amount of performance improvement a customer will see in moving from zEC12 to z13 is very dependent on the workload's cache footprint. A workload that stayed well within zEC12's cache might see only modest improvement on z13, because it will get no help from the increased z13 cache sizes. At the other end of the spectrum, a workload that grossly overflows cache on both machines similarly might see no benefit from z13. The best case is likely to be the workload that didn't fit well into zEC12 cache but does fit well into the increased caches on z13. Again, make use of the CPU MF host counters to observe your workload's cache behavior.
Another factor about z13 cache relates to multithreading. Yes, the L1s and L2s are larger than they were on zEC12. But when multithreading is enabled, the two threads of a core share the L1 and the L2. Switching the z13 from non-SMT mode to SMT-2 mode might well cause a change in the performance of the L1 or of the L2. This behavior is very much a function of the behavior of the workload.
Speaking of cache, it's good to mention here that one of the purposes of running vertically is to improve the behavior of the CPC's cache hierarchy, sometimes informally called the nest. When a partition uses vertical mode, PR/SM endeavors to place the partition's logical CPUs close to one another in the machine topology, and it also tries not to move a logical CPU in the topology from one dispatch to the next. These points are especially true for high-entitlement logical CPUs, called vertical highs, notated Vh. If you have not yet tried running vertically, consider at least trying it. Before you do, make sure you have good, workable measurements of your workload's behavior from horizontal mode. Then switch your partition to vertical, collect the same measurements, make a comparison, and decide for yourself how to proceed.
One consequence of multithreaded operation is that although the core might complete more instructions per unit of time, the two instruction streams themselves might respectively experience lower instruction completion rates than they might have experienced had they run alone on the core. This is akin to how a two-lane highway with speed limit 45 MPH can move more cars per second than can a one-lane highway with speed limit 60 MPH. In the two-lane case, the cars have slowed down, but the highway is doing more work.
To get the most out of a multithreaded z13, the workload will need to be configured in such a way that it can get benefit out of a large number of instruction streams that might well individually be slower than previous machines' streams. A workload whose throughput hangs entirely on the throughput of a single software thread -- think virtual CPU of a z/VM guest -- might not do as well on a multithreaded z13 as it did on zEC12. But if the workload can be parallelized, so that a number of instruction streams concurrently contribute to its throughput, the workload might do better, core for core. To do well with a multithreaded z13, customers will need to examine the arrangement and configuration of their deployments and remove single-thread barriers.
Another consequence of multithreaded operation is that as the core approaches 200% busy -- that is, neither thread ever loads a wait PSW -- the opportunity for the threads' instruction streams to fit together synergistically can decrease. Customers might find that while they could run a single-threaded zEC12 core to very high percent-busy without concern, running a two-threaded z13 core to very high percent-busy might not produce desirable results. Watch the workload's performance as compared to percent-busy as reported by z/VM Performance Toolkit's FCX304 PRCLOG and make an adjustment if needed.
A further consequence of multithreaded operation is that owing to the reduced capacity of each thread, more threads -- read more logical CPUs -- might be required to achieve capacity equivalent to an earlier machine. Be aware, though, that adding logical CPUs increases parallelism and therefore has the potential to increase spin lock contention. Customers should pay attention to FCX265 LOCKLOG and FCX239 PROCSUM and contact IBM if spin lock contention rises to unacceptable levels.
A single drawer of a z13 can hold at most 36 customer cores. Depending upon model number, the limit might be smaller. This means that as the number of cores defined for an LPAR increases, the LPAR might end up spanning a drawer boundary. Whether a drawer boundary poses a problem for the workload is very much a property of the workload's memory reference habits. If locality of reference is very good and use of global memory areas such as spin lockwords is very light, the drawer boundary might pose no problem at all. As the workload moves away from those traits, the drawer boundary might begin to pose a problem. Customers interested in using LPARs that cross drawer boundaries should pay very close attention to workload performance and CPU MF host counters reports to make sure the machine is running as desired. The FCX287 TOPOLOG report of z/VM Performance Toolkit details the topology of the LPAR. When interpreting TOPOLOG on a z13, keep in mind that nodes 1 and 2 are on drawer 1, nodes 3 and 4 are on drawer 2, and so on.
Owing to how the z13 assigns core types (CP, IFL, zIIP, etc.) to the physical cores of the machine, customers using mixed-engine LPARs might find the LPAR has been placed across drawers. This can be true even when the number of cores defined for the LPAR is small. Again, the FCX287 TOPOLOG report will reveal this. If a mixed-engine z/VM LPAR is not performing as expected, contact IBM.
Other Concerns
During its runs of laboratory workloads IBM gained some experience with factors that might cause variability in what IBM calls the SMT benefit, that is, the capacity of a multithreaded z13 core compared to the capacity of a single-threaded z13 core. One factor that emerged was the percent of CPU-busy that was spent resolving Translation Lookaside Buffer (TLB) misses. In the z/VM CPU MF host counters reports produced by the CPUMF tool, the column T1CPU tabulates this value. It was our experience that as T1CPU increased, the SMT benefit decreased. For example, in one of our 16-core experiments, we saw an ITRR of 1.26 when we turned on multithreading. T1CPU for those workloads was about 8%. In another pair of 16-core experiments, we saw an ITRR of 1.08 when we turned on multithreading. T1CPU for those workloads was about 25%. Factors like this are why IBM marketing materials advertise the SMT benefit as likely falling into the range of 10% to 30%. In CPU MF host counters data z/VM customers have sent us, T1CPU tends to land in the neighborhood of 17% with standard deviation 6%. In other words, T1CPU tends to vary a lot.
As part of its evaluation of the z13 exploitation PTF IBM did runs in SMT-2 mode with the recent CPU Pooling feature activated. We found that in SMT-2 mode there were some cases where the pool was slightly overlimited, that is, the guests in the pool were held back to an aggregate consumption that was slightly less than was specified on the command. We found this for only CAPACITY-limited CPU pools. IBM continues to study this issue. In the meantime, customers who experience this can compensate by adjusting the specified limit upward slightly so that the desired behavior is obtained. And speaking of adjusting limits, remember that anytime you feel you need to adjust your CPU Pooling limits, make sure the adjustments you make are within the limits of your capacity license.
In z/VM for z13 z/VM HiperDispatch no longer parks logical CPUs because of elevated T/V ratio. Provided Global Performance Data Control is enabled, the number of unparked logical CPUs is now determined solely on the basis of how much capacity it appears the LPAR will have at its disposal. When Global Performance Data Control is disabled, the number of unparked logical CPUs is determined by projected load ceiling plus CPUPAD.
The Most Important Thing to Remember
Longtime z/VM performance expert Bill Bitner has a standard answer he gives when a customer asks whether his system is exhibiting good performance. Bill will often reply, "Well, that depends. What do you mean by 'performance', and what do you mean by 'good'?" Bill's answer is right on target, and with the coming of z13, perhaps it's even more so.
Kidding aside, understanding whether your workload is getting value out of z13 is entirely about whether you have taken time to do all of these things:
- Establish meaningful measures of performance for your workload;
- Establish success thresholds for those measures of performance;
- Routinely collect the values of those measures;
- Routinely compare the collected values to your success thresholds;
- Take corrective action if the collected values fall short.
Your measures of success might be as simple as transaction rate and transaction response time. If your business requires it, you might define different or additional measures. Whatever measures you pick, routinely collect and evaluate them. In this way you have the best chance of getting the performance you expect.
Back to Table of Contents.
Performance Management
These changes in z/VM for z13 affect the performance management of z/VM:
- Monitor Changes
- Command or Output Changes
- Effects on Accounting Data
- Performance Toolkit for VM Changes
- Omegamon XE Changes
Monitor Changes
Several enhancements in z/VM for z13 affect CP monitor data. The changes are described below. The detailed monitor record layouts are found on the control blocks page.
z/VM for z13 provides host exploitation support for simultaneous multithreading (SMT) on the IBM z13. When the multithreading facility is installed on the hardware and multithreading is enabled on the z/VM system, z/VM can dispatch virtual CPUs on up to two threads (logical CPUs) of an IFL processor core.
The following new monitor record has been added for this support:
| Monitor Record | Record Name |
|---|---|
| Domain 5 Record 20 | MT CPUMF counters |
The following monitor records have been updated for this support:
| Monitor Record | Record Name |
|---|---|
| Domain 0 Record 2 | Processor data (per processor) |
| Domain 0 Record 15 | Logical CPU utilization (global) |
| Domain 0 Record 16 | CPU utilization in a logical partition) |
| Domain 0 Record 17 | Physical CPU utilization data for LPAR management |
| Domain 0 Record 19 | System data (global) |
| Domain 0 Record 23 | Formal spin lock data (global) |
| Domain 1 Record 4 | System configuration data |
| Domain 1 Record 5 | Processor configuration data (per processor) |
| Domain 1 Record 16 | Scheduler settings |
| Domain 1 Record 18 | CPU capability change |
| Domain 2 Record 4 | Add user to dispatch list |
| Domain 2 Record 5 | Drop user from dispatch list |
| Domain 2 Record 7 | Set SRM changes |
| Domain 2 Record 13 | Add VMDBK to limit list |
| Domain 2 Record 14 | Drop VMDBK from limit list |
| Domain 4 Record 2 | User logoff data |
| Domain 4 Record 3 | User activity data |
| Domain 4 Record 9 | User activity data at transaction end |
| Domain 5 Record 1 | Vary on processor |
| Domain 5 Record 2 | Vary off processor |
| Domain 5 Record 11 | Instruction counts per processor |
| Domain 5 Record 13 | CPU-measurement facility counters |
| Domain 5 Record 16 | Park/unpark decision |
| Domain 5 Record 17 | Real CPU data |
| Domain 5 Record 19 | CPU pool utilization |
z/VM will support up to 64 logical processors on the IBM z13. Depending upon the number and types of cores present in the LPAR, and depending upon whether multithreading is enabled, the number of cores supported will vary.
The following monitor records were updated for this support:
| Monitor Record | Record Name |
|---|---|
| Domain 3 Record 1 | Real storage management (global) |
| Domain 3 Record 2 | Real storage activity (per processor) |
Command or Output Changes
This section cites new or changed commands or command outputs that are relevant to the task of performance management. It is not an inventory of every new or changed command.
The section does not give syntax diagrams, sample command outputs, or the like. Current copies of z/VM publications can be found in the online library.
QUERY CRYPTO: The command is changed to support crypto type CEX5S. The AP and domain numbers in the response increased from two to three digits to accomodate AP and domain numbers up to 255.
QUERY VIRTUAL CRYPTO: The command is changed to support crypto type CEX5S. The AP and domain numbers in the response increased from two to three digits to accomodate AP and domain numbers up to 255.
QUERY CAPABILITY: The response is changed. The primary, secondary, and nominal capabilities can be in integer or decimal format.
QUERY MULTITHREAD: This new command shows MT status and thread information.
QUERY PROCESSOR: The response is changed to show core IDs.
INDICATE MULTITHREAD: This new command shows core utilizations.
VARY CORE: This new command varies off a core when the system is in MT mode. When the system is not in SMT mode the new command works as VARY PROCESSOR did.
VARY PROCESSOR: In MT mode this command does not operate. One must use VARY CORE instead.
QUERY TIME: In MT mode, CPU times are reported as MT-1-equivalent time.
INDICATE USER: In MT mode, CPU times are reported as MT-1-equivalent time.
LOGOFF: In MT mode, CPU times are reported as MT-1-equivalent time.
MONITOR SAMPLE: The CPUMFC operand does not control the collection of the MT counter sets. Those sets are always collected.
DEFINE PCIFUNCTION: A new operand, TYPE, is now supported to let the issuer specify the type of PCI function.
DEFINE CHPID: The command is changed to allow the use of the PCHID option to specify a VCHID for IQD channels. It is also changed to allow the specifying of the CS5 CHPID type with AID and PORT options.
QUERY CHPID: The command is changed to display type information for CS5 CHPIDs.
Effects on Accounting Data
A new record, CPU Capability continuation data, type E, is added to contain character decimal equivalents of the binary floating point capability values reported in the CPU Capability type D record.
For the type 1 accounting record, fields ACOTIME and ACOVTIM are changed to hold MT-1-equivalent time.
A new accounting record, type F, holds raw time and prorated core time values.
Performance Toolkit for VM Changes
Performance Toolkit for VM has been enhanced for z13.
The following reports have been changed:
Performance Toolkit for VM: Changed Reports
| Name | Number | Title | What Changed |
| CACHEXT | FCX177 | Cache Extended Functions Performance |
|
| DSVSLOG | FCX303 | DSVBK Steals per Processor Log |
|
| HISTDATA | FCX160 | History Data Selection Menu |
|
| IOCHANGE | FCX185 | I/O Configuration Changes |
|
| LOCKLOG | FCX265 | Spin Lock Log |
|
| LSHARACT | FCX306 | Logical Partition Share |
|
| MENU | FCX124 | Performance Screen Selection menu |
|
| MONDATA | FCX155 | Monitor Data Statistics |
|
| MONSET | FCX149 | Monitor Settings |
|
| PHYSLOG | FCX302 | Real CPU Utilization Log |
|
| PRCLOG | FCX304 | Processor Log |
|
| PROCCONF | FCX234 | Processor Configuration Log |
|
| PROCLOG | FCX144 | Processor Activity |
|
| PROCSUM | FCX239 | Processor Summary Log |
|
| USTAT | FCX114 | User Wait States |
|
| USTATLOG userid | FCX164 | User Wait States Log |
|
| USTLOG | FCX135 | User Wait State Log |
|
| STORMENU | FCX260 | Storage Management Logs Menu |
|
| SYSCONF | FCX180 | System Configuration |
|
| SYSSET | FCX154 | System Settings |
|
| TOPOLOG | FCX287 | System Topology Machine Organization |
|
The following reports are new:
Performance Toolkit for VM: New Reports
| Name | Number | Title | Description |
| USRMPLOG userid | FCX288 | Multiprocessor User Activity Log | The Multiprocessor User Activity Log Screen shows a 'by time' log of the selected user's virtual CPU consumption. |
| USTMPLOG userid | FCX315 | Multiprocessor User Wait States Log | The Multiprocessor User Wait States Log Screen shows a 'by time' log of the selected user's virtual CPU wait state statistics. |
| PCIMENU | FCX310 | PCI Function Menu | The PCI Function Menu Screen shows a selection menu of all available PCI function performance reports. |
| PCICONF | FCX311 | PCI Function Configuration | The PCI Function Configuration Screen shows a screen with PCI functions configuration. |
| PCIACT | FCX312 | PCI Function Activity, Format 0 | PCI Function Activity, Format 0. |
| PCILOG pcifunc | FCX313 | PCI Function Activity Log, Format 0 | PCI Function Activity Log, Format 0. |
| PINLOG | FCX314 | Pinned Storage Log | Pinned Storage Log. |
| SUBPLOG | FCX316 | Subpool Storage Log | Subpool Storage Log. |
| PCIACT ROCE | FCX318 | PCI Function Activity, Format 1 | PCI Function Activity, Format 1. |
| PCILOG pcifunc | FCX319 | PCI Function Activity Log, Format 1 | PCI Function Activity Log, Format 1. |
| PCIACT ZEDC | FCX320 | PCI Function Activity, Format 2 | PCI Function Activity, Format 2. |
| PCILOG pcifunc | FCX321 | PCI Function Activity Log, Format 2 | PCI Function Activity Log, Format 2. |
IBM continually improves Performance Toolkit for VM in response to customer-reported or IBM-reported defects or suggestions. In the z13 release the following small improvements or repairs are notable:
- Added additional validation for monitor data files
- Added additional support for BATCH mode
- The LOCATE command in the WEB/FCONAPPC modes has been made case-insensitive
- Corrected the screen number in VMCF session header for reports FCX256-FCX304
- Corrected the time interval on the benchmark reports header line for PRINTRMT command
- Some activity counters were expanded to 64 bits to avoid overflow
Omegamon XE Changes
OMEGAMON XE on z/VM and Linux supports the z13.
Back to Table of Contents.
New Functions
This section contains discussions of the following performance evaluations:
- Simultaneous Multithreading
- System Scalability Improvements
Back to Table of Contents.
Simultaneous Multithreading (SMT)
Abstract
z/VM for z13 lets z/VM dispatch work on up to two threads (logical CPUs) of an IFL processor core. This enhancement is supported for only IFLs. According to the characteristics of the workload, results in measured workloads varied from 0.64x to 1.36x on ETR and 1.01x to 1.97x on ITR.
In an SMT environment individual virtual CPUs might have lower performance than they have when running on single-threaded cores. Studies have shown that for workloads sensitive to the behavior of individual virtual CPUs, increasing virtual processors or adding more servers to the workload can return the ETR to levels achieved when running without SMT. In general, whether these techniques will work is very much a property of the structure of the workload.
Introduction
This article provides a performance evaluation of select z/VM workloads running in an SMT-2 environment on the new IBM z13.
Prior to the IBM z13, we often used the words IFL, core, logical PU, logical CPU, CPU, and thread interchangeably. This is no longer the case with the IBM z13 and the introduction of SMT to z Systems. With z/VM for z13, z/VM can now dispatch work on up to two threads of a z13 IFL core. Though IBM z13 SMT support includes IFLs and zIIPs, z/VM supports SMT on only IFLs.
Two threads of the same core share the cache and the execution unit. Each thread has separate registers, timing facilities, translation lookaside buffer (TLB) entries, and program status word (PSW).
Enabling SMT-2 in z/VM
In z/VM, SMT-2 is disabled by default. To enable two threads per IFL core, include the following statement in the system configuration file.
- MULTITHreading ENAble
Whether or not z/VM opts in for SMT, its LPAR's units of dispatchability continue to be logical CPUs. When z/VM does not opt in for SMT, PR/SM dispatches the partition's logical CPUs on single-threaded physical cores. When z/VM opts in for SMT, PR/SM dispatches the partition's logical CPUs on threads of a multithreaded core. PR/SM assures that when both threads of a multithreaded physical core are in use, they are always both running logical CPUs of the same LPAR.
Once z/VM is enabled for SMT-2, it applies to the whole logical partition. Further, disabling SMT-2 requires an IPL.
Vertical Polarization
Enabling the z/VM SMT facility requires that z/VM be configured to run with HiperDispatch vertical polarization mode enabled. The rationale behind this decision is as follows. Vertical polarization gets a tighter core affinity and therefore better cache affinity. To configure the LPAR mode to vertical polarization, include the following statement in the system configuration file.
- SRM POLARization VERTical
Reshuffle Algorithm
Enabling the z/VM SMT facility requires that z/VM be configured to use the work balancing algorithm reshuffle. The alternative work balancing algorithm, rebalance, is not supported with SMT-2 as performance studies have shown the rebalance algorithm is effective for only a very limited class of workloads. To configure the LPAR to use the reshuffle work balancing algorithm, include the following statement in the system configuration file.
- SRM DSPWDMethod REShuffle
Threads of a Core Draw Work from a Single Dispatch Vector (DV)
z/VM maintains dispatch vectors on a core basis, not on a thread basis. There are several benefits of having threads of a core draw from the same dispatch vector. Threads of the same core share the same L1 and L2 cache, so there is limited cache penalty in moving a guest virtual CPU between threads of a core. Further, because of features of the reshuffle algorithm, there is a tendency to place guest virtual CPUs together in the same DV. Having the threads of a core draw from the same DV might increase the likelihood that different virtual CPUs of the same guest will be dispatched concurrently on threads of the same core. Last, having threads of a core draw from a shared DV helps reduce stealing. Giving each thread its own DV would cause VMDBKs to be spread more thinly across DVs, making the system more likely to steal. By associating the two threads with the same DV, work is automatically balanced between them without the need for stealing.
Thread Affinity
There is a TLB penalty when a virtual CPU moves between threads, whether or not the threads are on the same core. To minimize this penalty thread affinity was implemented. Thread affinity makes an effort to keep a virtual CPU on the same thread of a core, as long as the virtual CPU stays in the core's DV.
Preemption
Preemption controls whether the virtual CPU currently dispatched on a logical processor will be preempted when new work of higher priority is added to that logical processor's DV. Preemption is disabled with SMT-2. This lets the current virtual CPU remain on the logical processor and in turn experience better processor efficiency due to continued advantage of existing L1, L2, and TLB content.
Minor Time Slice
With SMT-2, virtual machine minor time slice default value (DSPSLICE) is increased to 10 milliseconds, to let a virtual CPU run longer on a thread. This helps the virtual CPU to get benefit from buildup in L1, L2, and the TLB. This in part compensates for the slower throughput level of a thread versus a whole core.
Time Slice Early
Time Slice Early is a new function that allows CP to improve processor efficiency. When SMT-2 is enabled, when a virtual CPU loads a wait PSW, if the minor time slice is 50% complete or more, CP ends the virtual CPU's minor time slice. This helps assure that a virtual CPU is not holding a guest spinlock at what would otherwise be the end of its minor time slice.
In-Chip Steal Barrier
In z/VM 6.3, the HiperDispatch enhancement introduced the notion of steal barriers. For a logical CPU to steal a VMDBK cross-chip or cross-book, certain severity criteria had to be met. The longer the topological drag would be, the more severe the situation would need to be before a logical CPU would do a steal. This strategy kept VMDBKs from being dragged long topological distances unless the situation were dire enough. In SMT the notion of steal barriers has been extended to include within-chip.
MT1-Equivalent Time versus Raw Time
Raw time is a measure of the CPU time each virtual CPU spent dispatched. When a virtual CPU runs on a single-threaded core, raw time measures usage of a core; when a virtual CPU runs on a thread of a multithreaded core, raw time measures usage of a thread. MT1-equivalent time is a measure of effective capacity consumed, taking into account the effects of multithreading. MT1-equivalent time approximates the time that would have been consumed if the workload had been run with multithreading disabled, that is, with all core resources available to one thread. The effect of the adjustment is to "discount" the raw time to compensate for the slowdown induced by the activity on the other thread of the core.
Live Guest Relocation (LGR)
When a non-SMT system and an SMT-2 system are joined in an SSI, a guest that is eligible for LGR can be relocated between the systems.
SMT Not Virtualized to Guest
SMT is not virtualized to the guest. SMT is functionally transparent to the guest. The guest does not need to be SMT-aware to gain value.
Multithreading Metrics
The following new metrics are available in CP monitor record MRSYTPRP, D0 R2.
- Average thread density (TD): This represents the average number of threads in use while the core was in use. Periods of time when neither thread was in use are ignored in the TD calculation. When the number of threads per core is two, the thread density is a value between one and two, inclusively.
- Core productivity: This is a metric that represents a ratio of how much work* was accomplished to the maximum amount of work* that could have been accomplished. With single-threaded cores, productivity is 100% because whenever the core is dispatched, it is executing as many instructions as possible. With SMT-2, if both threads are executing instructions all of the time during the interval, productivity is 100%.
- Core busy time: This measures the amount of time work* was dispatched on at least one thread of the core in an interval.
- MT utilization: This measures how much of the maximum core capacity was used. It is a combination of busy time and productivity.
- Capacity factor: This metric represents the ratio of how much work* was accomplished on the core to the amount of work* that would have been accomplished if only one thread had been active. For example, if a workload running on two-threaded cores had a capacity factor of 130%, it meant that the cores were able to accomplish 1.3x (130%) the amount of work* that would have been accomplished on single-threaded cores. For single-threaded cores capacity factor is always 100%.
-
Maximum capacity factor:
This metric represents a ratio of the maximum amount of work*
that can be accomplished if two threads were active per core
to the maximum amount of work* that would have been accomplished
if only one thread had been active per core.
For single-threaded cores, maximum capacity factor is
always 100%.
Capacity factor is equal to maximum capacity factor only when
the core ran at thread density two for the entire interval.
* The term work is used to describe a relative instruction completion rate. It is not intended to describe how much work a workload is actually accomplishing.
Performance Toolkit Updates for SMT
To help to support z/VM's operation in SMT mode, IBM updated these Perfkit reports.
- FCX154 / SYSSET includes the state of the multithreading mode plus multithreading settings since the last IPL, per processor type.
- FCX180 / SYSCONF includes the state of the multithreading mode.
- FCX287 / TOPOLOG includes the state of the multithreading mode.
- FCX303 / DSVBK includes core and thread information per logical processor.
- FCX304 / PRCLOG includes core and thread information per logical processor.
Perfkit does not report the new D0 R2 multithreading metrics.
Method
z13 SMT-2 was evaluated by direct comparison to non-SMT. Each individual comparison used an identical logical partition configuration, z/VM system, and LINUX level for both SMT-2 and non-SMT. Changes in number of users, number of virtual processors, and number of guests will be described in the individual sections.
Specialized Virtual Storage Exerciser, Apache, and DayTrader workloads were used to evaluate the characteristics of SMT-2 in a variety of configurations with a wide variety of workloads. The Master Processor Exerciser was used to evaluate the effect of multithreading on applications having a z/VM master processor requirement.
Results varied widely for the measured workloads.
Best results occurred for applications having highly parallel activity and no single point of serialization. This will be demonstrated by the results of an Apache workload with a sufficient number of MP clients and MP servers without any specific limitations that would prevent productive use of all the available processor cycles.
No improvement is expected for applications having a single point of serialization. Specific serializations in any given workload might not be easily identified. This will be demonstrated by the results of an Apache workload with a limited number of UP clients and by an application serialized by the z/VM master processor.
Specific configurations chosen for comparison included storage sizes from 12 GB to 1 TB and dedicated logical processors from 1 to 64. Only eight specific experiments are discussed in this article.
New z/VM monitor data available with the SMT-2 support is described in z/VM Performance Management.
Results and Discussion
With SMT-2, calculated ITR values might not be as meaningful as values calculated for non-SMT. The ITR calculation predicts the current efficiency for logical processors, but with SMT-2, thread efficiency generally decreases as the thread density increases. The results demonstrate a wide range of thread density.
SMT-2 Ideal Application
Table 1 contains a comparison of selected values between SMT-2 and non-SMT for an Apache workload with ideal SMT-2 characteristics.
The workload consists of highly parallel activity with no single point of serialization. There are 2 AWM clients and 2 Apache servers, each defined with 4 virtual processors. This provides 16 virtual processors to drive the 4 logical processors with non-SMT or the 8 logical processors with SMT-2. There are 16 AWM connections between each client and each server, therefore 64 concurrent sessions. These should be sufficient to keep the 16 virtual processors busy. This configuration provides a demonstration of the value that can be obtained for a workload that has ideal SMT characteristics.
For this workload SMT-2 provided a 36% increase in transaction rate, a 53% increase in ITR, a 25% decrease in average response time, and an 11% decrease in processor utilization.
Average thread density for the SMT-2 measurement was 1.83.
Table 1. SMT-2 Ideal Application
| Run ID | AMPDGLD0 | AMPDGLD1 | Delta | Pct |
| Multithreading | disabled | enabled | ||
| Logical processors | 4 | 8 | 4 | 100.0 |
| ETR | 7396.28 | 10072.69 | 2676.41 | 36.2 |
| ITR | 7736.69 | 11906.25 | 4169.56 | 53.9 |
| Total util/proc | 95.6 | 84.6 | -11.0 | -11.5 |
| AWM avg resp time | 0.008674 | 0.006445 | -0.002229 | -25.7 |
| AWM client util | 151.381 | 272.698 | 121.317 | 80.1 |
| Apache server util | 39.254 | 64.810 | 25.556 | 65.1 |
| SMT-2 avg thread density | na | 1.83 | ||
| Notes: z/VM for z13; 2964-NC9; 4 dedicated IFL cores; 30 GB central storage; storage-rich; Apache workload; 2 AWM clients (4 virtual CPUs, 1 GB); 2 Apache servers (4 virtual CPUs, 512 MB); 16 AWM connections to each server; 2 URL files; 15 KB avg URL size; Linux SLES11 SP3. | ||||
Maximum z/VM 6.3 Storage Configuration
Table 2 contains a comparison of selected values between SMT-2 and non-SMT for an Apache workload using the maximum supported 1 TB of storage. This workload provides a good demonstration of the value of SMT-2 for a workload with no specific serialization.
The workload has 4 AWM clients each defined with 4 virtual processors. Average utilization with non-SMT is 92% of a virtual processor which provides enough excess capacity for the expected increase with SMT-2. The 16 AWM client virtual processors are enough to support the 8 logical processors with non-SMT or the 16 logical processors with SMT-2.
The workload has 128 Apache servers each with 1 virtual processor. Average utilization with non-SMT is only 2.5% which provides enough excess capacity for the expected increase with SMT-2. The 128 Apache server virtual processors are enough to support the 8 logical processors with non-SMT or the 16 logical processors with SMT-2.
Each of the 128 Apache servers has 10 GB of virtual storage and is primed with 10000 URL files. Each URL file is 1 MB so all the virtual storage in each Apache server participates in the measurement. The 128 fully populated Apache servers exceed the 1 TB of central storage, thus providing heavy DASD paging activity for this workload.
There is a single AWM client connection to each Apache server, thus creating 512 parallel sessions to supply work to the 128 Apache server virtual processors.
There are 224 paging devices to handle the paging activity.
For this workload SMT-2 provided a 21% increase in transaction rate, a 30% increase in ITR, an 18% decrease in average response time and a 7% decrease in processor utilization.
Average thread density for the SMT-2 measurement was 1.82.
DASD paging rate increased 16%.
Although there was a high percentage increase in spin lock time, it was not a major factor in the results.
Table 2. SMT-2 Maximum Storage
| Run ID | A1TDGLD0 | A1TDGLD1 | Delta | Pct |
| Multithreading | disabled | enabled | ||
| Logical processors | 8 | 16 | 8 | 100.0 |
| ETR | 854.79 | 1036.09 | 181.30 | 21.2 |
| ITR | 972.46 | 1268.16 | 295.70 | 30.4 |
| AWM avg resp time | 0.541012 | 0.442838 | -0.098174 | -18.1 |
| Total util/proc | 87.9 | 81.7 | -6.2 | -7.1 |
| Apache server util | 2.40 | 5.12 | 2.72 | 113.3 |
| AWM client util | 92.37 | 149.46 | 57.09 | 61.8 |
| SMT-2 avg thread density | na | 1.82 | ||
| DASD page rate | 99245.0 | 115000.0 | 15755.0 | 15.9 |
| Reported sys spin %busy | 0.6 | 3.6 | 3.0 | 500.0 |
| Notes: z/VM for z13; 2964-NC9; 8 dedicated IFL cores; 1 TB central storage; Apache workload; 4 AWM clients (4 virtual cpus, 4 GB); 128 Apache servers (1 virtual CPU, 10 GB); 1 AWM connection to each server; 10000 URL files; 1 MB avg URL size; Linux SLES11 SP1; Four 8.0 Gbps FICON switched channels; 2107-E8 control unit; 224 3390-54 paging volumes. | ||||
Maximum SMT-2 Processor Configuration
Table 3 contains a comparison of selected values between SMT-2 and non-SMT for a DayTrader workload using the maximum supported 32 cores in SMT-2.
For this workload, comparisons are made at approximately 95% logical processor utilization. The number of servers is changed to create the desired logical processor utilization.
This workload consists of a single AWM client connected to the desired number of DayTrader servers through a local VSWITCH in the same logical partition.
For this experiment the AWM client has 4 virtual processors, 1 GB of virtual storage, and a relative share setting of 10000. For this experiment each DayTrader server has 2 virtual processors, 1 GB of virtual storage, and a relative share setting of 100.
There are 46 DayTrader servers in the non-SMT measurement and 116 DayTrader servers in the SMT-2 measurement. These increased servers will have an effect on the measured AWM response time.
This workload provides a good demonstration of the value of SMT-2 for a workload with no specific serialization.
For this workload SMT-2 provided a 12% increase in transaction rate, a 19% increase in ITR, a 172% increase in average response time, and a 5.3% decrease in processor utilization.
Average thread density for the SMT-2 measurement was 1.89.
Table 3. SMT-2 Maximum Processor
| Run ID | DT1AU03 | DT2AU12 | Delta | Pct |
| Multithreading | disabled | enabled | ||
| DayTrader servers | 46 | 116 | 70 | 152.2 |
| ETR | 2447.40 | 2763.64 | 316.24 | 12.9 |
| ITR | 2512.73 | 2997.44 | 484.71 | 19.3 |
| AWM avg resp time | 0.021897 | 0.059584 | 0.037687 | 172.1 |
| Total util/proc | 97.4 | 92.2 | -5.2 | -5.3 |
| SMT-2 avg thread density | na | 1.89 | ||
| Notes: z/VM 6.3 with VM65586; 2964-NC9; 32 dedicated IFL cores; 256 GB central storage; storage-rich; DayTrader workload; 1 AWM client (4 virtual CPUs, 1 GB, 10000 relative share); DayTrader servers (2 virtual CPUs, 1 GB, 100 relative share); 1 AWM connection to each server; Linux RedHat 6.0. | ||||
LINUX-only Mode Partition with a Single Processor Serialization Application
The first two data columns in Table 4 contain a comparison of selected values between SMT-2 and non-SMT for an Apache workload that is serialized by the number of virtual processors available for the AWM clients.
Because this workload has a single point of serialization, the results indicate that it is not a good candidate for SMT-2 without mitigation. The workload consists of 3 AWM clients each with a single virtual processor. In non-SMT, average client utilization was 70%, so one would predict needing more than 100% with SMT-2.
There are 12 Apache servers each with a single virtual processor. With non-SMT the average server utilization is only 6% so no serialization is expected.
For this workload SMT-2 provided a 35% decrease in transaction rate, a 1% increase in ITR, a 37% decrease in processor utilization, and a 45% increase in AWM response time.
Average thread density for the SMT-2 measurement was 1.28.
With SMT-2 the AWM client virtual processors reached 100% utilization at a lower workload throughput than with non-SMT.
Serialization for this workload can be removed by adding virtual processors to the existing clients or by adding more client virtual machines. The third and fourth columns of Table 4 contain results for these two methods of removing the serialization.
For the measurement in the third data column of Table 4, an additional virtual processor was added to the existing 3 AWM clients. This increases the total AWM client virtual processors from 3 to 6. Overall results for this experiment show a 64% increase in transaction rate, an 8% increase in ITR, a 50% increase in processor utilization, and a 38% decrease in AWM response time. Average thread density for this measurement was 1.95. These results are now better than the original non-SMT measurement.
For the measurement in the fourth data column of Table 4, 3 additional AWM clients were added to the original SMT-2 configuration. This increases the total AWM client virtual processors from 3 to 6. It also increases the number of AWM sessions from 36 to 72. The increased sessions will tend to increase the AWM response time. Compared to the original SMT-2 measurement, overall results for this experiment show a 100% increase in transaction rate, a 28% increase in ITR, a 56% increase in processor utilization, and a 17% increase in AWM response time. Average thread density for this measurement was 1.99. These results are now better than the original non-SMT measurement.
The following is a discussion about multithreading metrics.
- The SMT productivity value indicates whether all SMT capacity of the core has been consumed. A value less than 1.0 indicates that it might be possible to get additional core throughput by increasing core utilization. A core busy value near 100% with a low thread density has more capacity than one with high core utilization and high thread density. If core thoughput is higher when both threads are in use than when only one thread is in use, then the core throughput might increase as thread density increases.
- SMT capacity factor values above 1.0 provide an indication of how much higher core throughput is when both threads are active compared to when only one thread is active. It varies relative to levels of contention for core resources between the instruction streams running on the two threads, levels of cache contention, and other factors that influence core efficiency. SMT capacity factor is not an indication of how well the overall workload performs when SMT is enabled, as can be seen by comparing the SMT capacity factor and ETR values for the set of runs. The mitigation approaches in these cases resulted in significant changes in the mix of work running on the cores so that a comparison of the SMT capacity factors in isolation could be misleading. From an overall workload perspective the ETR is a more important metric.
-
An SMT maximum capacity value larger than the SMT capacity factor
indicates that the core might
be able to accomplish more work* as thread
density increases.
Both values are based on data collected only while at
least one thread is active.
As the thread
density approaches either of its limits,
the values might become less reliable because
of limited data for one of the cases.
This might have been a factor in
this workload because core utilization is very high.
* The term work is used to describe a relative instruction completion rate. It is not intended to describe how much work a workload is actually accomplishing.
Table 4. Serialized Application
| Run ID | APNDGLD0 | APNDGLD1 | APNDGLDF | APNDGLDD |
| Multithreading | disabled | enabled | enabled | enabled |
| Logical processors | 3 | 6 | 6 | 6 |
| AWM clients | 3 | 3 | 3 | 6 |
| AWM client virt proc | 1 | 1 | 2 | 1 |
| Total client virt proc | 3 | 3 | 6 | 6 |
| ETR ratio | 1.000 | 0.649 | 1.065 | 1.303 |
| ITR ratio | 1.000 | 1.017 | 1.102 | 1.305 |
| ETR | 7787.11 | 5051.55 | 8292.57 | 10143.94 |
| ITR | 8128.51 | 8267.68 | 8955.26 | 10610.82 |
| AWM avg resp time | 0.004897 | 0.007102 | 0.004388 | 0.008332 |
| Total util/proc | 95.8 | 61.1 | 92.6 | 95.6 |
| AWM client util | 70.4 | 95.4 | 143.7 | 73.6 |
| Apache server util | 6.19 | 6.53 | 10.2 | 10.8 |
| SMT-2 IFL core busy % | 95.8 | 95.5 | 95.1 | 95.7 |
| SMT-2 Avg IFL thread density | na | 1.28 | 1.95 | 1.99 |
| SMT-2 productivity | na | 0.9 | 0.98 | 1.0 |
| SMT-2 capacity factor | na | 1.04 | 1.49 | 1.07 |
| SMT-2 maximum capacity factor | na | 1.15 | 1.51 | 1.07 |
| Notes: z/VM for z13; 2964-NC9; 3 dedicated IFL cores; 12 GB central storage; storage-rich; Apache workload; 12 Apache servers (1 virtual CPU, 10 GB); 1 AWM connection to each server; 2 URL files; Linux SLES11 SP1; 15 KB avg URL size. | ||||
LINUX-only Mode Partition with a z/VM Master Processor Serialization Application
Table 5 contains a comparison of selected values between SMT-2 and non-SMT for a workload that is serialized by the z/VM master processor.
The Master Processor Exerciser was used to evaluate the effect of multithreading on applications having a z/VM master processor requirement. The workload consists of an application that requires use of the z/VM master processor in each transaction. In a LINUX-only mode partition, both the master and the non-master portion of the workload execute on logical IFL processors, therefore the master logical processor is one thread of an IFL core. Because this workload has a serialization point, it is a good workload to study to see the effect SMT can have on serialized workloads.
For this workload SMT-2 provided a 17% decrease in transaction rate, a 97% increase in ITR, and a 58% decrease in processor utilization.
This is a good example of an SMT-2 ITR value that is not very meaningful.
z/VM master processor utilization decreased 2.8%.
Average thread density for the SMT-2 measurement was 1.20.
Table 5. Linux-only Partition Master Application
| Run ID | STXS210E | STXS210F | Delta | Pct |
| Multithreading | disabled | enabled | ||
| Logical processors | 4 | 8 | 4 | 100.0 |
| Master util/proc | 100.1 | 97.3 | -2.8 | -2.8 |
| Total util/proc | 80.2 | 33.4 | -46.8 | -58.4 |
| ETR | 1572.70 | 1291.00 | -281.70 | -17.9 |
| ITR | 1960.97 | 3865.27 | 1904.30 | 97.1 |
| SMT-2 avg thread density | na | 1.20 | ||
| Notes: z/VM for z13; 2964-NC9; 4 dedicated IFL cores; 30 GB central storage; storage-rich; 8 VIRSTOMP users (8 virtual CPUs, 144 GB) VIRSTOMP parameters (I=1024KB,E=144GB,C=8,B=1). | ||||
z/VM-mode Partition with a z/VM Master Processor Serialization Application
Table 6 contains a comparison of selected values between SMT-2 and non-SMT for a workload that is serialized by the z/VM master processor.
The same Master Processor Exerciser used with the LINUX-only mode partition was used to evaluate the effect of multithreading on applications having a z/VM master processor requirement in a z/VM-mode partition. The workload consists of an application that requires use of the z/VM master processor in each transaction. In a z/VM-mode partition, the z/VM master processor is on a logical CP processor, which always is on a non-SMT core, but the non-master portion of the workload executes on logical IFL processors, which run on SMT-2 cores. Because this workload has a serialization point, it is a good workload to study to see the effect SMT can have on serialized workloads.
For this workload SMT-2 provided a 28% decrease in transaction rate, a 63% increase in ITR, and a 56% decrease in processor utilization.
z/VM master processor utilization decreased 27%. No specific reason is yet known for this low master processor utilization.
Although no detail is provided in this article, the results in Table 5 and Table 6 provide a valid comparison between a LINUX-only mode partition and a z/VM-mode partition.
Average thread density for the SMT-2 measurement was 1.16.
Table 6. z/VM-Mode Partition Master Application
| Run ID | STXS210G | STXS210H | Delta | Pct |
| Multithreading | disabled | enabled | ||
| Logical processors | 6 | 10 | 4 | 66.7 |
| Logical IFLs | 4 | 8 | 4 | 100.0 |
| Logical CP | 2 | 2 | 0 | 0.0 |
| ETR | 337.50 | 240.40 | -97.10 | -28.8 |
| ITR | 881.20 | 1439.52 | 558.32 | 63.4 |
| Total util/proc | 38.3 | 16.7 | -21.6 | -56.4 |
| Master util/proc | 100.1 | 72.2 | -27.9 | -27.9 |
| CP Total util/proc | 50.3 | 36.3 | -14.0 | -27.8 |
| IFL Total util/proc | 32.3 | 11.8 | -20.5 | -63.5 |
| SMT-2 Avg IFL thread density | na | 1.16 | ||
| Notes: z/VM for z13; 2964-NC9; 4 dedicated IFL cores; 2 dedicated CP cores; 30 GB central storage; storage-rich; 8 VIRSTOMP users (8 virtual CPUs, 144 GB); VIRSTOMP parameters (I=1024 KB,E=144 GB,C=8,B=1). | ||||
z/VM Apache CPU Pooling Workload
Table 7 contains a comparison of selected values between SMT-2 and non-SMT for a CPU pooling workload.
See CPU Pooling for information about the Apache CPU pooling workload and previous results.
A workload with both CAPACITY-limited CPU pools and LIMITHARD-limited CPU pools was selected because it provided the most comprehensive view.
With SMT-2, CAPACITY-limited CPU pools are limited based on the utilization of threads rather than utilization of cores so reduced capacity is expected.
With SMT-2, LIMITHARD-limited CPU pools are based on a percentage of the available resources, so when the number of logical processors doubles, their maximum utilization will double.
The measured workload has 6 AWM clients that are not part of any CPU pool. Each AWM client has 1 virtual processor. There are 16 Apache servers, each with 4 virtual processors. The 16 Apache servers are divided into four CPU pools, two limited by capacity and two limited by LIMITHARD. Each CPU pool has four Apache servers.
The CAPACITY-limited CPU pools are entitled to 40% of a core in non-SMT and SMT-2 environments. However in SMT-2, the limiting algorithm used thread time and thus was limited to 40% of a thread. The LIMITHARD-limited CPU pools are entitled to 5% of the existing resources which is 40% of a core with non-SMT and 80% of a thread with SMT-2. Thus entitlement of the CPU pools was identical in non-SMT but they are no longer identical in SMT-2.
In the non-SMT measurement, utilizations for the 4 pools were identical and equal to their entitled amount. In the SMT-2 measurement, utilizations differ widely between the two types of CPU pools.
With SMT-2, utilizations of the CAPACITY-limited CPU pools decreased 2%. With SMT-2, utilizations of the LIMITHARD-limited CPU pools increased 29%.
With SMT-2, none of the 4 CPU pools consumed their entitled utilization. The primary reason for not reaching their entitled utilization in this experiment is serialization in the AWM clients. Average utilization of the 6 AWM virtual processors approached 100% in the SMT-2 measurement and prevented the Apache servers from reaching their entitled utilization.
For this workload SMT-2 provided a 5.5% decrease in transaction rate, a 57% increase in ITR, a 40% decrease in processor utilization, and an 8.7% increase in AWM response time.
Average thread density for the SMT-2 measurement was 1.20.
Results indicate that caution is needed for CPU pooling workloads with SMT-2.
| Run ID | APLDGLD2 | APLDGLD6 | Delta | Pct |
| Multithreading | disabled | enabled | ||
| Logical processors | 8 | 16 | 8 | 100.0 |
| CPUPOOL1 limit type | LIMITHARD | LIMITHARD | ||
| CPUPOOL2 limit type | LIMITHARD | LIMITHARD | ||
| CPUPOOL3 limit type | CAPACITY | CAPACITY | ||
| CPUPOOL4 limit type | CAPACITY | CAPACITY | ||
| CPUPOOL1 max sh | 4.99878 | 4.99878 | 0.00000 | 0.0 |
| CPUPOOL2 max sh | 4.99878 | 4.99878 | 0.00000 | 0.0 |
| CPUPOOL3 max sh | 39.99939 | 39.99939 | 0.00000 | 0.0 |
| CPUPOOL4 max sh | 39.99939 | 39.99939 | 0.00000 | 0.0 |
| CPUPOOL1 mean %util | 38.78863 | 50.28028 | 11.49165 | 29.6 |
| CPUPOOL2 mean %util | 38.81830 | 49.96539 | 11.14709 | 28.7 |
| CPUPOOL3 mean %util | 38.83480 | 37.89933 | -0.93547 | -2.4 |
| CPUPOOL4 mean %util | 38.83230 | 38.03735 | -0.79495 | -2.0 |
| CPUPOOL1 max %util | 39.99057 | 54.70999 | 14.71942 | 36.8 |
| CPUPOOL2 max %util | 39.99059 | 58.76215 | 18.77156 | 46.9 |
| CPUPOOL3 max %util | 39.99990 | 39.99968 | -0.00022 | 0.0 |
| CPUPOOL4 max %util | 39.99989 | 40.00057 | 0.00068 | 0.0 |
| ETR | 10869.13 | 10269.44 | -599.69 | -5.5 |
| ITR | 13535.65 | 21350.19 | 7814.54 | 57.7 |
| AWM avg resp time | 0.009208 | 0.010010 | 0.000802 | 8.7 |
| Total util/proc | 80.3 | 48.1 | -32.2 | -40.1 |
| AWM client util | 80.269 | 97.000 | 16.731 | 20.8 |
| SMT-2 avg thread density | na | 1.20 | ||
| Notes: z/VM for z13; 2964-NC9; 8 dedicated IFL cores; 128 GB central storage; storage-rich; Apache workload; Linux SLES11 SP1; 6 AWM clients (1 virtual CPU, 1 GB); 16 Apache servers (1 virtual CPU, 10 GB); 1 AWM connection to each server; 4 CPU pools (4 Apache servers in each); 10000 URL files; 1 MB avg URL size. | ||||
Live Guest Relocation Workload
Table 8 contains a comparison of selected values between SMT-2 and non-SMT for a 25-user live guest relocation workload. This workload provides a good demonstration of various characteristics of the SSI infrastructure on the z13 and factors that affect live guest relocation with SMT-2.
See Live Guest Relocation for information about the live guest relocation workload and previous results.
This evaluation was completed by relocating 25 identical Linux guests. Each guest had 2 virtual processors and 4 GB of virtual storage. Each guest was running the PING, PFAULT, and BLAST applications. PING provides network I/O. PFAULT uses processor cycles and randomly references storage, thereby constantly changing storage pages. BLAST generates application I/O.
Relocations were done synchronously using the SYNC option of the VMRELOCATE command.
The measurement was completed in a two-member SSI cluster with identical configurations and connected by an ISFC logical link made up of 16 CTCs on four FICON CTC 8 Gb CHPIDs.
There was no other active work on either the source or destination system.
Compared to the non-SMT measurement, average quiesce time increased 25% and total relocation time increased 9.8%.
Average thread density for the SMT-2 measurement was 1.71.
Several independent factors influenced these relocation results.
-
Some of
the running applications showed an improvement with SMT-2.
The BLAST application showed a
34%
increase in completions, and
the
PFAULT application
showed a
71%
increase
in completions.
The PING completions were nearly identical.
-
The total number of relocation passes decreased
15%.
With non-SMT the
number of passes varied over time.
The early relocating guests were
around the maximum (16), the number slowly declined,
and the last few
guests to relocate were around the maximum number of passes when no
progress is being observed (8).
With SMT-2
nearly every user was close to the 8 passes, so progress is not being
made.
The ability of the application to change more pages is likely the reason
for the change in passes.
-
Despite the decrease in the total number of passes, the total
number of relocated pages increased
12%. SMT-2 provided
the ability for
the applications to change pages faster and thus more
pages were relocated in the intermediate passes (2 through N-2).
-
The total number of pages relocated during quiesce increased
51%
and
is thus a factor for the increased quiesce time. Because this results from
the ability of the application to change pages faster, perhaps
increased
quiesce time is an expected and acceptable effect.
- Quiesce time is also affected by serialized code paths running on a thread rather than on a core.
Table 8. Live Guest Relocation
| Run ID | GLDS1153 | GLDS1155 | Delta | Pct |
| Multithreading | disabled | enabled | ||
| Logical processors | 4 | 8 | 4 | 100.0 |
| Avg relocate time (Usec) | 5772582 | 6326926 | 554344 | 9.6 |
| Avg quiesce time (USec) | 707176 | 890503 | 183327 | 25.9 |
| PFAULT completions | 13610610 | 23389467 | 9778857 | 71.8 |
| BLAST completions | 695 | 933 | 238 | 34.2 |
| PING completions | 520 | 522 | 2 | 0.4 |
| Total memory move passes | 241 | 203 | -38 | -15.7 |
| Total pages moved | 27418394 | 30959480 | 3541086 | 12.9 |
| Pages moved during quiesce | 1731296 | 2627289 | 895993 | 51.7 |
| SMT-2 avg thread density | na | 1.71 | ||
| Notes: z/VM for z13; 2964-NC9; 4 dedicated IFL cores; 51 GB central storage; storage-rich; Linux workload; 25 Linux servers (2 virtual CPUs, 4 GB); Linux SLES10 SP2; Linux server applications (PFAULT, PING, BLAST); ISFC logical link (16 CTCs, 4 FICON CHPIDs, 8 Gb). | ||||
Summary and Conclusions
- Results in measured workloads varied widely.
- Best results were observed for applications having highly parallel activity and no single point of serialization.
- No improvements were observed for applications having a single point of serialization.
- To overcome serialization, workload adjustment should be done where possible.
- Workloads that have a heavy dependency on the z/VM master processor are not good candidates for SMT-2. In z/VM Performance Toolkit, the master processor can be identified from FCX100 CPU and FCX180 SYSCONF.
- Results indicate that caution is needed for CPU pooling workloads with SMT-2.
- The multithreading metrics provide information about how well the cores perform when SMT is enabled, but they do not take into consideration other factors that influence workload throughput. The values reported by the metrics are directly related to core utilization, thread density and ITR. There is no direct relationship with ETR or with transaction response time.
- As core utilization and thread density increase, core efficiency might decrease. Using ITR to extrapolate remaining capacity could be misleading. Therefore, using ITR to predict remaining partition capacity might be overly optimistic. The workloads reported above were steady state workloads.
- Measuring workload throughput and response time is the best way to know whether SMT is providing value to the workload.
Back to Table of Contents.
System Scaling Improvements
Abstract
On z13, z/VM for z13 is supported in an LPAR consisting of up to 64 logical CPUs. To validate scaling IBM used one WAS-based workload, two Apache-based workloads, and selected microbenchmarks that validated scaling improvements carried out against three known problem areas. The WAS-based workload showed correct scaling up to 64 logical CPUs, whether running in non-SMT mode or in SMT-2 mode. The Apache-based workloads showed correct scaling up to 64 logical CPUs provided 32 or fewer cores were in use, but in runs beyond 32 cores there was some rolloff. The microbenchmarks showed acceptable levels of constraint relief.
Introduction
In z/VM for z13 and the PTF for APAR VM65696 IBM made improvements in the ability of z/VM to run in LPARs containing multiple logical CPUs.
This chapter describes the workloads IBM used to evaluate the new support and the results obtained in the evaluation.
Background
In z/VM for z13 and the PTF for APAR VM65696 IBM made improvements in the ability of z/VM to run in LPARs containing multiple logical CPUs. Improvements were made in all of the following areas:
- Use of the scheduler lock.
The situations in which the
scheduler lock had to be held exclusive were decreased.
This
decreased opportunity for scheduler lock contention and
increased opportunity for parallelism
in accessing scheduler data structures
such as the dispatch list.
In APAR VM65696
the scheduler lock was moved
to its own cache lines.
- Use of the NDMBK lock.
The NDMBK is a control block used
to hold data moving through a guest LAN or VSWITCH.
A set of free, preallocated NDMBKs is kept on hand
so as to reduce calls to the z/VM Control Program's
free storage manager. The data structure used to hold
this set of preallocated NDMBKs was changed
to decrease opportunity for lock contention.
- Guest PTE serialization.
For a certain Linux memory thrashing
workload used in IBM z/VM Performance,
Endicott, it was observed that several of the guest
virtual CPUs were all attempting to issue ISKE against
the same guest page at the same time.
Because guest ISKE is simulated, this in turn caused
z/VM on several logical CPUs to try concurrently
to acquire a lock on the guest PTE.
The technique
used for locking a guest PTE was changed
to decrease opportunity for lock contention.
- VDISK locking.
When it handles a guest's request to do I/O
to a VDISK, z/VM must translate the guest's channel program and
then move data between the guest's storage and the address space
holding the VDISK's data.
The code that processes the guest's channel program was changed
to increase efficiency of CCW translation and
to decrease opportunity for lock contention.
- Real storage management improvements. z/VM's real storage manager maintains per-logical-CPU short lists of free, cleared 4 KB frames that the CPC millicode or the z/VM Control Program can use to resolve first-time page faults. The logic that keeps these lists filled was improved to replenish them in a more timely, demand-sensitive way, thus decreasing their likelihood of going empty and thereby increasing the opportunity for parallelism in fault resolution. Also, RSA2GLCK was moved so it is now alone in its own cache line.
To evaluate these changes IBM used several different workloads. In most cases the workloads were chosen for their ability to put stress onto specifically chosen areas of the z/VM Control Program. One other workload, a popular benchmark called DayTrader, was used for contrast.
Method
To evaluate the scaling characteristics of z/VM for z13, six workloads were used. This section describes the workloads and configurations.
A typical run lasted ten minutes once steady-state was reached. Workload driver logs were collected and from those logs ETR was calculated. MONWRITE data, including CPU MF host counters, was always collected. Lab-mode sampler data was collected if the experiment required it.
Unless otherwise specified, all runs were done in a dedicated Linux-only mode LPAR with only one LPAR activated on the CPC.
DayTrader
The DayTrader suite is a popular benchmark used to evaluate performance of WAS-DB/2 deployments. A general description can be found in our workload appendix.
The purpose of running DayTrader for this evaluation was to check scaling of z/VM for z13 using a workload customers might recognize and which is not necessarily crafted to stress specific areas of the z/VM Control Program. In this way we hope our runs of DayTrader might offer customers more guidance than do the results obtained from the targeted workloads we often run for z/VM Control Program performance evaluations.
In this workload all Linux guests were Red Hat 6.0. Our AWM client machine was a virtual 4-way with 1024 MB of guest storage. Our WAS-DB/2 server machines were virtual 2-ways with 1024 MB of guest storage. To scale up the workload we added WAS-DB/2 servers and configured the client to drive all servers. Table 1 gives the counts used.
| Table 1. DayTrader configurations. | |||||||
| Cores | 3 | 8 | 16 | 24 | 32 | 48 | 64 |
| AWM clients | 1 | 1 | 1 | 1 | 1 | 1 | 1 |
| WAS-DB/2 servers | 4 | 12 | 22 | 36 | 46 | 72 | 90 |
| Notes: None. | |||||||
These runs were all done on a z13, 2964-NC9, storage-rich.
For each number of cores, runs were done in non-SMT and SMT-2 configurations, except that for LPARs exceeding 32 cores, SMT-2 runs were not done. This is because the support limit for z/VM for z13 is 64 logical CPUs.
All runs were done with a z/VM 6.3 internal driver built on November 13, 2014. This driver contained the z13 exploitation PTF.
For this workload ETR is defined to be the system's aggregate DayTrader transaction rate, scaled by a constant.
Apache CPU Scalability
Apache CPU Scalability consists of Linux client guests running Application Workload Modeler (AWM) communicating with Linux server guests running the Apache web server. All Linux guests were SLES 11 SP 1. The client guests are all virtual 1-ways with 1 GB of guest real. The server guests are all virtual 4-ways with 10 GB of guest real. The ballast URIs are chosen so that the HTTP serving is done out of the Linux server guests' file caches. The workload is run storage-rich, has no think time, and is meant to run the LPAR completely busy.
Apache CPU Scalability is used to look for problems in the z/VM scheduler or dispatcher, such as problems with the scheduler lock. Because it uses virtual networking to connect the clients and the servers, it will also find problems in that area.
Table 2 shows the configurations used.
| Table 2. Apache CPU Scalability Configurations | |||||
| Cores | 4 | 8 | 16 | 32 | 64 |
| Central storage, MB | 65536 | 131072 | 262144 | 524288 | 1048576 |
| AWM clients | 3 | 6 | 12 | 24 | 48 |
| AWM servers | 8 | 16 | 32 | 64 | 128 |
| Notes: None. | |||||
These runs were all done on a z13, 2964-NC9.
For each number of cores, runs were done in non-SMT and SMT-2 configurations, except that for LPARs exceeding 32 cores, SMT-2 runs were not done. This is because the support limit for z/VM for z13 is 64 logical CPUs.
Base runs were done using z/VM 6.3 plus all closed service, built on January 30, 2015. This build contained the z13 compatibility SPE PTF from APAR VM65577.
Comparison runs were done using a z/VM 6.3 internal driver built on March 4, 2015. This build contained the z/VM z13 exploitation PTF from APAR VM65586 and the PTF from APAR VM65696.
For this workload ETR is defined to be the system's aggregate HTTP transaction rate, scaled by a constant.
Apache DASD Paging
Apache DASD Paging consists of Linux client guests running Application Workload Modeler (AWM) communicating with Linux server guests running the Apache web server. All Linux guests were SLES 11 SP 1. The client guests are all virtual 1-ways with 1 GB of guest real. The server guests are all virtual 4-ways with 10 GB of guest real. The ballast URIs are chosen so that the HTTP serving is done out of the Linux server guests' file caches. There is always 16 GB of central, and there are always 24 Linux client guests, and there are always 32 Linux server guests. The workload has no think time delay, but owing to paging delays the LPAR does not run completely busy.
Apache DASD Paging is meant for finding problems in z/VM storage management. The virtual-to-real storage ratio is about 21:1. The instantiated-to-real storage ratio is about 2:1. Because of its level of paging, T/V is somewhat higher than we would usually see in customer MONWRITE data.
These runs were all done on a z13, 2964-NC9.
For each number of cores, runs were done in non-SMT and SMT-2 configurations, except that for LPARs exceeding 32 cores, SMT-2 runs were not done. This is because the support limit for z/VM for z13 is 64 logical CPUs.
Base runs were done using z/VM 6.3 plus all closed service, built on January 30, 2015. This build contained the z13 compatibility SPE PTF from APAR VM65577.
Comparison runs were done using a z/VM 6.3 internal driver built on March 4, 2015. This build contained the z/VM z13 exploitation PTF from APAR VM65586 and the PTF from APAR VM65696.
For this workload ETR is defined to be the system's aggregate HTTP transaction rate, scaled by a constant.
Microbenchmark: Guest PTE Serialization
The z/VM LPAR was configured with 39 logical processors and was storage-rich. One Linux guest, SLES 11 SP 3, was defined with 39 virtual CPUs and enough virtual storage so Linux would not swap. The workload inside the Linux guest consisted of 39 instances of the Linux application memtst. This application is a Linux memory allocation workload that drives a high demand for the translation of guest pages.
All runs were done on a zEC12, 2827-795.
The base case was done with z/VM 6.3 plus all closed service as of August 6, 2013.
The comparison case was done on an IBM internal z/VM 6.3 driver built on February 20, 2014 with the PTE serialization fix applied. This fix is included in the z13 exploitation SPE.
ETR is not collected for this workload. The only metric of interest is CPU utilization incurred spinning while trying to lock PTEs.
Microbenchmark: VDISK Serialization
The VDISK workload consists of 10n virtual uniprocessor CMS users, where n represents the number of logical CPUs in the LPAR. Each user has one 512 MB VDISK defined for it. Each user runs the CMS DASD I/O generator application IO3390 against its VDISK, paced to run at 1233 I/Os per second, with 100% of the I/Os being reads.
The per-user I/O pace was chosen as follows. IBM searched its library of customer-supplied MONWRITE data for the customer system that had the highest aggregate virtual I/O rate we had record of ever having seen. From this we calculated said system's I/O rate per logical CPU in its LPAR. We then assumed ten virtual uniprocessor guests per logical CPU as a sufficiently representative ratio for customer environments. By arithmetic we calculated each user in our experiment ought to run at 1233 virtual I/Os per second.
All runs were done on a zEC12, 2827-795.
The base runs were done on z/VM 6.3 plus all closed service as of August 6, 2013.
The comparison runs were done on an IBM internal z/VM 6.3 driver built on January 31, 2014 with the VDISK serialization fix applied. This fix is included in the z13 exploitation SPE.
For this workload ETR was defined to be the system's aggregate virtual I/O rate to its VDISKs, scaled by a constant.
Microbenchmark: Real Storage Management Improvements
The real storage management improvements were evaluated using a VIRSTOR workload configured to stride through guest storage at a high rate. The workload is run in a storage-rich LPAR so that eventually all guest pages used in the workload are instantiated and resident. At that point pressure on z/VM real storage management has concluded.
One version of this workload was run in a 30-way LPAR. This version used two different kinds of guests, each one touching some fraction of its storage in a loop. The first group consisted of twenty virtual 1-way guests, each one touching 9854 pages (38.5 MB) of its storage. The second group consisted of 120 virtual 1-way guests, each one touching 216073 pages (844 MB) of its storage.
Another version of this workload was run in a 60-way LPAR. This version of the workload used the same two kinds of guests as the previous version, but the number of guests in each group was doubled.
Two metrics are interesting in this workload. One metric is the engines spent spinning on real storage management locks as a function of time. The other is the amount of time needed for the workload to complete its startup transient.
All runs were done on a zEC12, 2827-795.
The base case was done with z/VM 6.3 plus all closed service as of August 6, 2013.
The comparison case was done on an IBM internal z/VM 6.3 driver built on May 7, 2014 with the real storage management improvements fix applied. This fix is included in the z13 exploitation SPE.
The z/VM Monitor was set for a sample interval of six seconds.
Results and Discussion
Expectation
For the WAS-based and Apache-based workloads, scaling expectation is expressed by relating the workload's ITR to what the z13 Capacity Adjustment Factor (CAF) coefficients predict. The CAF coefficient for an N-core LPAR tells how much computing power each of those N cores is estimated to be worth compared to the computing power available in a 1-core LPAR. For example, for z13 the MP CAF coefficient for N=4 is 0.890 which means that a 4-core LPAR is estimated to be able to deliver (4 x 0.890) = 3.56 core-equivalents of computing power. IBM assigns CAF coefficients to a machine based on how well the machine ran a laboratory reference workload at various N-core configurations. A machine's CAF coefficients appear in the output of the machine's Store System Information (STSI) instruction.
Figure 1 shows a graph that illustrates the ideal, linear, slope-1 scaling curve and the scaling curve predicted by the z13 CAF coefficients.
| Figure 1. Hypothetical z13 scaling curves. |
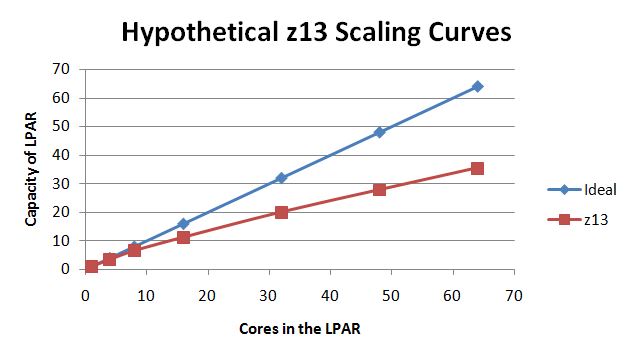
|
Expectation based on CAF scaling applies only to ITR values. ETR of a workload can be limited by many factors, such as DASD speed, network speed, available parallelism, or the speed of a single instruction stream.
For the microbenchmark workloads, our expectation is that the improvement would substantially or completely eliminate the discovered z/VM Control Program serialization problem.
DayTrader
Table 3 illustrates basic results obtained in the non-SMT DayTrader scaling suite.
| Table 3. DayTrader Results, non-SMT | |||||||
| Cores | 3 | 8 | 16 | 24 | 32 | 48 | 64 |
| Run ID | DTDBR03 | DTDBR06 | DTDBR0F | DTDBR07 | DTDBR04 | DTDBR08 | DTDBR05 |
| ETR | 278 | 652 | 1250 | 1833 | 2478 | 3566 | 4555 |
| ITR | 283 | 677 | 1315 | 1878 | 2579 | 3728 | 4791 |
| Avg logical PU %busy | 98.2 | 96.5 | 95.1 | 97.6 | 96.1 | 95.7 | 95.1 |
| T/V ratio | 1.01 | 1.01 | 1.01 | 1.02 | 1.02 | 1.04 | 1.09 |
| Notes: 2964-NC9; z/VM for z13. | |||||||
Table 4 illustrates basic results obtained in the SMT-2 DayTrader scaling suite.
| Table 4. DayTrader Results, SMT-2 | |||||
| Cores | 3 | 8 | 16 | 24 | 32 |
| Run ID | DTDBR09 | DTDBR0B | DTDBR0E | DTDBR0C | DTDBR0A |
| ETR | 351 | 847 | 1526 | 2200 | 2972 |
| ITR | 354 | 890 | 1663 | 2389 | 3236 |
| Avg logical PU %busy | 99 | 95 | 92 | 92 | 92 |
| T/V ratio | 1.01 | 1.01 | 1.02 | 1.02 | 1.03 |
| Notes: 2964-NC9; z/VM for z13. | |||||
Figure 2 illustrates the ETR achieved in the DayTrader scaling suite.
| Figure 2. DayTrader ETR scaling curves. 2964-NC9, dedicated LPAR, storage-rich. z/VM 6.3 with z13 exploitation SPE, non-SMT. z/VM 6.3 with z13 exploitation SPE, SMT-2. |
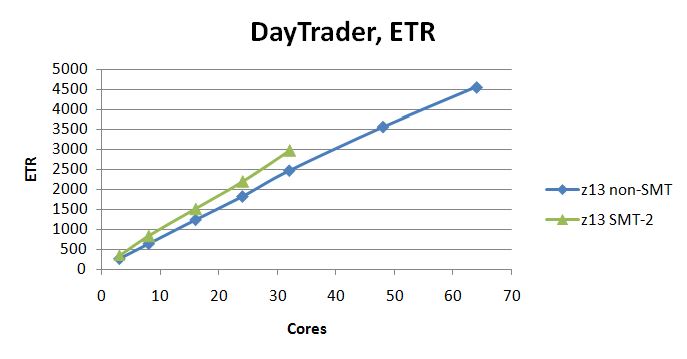
|
Figure 3 illustrates the ITR achieved in the DayTrader scaling suite. The curves marked CAF are the expectation curves formed by computing how the experiment's smallest run would have scaled up according to the CAF coefficients.
| Figure 3. DayTrader ITR scaling curves. 2964-NC9, dedicated LPAR, storage-rich. z/VM 6.3 with z13 exploitation SPE, non-SMT. z/VM 6.3 with z13 exploitation SPE, SMT-2. |
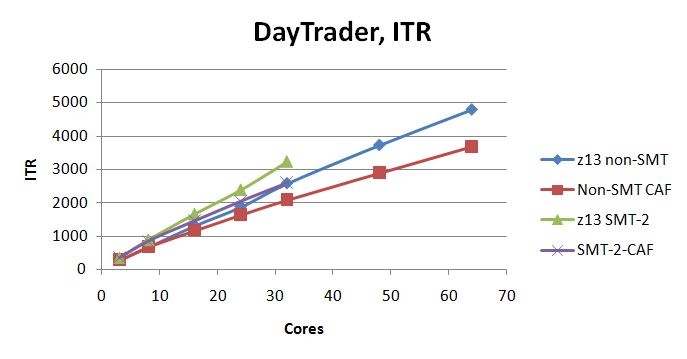
|
DayTrader scaled correctly up to 64 logical CPUs, whether non-SMT or SMT-2.
Apache CPU Scalability
Table 5 illustrates basic results from the Apache CPU Scalability suite, using z/VM 6.3 with only the z13 compatibility SPE.
| Table 5. Apache CPU Scalability Results, Compatibility | |||||
| Cores | 4 | 8 | 16 | 32 | 64 |
| Run ID | A04XPUX0 | A08XPUX0 | A16XPUX0 | A32XPUX0 | A64XPUX0 |
| ETR | 6849 | 11855 | 22234 | 16789 | na |
| ITR | 7335 | 12694 | 23568 | 17855 | na |
| Avg logical PU %busy | 93 | 93 | 94 | 95 | na |
| T/V ratio | 1.13 | 1.14 | 1.18 | 3.84 | na |
| Notes: 2964-NC9; z/VM 6.3 with VM65577. | |||||
Table 6 illustrates basic results from the Apache CPU Scalability suite, using z/VM for z13, non-SMT.
| Table 6. Apache CPU Scalability Results, non-SMT | |||||
| Cores | 4 | 8 | 16 | 32 | 64 |
| Run ID | A04XX0T0 | A08XX0T0 | A16XX0T0 | A32XX0T0 | A64XX0T0 |
| ETR | 6690 | 11714 | 22621 | 42123 | 37248 |
| ITR | 6878 | 12183 | 23158 | 43478 | 39698 |
| Avg logical PU %busy | 97 | 96 | 98 | 97 | 94 |
| T/V ratio | 1.13 | 1.13 | 1.15 | 1.27 | 2.97 |
| Notes: 2964-NC9; z/VM for z13 with VM65696. | |||||
Table 7 illustrates basic results from the Apache CPU Scalability suite, using z/VM for z13, SMT-2.
| Table 7. Apache CPU Scalability Results, SMT-2 | ||||
| Cores | 4 | 8 | 16 | 32 |
| Run ID | A04XX0T1 | A08XX0T1 | A16XX0T1 | A32XX0T1 |
| ETR | 5206 | 10048 | 19679 | 35048 |
| ITR | 10557 | 20374 | 40642 | 64320 |
| Avg logical PU %busy | 49 | 49 | 48 | 55 |
| T/V ratio | 1.13 | 1.16 | 1.19 | 1.42 |
| Notes: 2964-NC9; z/VM for z13 with VM65696. | ||||
Figure 4 illustrates the ETR scaling achieved in the Apache CPU Scalability suite.
| Figure 4. Apache CPU Scalability ETR scaling curves. 2964-NC9, dedicated LPAR, storage-rich. z/VM 6.3 with z13 compatibility SPE. z/VM 6.3 with z13 exploitation SPE and VM65696, non-SMT. z/VM 6.3 with z13 exploitation SPE and VM65696, SMT-2. |
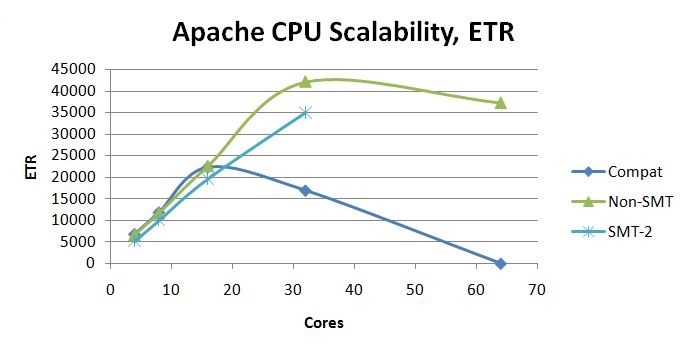
|
The ETR curve for SMT-2 tracks below the ETR curve for non-SMT. To investigate this we examined the 32-core runs. The reason for the result is that the AWM clients, which are virtual 1-ways, are completely busy and are running on logical CPUs that individually deliver less computing power than they did in the non-SMT case. See Table 8. For a discussion of mitigation techniques, see our SMT chapter.
| Table 8. Apache CPU Scalability, 32-core. | |||||
| Run ID | A32XX0T0 | A32XX0T1 | |||
| Cores | 32 | 32 | |||
| SMT configuration | non-SMT | SMT-2 | |||
| Clients | 24 | 24 | |||
| Client N-way | 1 | 1 | |||
| Client %busy each | 94.5 | 96.0 | |||
| Logical CPU avg %busy | 100 | 56 | |||
| CPU MF MIPS | 99565 | 85390 | |||
| Notes: 2964-NC9. z/VM for z13 with VM65696. | |||||
Figure 5 illustrates the ITR scaling achieved in the Apache CPU Scalability suite. The curves marked CAF are the expectation curves formed by computing how the experiment's smallest run would have scaled up according to the CAF coefficients.
| Figure 5. Apache CPU Scalability ITR scaling curves. 2964-NC9, dedicated LPAR, storage-rich. z/VM 6.3 with z13 compatibility SPE. z/VM 6.3 with z13 exploitation SPE and VM65696, non-SMT. z/VM 6.3 with z13 exploitation SPE and VM65696, SMT-2. |
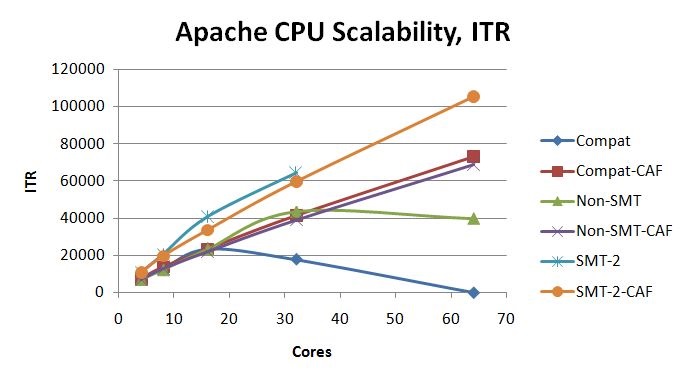
|
For z/VM 6.3 with merely the z13 compatibility SPE, the 64-core non-SMT run failed to operate and so ETR and ITR were recorded as zero.
For z/VM for z13 in non-SMT mode, the rolloff at 64 cores is explained by the behavior of the z13 CPC when the LPAR spans two drawers of the machine. Though L1 miss percent and path length remained fairly constant across the three runs, clock cycles needed to resolve an L1 miss increased to 168 cycles in the two-drawer case. This caused CPI to rise which in turn caused processing power available to the LPAR to drop. See Table 9. Field results will vary widely according to workload.
| Table 9. Apache CPU Scalability, non-SMT. | |||||
| Run ID | A16XX0T0 | A32XX0T0 | A64XX0T0 | ||
| Cores | 16 | 32 | 64 | ||
| Drawers | 1 | 1 | 2 | ||
| Infinite CPI | 1.15 | 1.17 | 1.22 | ||
| Finite CPI | 0.28 | 0.43 | 2.21 | ||
| Total CPI | 1.43 | 1.60 | 3.43 | ||
| L1 miss percent | 1.31 | 1.37 | 1.32 | ||
| Sourcing cycles per L1 miss | 21.02 | 30.78 | 168.21 | ||
| M inst per transaction | 2.418 | 2.376 | 2.555 | ||
| Notes: 2964-NC9. Dedicated LPARs, storage-rich. z/VM 6.3 with z13 exploitation SPE and VM65696, non-SMT. | |||||
Apache DASD Paging
Table 10 illustrates basic results from the Apache DASD Paging suite, using z/VM 6.3 with the z13 compatibility SPE.
| Table 10. Apache DASD Paging Results, Compatibility | |||||
| Cores | 4 | 8 | 16 | 32 | 64 |
| Run ID | A04DPUX0 | A08XDPU0 | A16DPUX0 | A32DPUX0 | A64DPUX0 |
| ETR | 319 | 315 | 327 | 262 | 121 |
| ITR | 352 | 583 | 827 | 289 | 222 |
| Avg logical PU %busy | 91 | 54 | 40 | 91 | 54 |
| T/V ratio | 1.59 | 1.92 | 2.87 | 18.28 | 34.9 |
| Notes: 2964-NC9; z/VM 6.3 with VM65577. | |||||
Table 11 illustrates basic results from the Apache DASD Paging suite, using z/VM for z13, non-SMT mode.
| Table 11. Apache DASD Paging Results, non-SMT | |||||
| Cores | 4 | 8 | 16 | 32 | 64 |
| Run ID | A04DX0T0 | A08DX0T0 | A16DX0T0 | A32DX0T0 | A64DX0T1 |
| ETR | 315 | 333 | 371 | 386 | 366 |
| ITR | 347 | 613 | 1190 | 1982 | 2499 |
| Avg logical PU %busy | 91 | 54 | 31 | 19 | 15 |
| T/V ratio | 1.56 | 1.79 | 1.99 | 2.74 | 3.22 |
| Notes: 2964-NC9; z/VM for z13 with VM65696. | |||||
Table 12 illustrates basic results from the Apache DASD Paging suite, using z/VM for z13, SMT-2 mode.
| Table 12. Apache DASD Paging Results, SMT-2 | ||||
| Cores | 4 | 8 | 16 | 32 |
| Run ID | A04DX0T2 | A08DX0T1 | A16DX0T1 | A32DX0T1 |
| ETR | 317 | 334 | 398 | 416 |
| ITR | 492 | 1017 | 2272 | 3954 |
| Avg logical PU %busy | 64 | 33 | 18 | 11 |
| T/V ratio | 1.65 | 1.84 | 1.95 | 2.46 |
| Notes: 2964-NC9; z/VM for z13 with VM65696. | ||||
Figure 6 illustrates the ETR scaling achieved in the Apache DASD Paging suite.
| Figure 6. Apache DASD Paging ETR scaling curves. 2964-NC9, dedicated LPAR, storage-constrained. z/VM 6.3 with z13 compatibility SPE. z/VM 6.3 with z13 exploitation SPE and VM65696, non-SMT. z/VM 6.3 with z13 exploitation SPE and VM65696, SMT-2. |
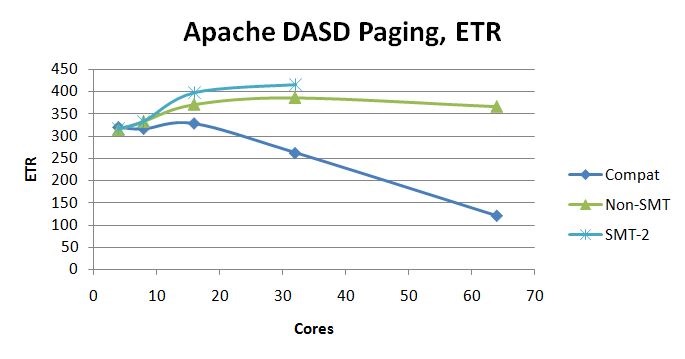
|
Figure 7 illustrates the ITR scaling achieved in the Apache DASD Paging suite. The curves marked CAF are the expectation curves formed by computing how the experiment's smallest run would have scaled up according to the CAF coefficients.
| Figure 7. Apache DASD Paging ITR scaling curves. 2964-NC9, dedicated LPAR, storage-constrained. z/VM 6.3 with z13 compatibility SPE. z/VM 6.3 with z13 exploitation SPE and VM65696, non-SMT. z/VM 6.3 with z13 exploitation SPE and VM65696, SMT-2. |
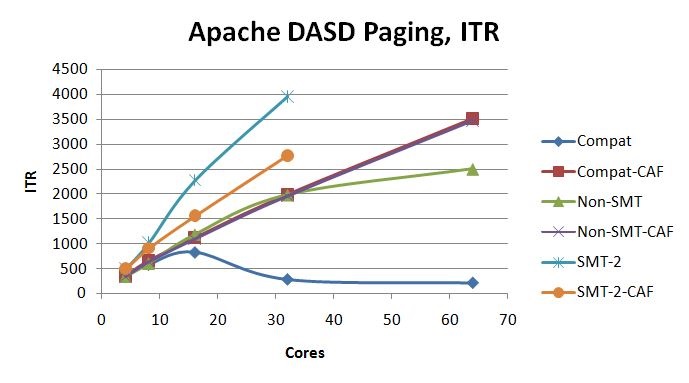
|
For z/VM for z13 in non-SMT mode, the rolloff at 64 cores is due to a number of factors. Compared to the 32-core run, CPI is increased 7% and path length is increased 26%. As illustrated by Table 13, the growth in CPU time per transaction is in the z/VM Control Program. Areas of interest include CPU power spent spinning on the HCPPGDAL lock and CPU power spent spinning on the SRMATDLK lock.
| Table 13. Apache DASD Paging, non-SMT. | |||||
| Run ID | A16DX0T0 | A32DX0T0 | A64DX0T1 | ||
| Cores | 16 | 32 | 64 | ||
| Drawers | 1 | 1 | 2 | ||
| Infinite CPI | 1.17 | 1.09 | 1.07 | ||
| Finite CPI | 1.56 | 1.96 | 2.20 | ||
| Total CPI | 2.73 | 3.05 | 3.27 | ||
| L1 miss percent | 5.37 | 4.57 | 4.28 | ||
| Sourcing cycles per L1 miss | 28.95 | 43.11 | 52.87 | ||
| M inst per transaction | 22.3 | 26.0 | 32.9 | ||
| SIEs per second | 768591 | 728909 | 739401 | ||
| Guest busy/tx (p) | 0.6748 | 0.5887 | 0.6291 | ||
| Chargeable CP busy/tx (p) | 0.4208 | 0.5835 | 0.6663 | ||
| Nonchargeable CP busy/tx (p) | 0.2494 | 0.4423 | 0.7299 | ||
| T/V ratio | 1.99 | 2.74 | 3.22 | ||
| SRMSLOCK coll/sec | 1107 | 2087 | 2723 | ||
| SRMSLOCK usec/coll | 2.3 | 11.9 | 33.3 | ||
| SRMSLOCK spin %busy | 0.26 | 2.48 | 9.07 | ||
| HCPPGDAL coll/sec | 18858 | 17848 | 19225 | ||
| HCPPGDAL usec/col | 4.82 | 7.01 | 9.71 | ||
| HCPPGDAL spin %busy | 9.1 | 12.5 | 18.67 | ||
| SRMATDLK coll/sec | 1791 | 3680 | 5534 | ||
| SRMATDLK usec/coll | 15.1 | 29.8 | 43.2 | ||
| SRMATDLK spin %busy | 2.7 | 11.0 | 23.9 | ||
| Notes: 2964-NC9. Dedicated LPARs, storage-constrained. z/VM 6.3 with z13 exploitation SPE and VM65696, non-SMT. | |||||
Microbenchmark: Guest PTE Serialization
Table 14 shows the result of the guest PTE serialization experiment. CPU time spent spinning in PTE serialization was decreased from 37 engines' worth to 4.5 engines' worth.
| Table 14. Guest PTE Serialization Result | |||||
| Run ID | L9XB110 | L9392200 | |||
| %Busy spinning in locking PTEs | 3700 | 450 | |||
| Notes: zEC12 2827-795. Dedicated LPAR with 39 logical CPUs. LPAR is storage-rich. Linux guest is 39 virtual CPUs and storage-rich. Linux SLES 11 SP 3 with memtst application. Base case is z/VM 6.3 as of August 6, 2013. Comparison case is z/VM 6.3 internal driver of February 20, 2014 with PTE serialization fix applied. | |||||
The PTE serialization improvement met expectation.
Microbenchmark: VDISK Serialization
Figure 8 shows the VDISK workload's ETR as a function of number of cores.
| Figure 8. VDISK scaling workload ETR. zEC12, storage-rich dedicated LPAR. z/VM 6.3 unmodified (SPA806_10_5). z/VM 6.3 including VDISK serialization improvement (DBV131_10_5). NB: LPUs means logical CPUs in the LPAR. |
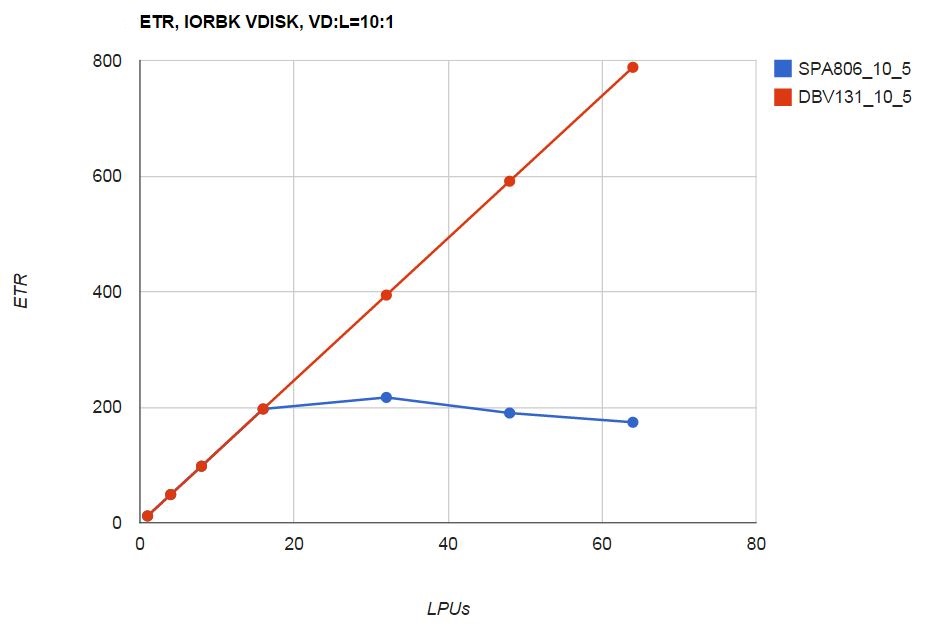
|
Figure 9 shows the VDISK workload's ITR as a function of number of cores.
| Figure 9. VDISK scaling workload ITR. zEC12, storage-rich dedicated LPAR. z/VM 6.3 unmodified (SPA806_10_5). z/VM 6.3 including VDISK serialization improvement (DBV131_10_5). NB: LPUs means logical CPUs in the LPAR. |
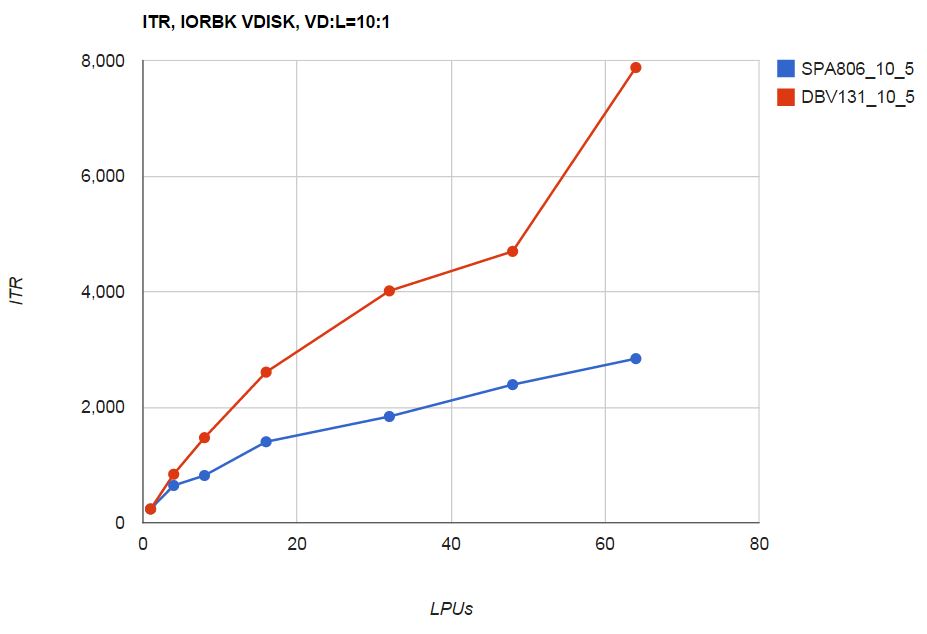
|
The VDISK serialization improvement met expectation.
Microbenchmark: Real Storage Management Serialization
Figure 10 shows the spin lock characteristics of the 30-way version of the workload. The comparison run shows all spin time on the real storage lock RSA2GLCK was removed.
| Figure 10. 30-way guest page instantiation workload. zEC12, storage-rich dedicated LPAR. z/VM 6.3 unmodified (X0SPA806). z/VM 6.3 improved (X0DBC507). |
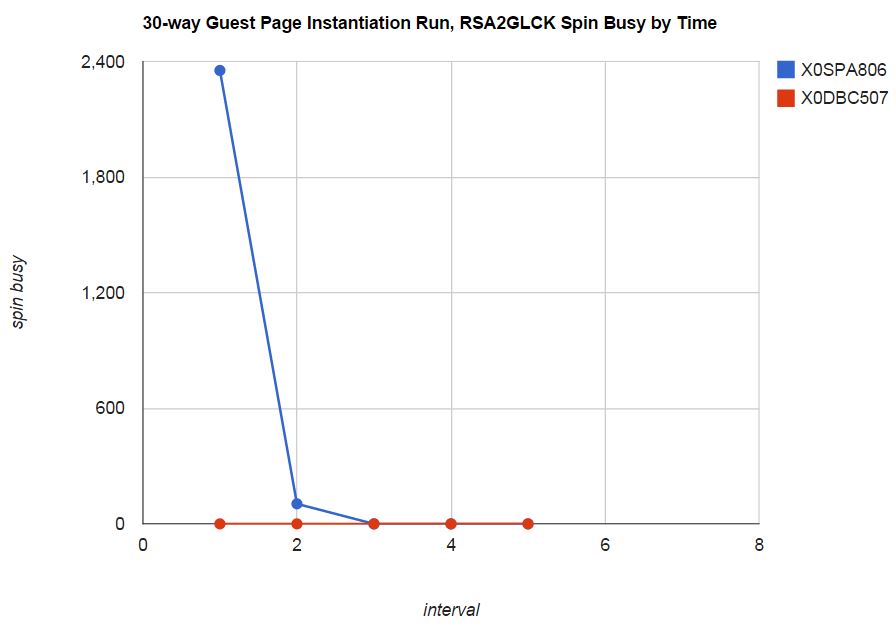
|
Figure 11 shows the spin lock characteristics of the 60-way version of the workload. Though some RSA2GLCK spin remains in the comparison run, the period of contention is shortened from four intervals to two intervals and spin busy on RSA2GLCK is reduced from 5542% to 2967%, for a savings of 25.75 engines' worth of CPU power.
| Figure 11. 60-way guest page instantiation workload. zEC12, storage-rich dedicated LPAR. z/VM 6.3 unmodified (X0SPA806). z/VM 6.3 improved (X0DBC507). |
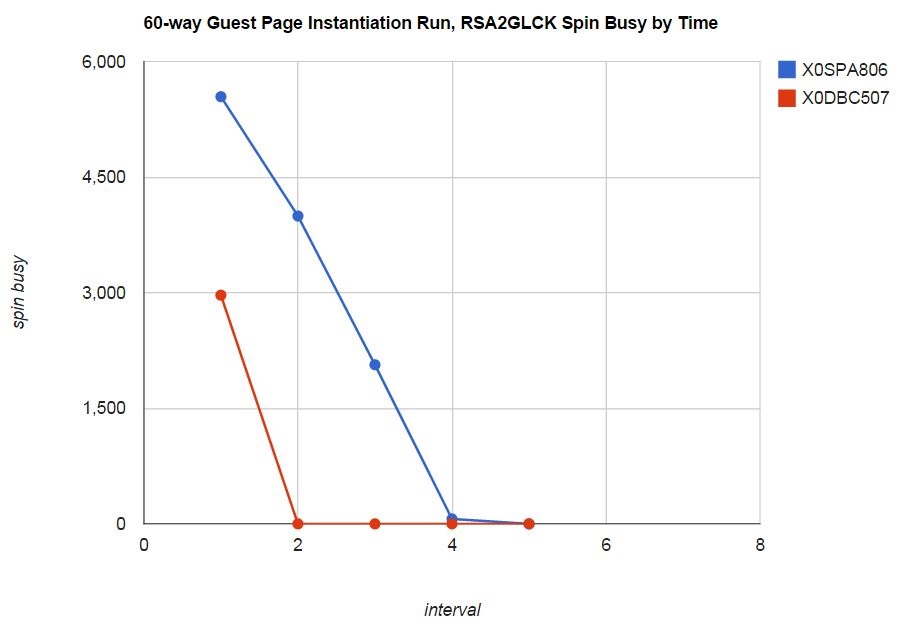
|
The real storage management improvement met expectation.
Summary and Conclusions
With z/VM for z13 IBM increased the support limit for logical CPUs in an LPAR. On a z13 the support limit is 64 logical CPUs. On other machines the support limit remains at 32 logical CPUs.
Measurements of DayTrader, a middleware-rich workload, showed correct scaling up to 64 logical CPUs, whether running in non-SMT mode or in SMT-2 mode. Measurements of certain middleware-light, z/VM Control Program-rich workloads achieved correct scaling on up to 32 cores, whether running in non-SMT mode or in SMT-2 mode. Beyond 32 cores, the z/VM CP-rich workloads exhibited some rolloff.
In developing z/VM for z13 IBM discovered three specific areas of the z/VM Control Program where focused work on constraint relief was warranted. These areas were PTE serialization, VDISK I/O, and real storage management. The z/VM for z13 PTF contains improvements for those three areas. In highly focused microbenchmarks the improvements met expectation.
Back to Table of Contents.
z/VM Version 6 Release 3
The following sections discuss the performance characteristics of z/VM 6.3 and the results of the z/VM 6.3 performance evaluation.
Back to Table of Contents.
Summary of Key Findings
This section summarizes key z/VM 6.3 performance items and contains links that take the reader to more detailed information about each one.
Further, the Performance Improvements article gives information about other performance enhancements in z/VM 6.3.
For descriptions of other performance-related changes, see the z/VM 6.3 Performance Considerations and Performance Management sections.
To compare the performance of z/VM 6.3 to previous releases, IBM ran a variety of workloads on the two systems. For the base case, IBM used z/VM 6.2 plus all Control Program (CP) PTFs available as of September 8, 2011. For the comparison case, IBM used z/VM 6.3 at the "code freeze" level of June 14, 2013.
Regression measurements comparing these two z/VM levels showed nearly identical results for most workloads. Variation was generally less than 5%.
Key Performance Improvements
z/VM 6.3 contains the following enhancements that offer performance improvements compared to previous z/VM releases:
Storage Management Scaling Improvements: z/VM 6.3 can exploit a partition having up to 1024 GB (1 TB) of real storage. This is an improvement of a factor of four over the previous limit. The storage management chapter discusses the performance characteristics of the new storage management code. Workloads that on earlier releases were suffering from the constraints present in the z/VM Control Program's real storage manager should now experience correct performance in real storage sizes up to the new limit. Workloads that were not experiencing problems on earlier releases will not experience improvements. See the chapter for more information.
z/VM HiperDispatch: The z/VM 6.3 HiperDispatch function improves performance for amenable workloads. At the partition level, z/VM exploits PR/SM's vertical mode partitions to help increase the logical CPUs' proximity to one another and to help reduce the motion of the partition's logical CPUs within the physical hardware. At the guest level, changes in the z/VM dispatcher help to increase the likelihood that a guest virtual machine will experience reduced motion among the logical CPUs of the partition. These changes provided up to 49% performance improvement in the workloads measured. See the chapter for more information.
System Dump Improvements: Increasing the system's maximum real storage size required a corresponding improvement in the system's ability to collect system dumps. The system dump chapter provides a brief discussion of the changes made in the area of dumps, especially as those changes contribute to better performance. In the experiments conducted, data rates for dumps improved by 50% to 90% for dumps to ECKD and by 190% to 1500% for dumps to EDEV. See the chapter for more information.
Back to Table of Contents.
Changes That Affect Performance
This chapter contains descriptions of various changes in z/VM 6.3 that affect performance. It is divided into three sections -- Performance Improvements, Performance Considerations, and Performance Management.
Back to Table of Contents.
Performance Improvements
Large Enhancements
In Summary of Key Findings this report gives capsule summaries of the performance notables in z/VM 6.3.
Small Enhancements
z/VM 6.3 contains several small functional enhancements that might provide performance improvements for guest operating systems that exploit the improvements. IBM did no measurements on any of these release items. The list below cites the items for only completeness' sake.
FCP Data Router: In z196 GA 2 and later, the FCP adapter incorporates a "data mover" hardware function which provides direct memory access (DMA) between the FCP adapter's SCSI interface card and System z memory. This eliminates having to stage the moving data in a buffer located on and owned by the FCP adapter. A guest operating system indicates its readiness to exploit this hardware by enabling the Multiple Buffer Streaming Facility when establishing its QDIO queues.
z/VM 6.3 lets guest operating systems enable the Multiple Buffer Streaming Facility. Operating systems capable of exploiting the feature will see corresponding improvements.
HiperSocket Completion Queue: Traditional System z HiperSockets messages are transmitted synchronously. The sending CPU is blocked until the buffer can be copied. Success or failure is returned in the condition code of the SIGA instruction.
In z196 GA 2 and later, the HiperSockets facility is enhanced so that an exploiting guest can arrange not to be blocked if there would be a delay in copying the transmit buffer. Instead, the guest can enable the completion queue facility and be notified by condition code and later interrupt if the transmission has been queued for completion later.
z/VM 6.3 lets guest operating systems exploit HiperSockets completion queues if the underlying machine contains the feature. Operating systems capable of exploiting the feature will see corresponding improvements.
Access-Exception Fetch/Store Indication Facility: This facility provides additional information in the Translation-Exception Identifier (TEID) when a storage access is denied. z/VM 6.3 lets guest operating systems use the new facility. Guests able to use the new information in the TEID might be able to improve how they run on z/VM, and might consequently experience performance improvements.
Service Since z/VM 6.2
z/VM 6.3 also contains a number of changes or improvements that were first shipped as service to earlier releases. Because IBM refreshes this report at only z/VM release boundaries, IBM has not yet had a chance to describe the improvements shipped in these PTFs.
VM65085: z/VM was changed so that when it is the destination system in a live guest relocation, it throttles the number of page handling tasks it stacks. This helps prevent LGR work from getting in the way of system work unrelated to relocations.
VM65156: z/VM was changed so that if the guest's path mask is missing a path known by z/VM actually to exist, the channel program will not necessarily bypass MDC.
VM65007: As part of the zEC12 compatibility PTF, z/VM enabled support for the Local TLB Clearing Facility. This facility lets guest operating systems issue IPTE or IDTE instructions with the Local Clearing Control (LC) bit on. Guests able to meet the LC requirements specified in the System z Principles of Operation might see performance improvements. The facility is available on the zEC12 machine family.
VM65115: This repaired D6 R27 MRIODQDD so that the RDEV field was reliable.
VM65168: CP's calculations for paging device service time and paging device MLOAD were not correct. This caused CP to favor some paging devices over others. This could result in some devices being underutilized while others are overutilized.
VM65309: Under some conditions z/VM failed to drive ordinary user minidisk I/O on a z/VM-owned HyperPAV alias, even though z/VM owned the base device and the HyperPAV alias device.
Miscellaneous Repairs
IBM continually improves z/VM in response to customer-reported or IBM-reported defects or suggestions. In z/VM 6.3, the following small improvements or repairs are notable:
Prefix-LRE Support: A prefix-LRE CCW will no longer cause an abort of CCW fast-trans, nor will it disqualify the channel program for Minidisk Cache (MDC). Certain Linux distributions' DASD driver recently changed to use prefix-LRE and so CCW fast-trans and MDC were inadvertently lost in those environments.
Undocumented SSI Monitor Bits: In z/VM 6.2 D1 R1 MRMTREPR and D1 R9 MRMTRSPR were given bits to indicate that the SSI domain is active for sample and event data. IBM inadvertently omitted documentation of these bits on www.vm.ibm.com's compendium of z/VM 6.2 monitor records. The web site has been repaired.
Missing RDEV Fields: D6 R7 MRIODENB, D6 R8 MRIODDSB, and D6 R31 MRIODMDE were updated to include the RDEV number. This will help authors of reduction programs.
VMDSTATE Comments: In D2 R25 MRSCLDDL, D4 R4 MRUSEINT, and D4 R10 MRUSEITE, the comments for the VMDSTATE bit were repaired to describe VMDSUSPN correctly.
Counts of CPUs: D0 R16 MRSYTCUP and D0 R17 MRSYTCUM were changed to include a count of the number of CPUs described. Further, a continuation scheme was introduced so that if the number of CPUs needing to be described will not fit in a single record, multiple records per interval will be emitted and said records will indicate the chaining.
Missing base-VCPU bit: D4 R2 MRUSELOF was improved so that its CALFLAG1 field contains the CALBASE bit. This lets the reduction program discern which of the MRUSELOF records is for the base VCPU.
Nomenclature for High Performance FICON: MRIODDEV, MRSYTSYG, and MRSYTEPM were improved to use the term zHPF to refer to High Performance FICON.
Spelling errors: D6 R3 MRIODDEV, D6 R19 MRIODTOF, D6 R18 MRIODTON, and D1 R6 MRMTRDEV all were updated to repair spelling problems.
Back to Table of Contents.
Performance Considerations
As customers begin to deploy z/VM 6.3, they might wish to give consideration to the following items.
Planning For Large Memory
Planning for large memory generally entails planning for where your system is to put the pages that don't fit into real storage. Generally this means planning XSTORE and planning paging DASD. Because z/VM 6.3 made changes in the capabilities and effects of the CP SET RESERVED command, new planning considerations apply there too. Finally, if you are using large real storage, you will need to plan enough dump space, so that if you need to collect a system dump, you will have enough space to write it to disk.
Use of XSTORE
With z/VM 6.3 IBM no longer recommends XSTORE as an auxiliary paging device. The reason for this is that the aging and filtering function classically provided by XSTORE is now provided by z/VM 6.3's global aging list. For z/VM 6.3 IBM recommends that you simply convert your XSTORE to real storage and then run the system with no XSTORE at all. For example, if you had run an earlier z/VM in a 32 GB partition with 4 GB of XSTORE, in migrating to z/VM 6.3 you would change that to 36 GB of real storage with no XSTORE.
Amount of Paging Space
The z/VM 6.3 edition of z/VM CP Planning and Administration has been updated to contain a new formula for calculating the amount of paging space to allocate. Because this new calculation is so important, it is repeated here:
- Calculate the sum of the sizes of the logged-on guests' primary address spaces,
- Add to this sum the sizes of any data spaces they create,
- Add to this sum the sizes of any VDISKs they create,
- Add to this sum the sizes of any shared NSSes or DCSSes,
- Then multiply this sum by 1.01 to account for the DAT structures associated with all that pageable data.
- Add in the total number of CP directory pages reported by DIRECTXA. (Remember to convert pages to MB, or GB, or whatever units you are using in your calculation.)
- Add in min(10% of real storage, 4 GB) to allow for system-owned virtual pages.
When you are done with the above steps, you will have calculated the bare minimum paging space amount that would ordinarily be considered safe. Because your calculation might be uncertain or your system might grow, you will probably want to multiply your calculated value by some safety margin so as to help to protect yourself against abends caused by paging space filling up. IBM offers no rule of thumb for the safety factor multiplier you should use. Some parties have suggested adding 25% headroom, but this is just one view.
The Paging Layout
Planning a robust paging configuration generally means planning for the paging channels and DASD to be well equipped for conducting more than one paging I/O at a time. As the paging configuration becomes capable of higher and higher levels of I/O concurrency, z/VM becomes increasingly able to handle concurrent execution of page-fault-inducing guests. The following recommendations continue to apply:
- Remember that paging well is all about being able to run more than one paging I/O at a time. This means you should spread your paging space over as many volumes as possible. Get yourself lots of little paging volumes instead of one or two big ones. The more paging volumes you provide, the more paging I/Os z/VM can run concurrently.
- Make all of your volumes the same size. Use all 3390-3s, or 3390-9s, or whatever. When the volumes are unequally sized, the smaller ones fill and thereby become ineligible as targets for page-outs, thus restricting z/VM's opportunity for paging I/O concurrency.
- A disk volume should be either all paging (cylinders 1 to END) or no paging at all. Never allocate paging space on a volume that also holds other kinds of data, such as spool space or user minidisks.
- Think carefully about which of your DASD subsystems you choose for paging. Maybe you have DASD controllers of vastly different speeds, or cache sizes, or existing loads. When you decide where to place paging volumes, take the DASD subsystems' capabilities and existing loads into account.
- Within a given DASD controller, volume performance is generally sensitive to how the volumes are placed. Work with your DASD people to avoid poor volume placement, such as putting all of your paging volumes into one rank.
- If you can avoid ESCON CHPIDs for paging, do it. An ESCON CHPID can carry only one I/O at a time. FICON CHPIDs can run multiple I/Os concurrently: 32 or 64, depending on the generation of the FICON card.
- If you can, run multiple CHPIDs to each DASD controller that holds paging volumes. Consider two, or four, or eight CHPIDs per controller. Do this even if you are using FICON.
- If you have FCP CHPIDs and SCSI DASD controllers, you might consider exploiting them for paging. A SCSI LUN defined to the z/VM system as an EDEV and ATTACHed to SYSTEM for paging has the very nice property that the z/VM Control Program can overlap I/Os to it. This lets you achieve paging I/O concurrency without needing multiple volumes. However, don't run this configuration if you are CPU-constrained. It takes more CPU cycles per I/O to do EDEV I/O than it does to do classic ECKD I/O.
- Make sure you run with a few reserved slots in the CP-owned list, so you can add paging volumes without an IPL if the need arises.
Global Aging List
Unless your system is memory-rich, IBM recommends you run the system with the default global aging list size.
If your system's workload fits entirely into central storage, IBM suggests you run with a small global aging list and with global aging list early writes disabled.
The global aging list can be controlled via the CP SET AGELIST command or the STORAGE AGELIST system configuration file statement.
CP SET RESERVED
Because z/VM 6.3 changed the capabilities and effects of the CP SET RESERVED command, you will want to review your existing use to make sure you still agree with the values you had previously selected. Earlier editions of z/VM sometimes failed to honor CP SET RESERVED settings for guests, so some customers might have oversized the amounts of reserved storage they specified. z/VM 6.3 was designed to be much more effective and precise in honoring reserved settings. Review your use to make sure the values you are specifying truly reflect your wishes.
z/VM 6.3 also permits CP SET RESERVED for NSSes or DCSSes. This new capability was especially intended for the MONDCSS segment. In previous z/VM releases, under heavy storage constraint MONDCSS was at risk for being paged out and consequently unavailable for catching CP Monitor records. Because CP Monitor records are especially needed when the system is under duress, IBM suggests you establish a reserved setting for MONDCSS. Use a reserved setting equal to the size of MONDCSS. This will assure residency for the instantiated pages of MONDCSS.
Seeing the Effect
A vital part of any migration or exploitation plan is its provision for observing performance changes. To observe the effects of z/VM 6.3's memory management changes, collect reliable base case measurement data before your migration. This usually entails collecting MONWRITE data and transaction rate data from peak periods. Then do your migration, and then collect the same measurement data again, and then do your comparison.
Planning for Dumping Large Systems
If you are using very large real storage, you will want to plan enough system dump space, so that if you need to collect a dump you will have enough space to write it. The guidelines for calculating the amount of dump space to set aside are too detailed to include in this brief article. Refer instead to the discussion titled "Allocating Space for CP Hard Abend Dumps" in z/VM Planning and Administration, Chapter 20, "Allocating DASD Space", under the heading "Spooling Space". Be sure to use the web edition of the guidelines.
Planning For z/VM HiperDispatch
Planning for z/VM HiperDispatch consists of making a few important configuration decisions. The customer must decide whether to run horizontally or to run vertically. If running vertically the customer must decide what values to use for the SRM CPUPAD safety margin and for the SRM EXCESSUSE prediction control, and he must also review his use of CP DEDICATE. Last, the customer must decide whether to use reshuffle or rebalance as the system's work distribution heuristic.
On Vertical Mode
IBM's experience suggests that many customers will find vertical mode to be a suitable choice for the polarity of the partition. In vertical mode PR/SM endeavors to place the partition's logical CPUs close to one another in the physical machine and not to move the logical CPUs within the machine unnecessarily. Generally this will result in reducing memory interference between the z/VM partition and the other partitions on the CEC. Further, in vertical mode z/VM will run the workload over the minimum number of logical CPUs needed to consume the forecast available power, should the workload want to so consume. This strategy helps to avoid unnecessary MP effect while taking advantage of apparently available parallelism and cache. Together these two behaviors should position the workload to get better performance from memory than on previous releases.
When running vertically z/VM parks and unparks logical CPUs according to anticipated available CPU power. z/VM will usually run with just the right number of logical CPUs needed to consume the CPU power it forecasts PR/SM will make available to it. This aspect of z/VM HiperDispatch does not require any special planning considerations.
Some customers might find that running in vertical mode causes performance loss. Workloads where this might happen will tend to be those for which a large number of slower CPUs runs the workload better than a smaller number of faster ones. Further, vertical mode will show a loss for this kind of workload only if the number of logical CPUs in the partition far exceeds the number needed to consume the available power. When this is the case, a horizontal partition would run with all of its logical CPUs each a little bit powered while a vertical partition would concentrate that available power onto fewer CPUs. As long as entitlement and logical CPU count are set sensibly with respect to one another, the likelihood of this happening is remote. If it does end up happening, then selecting horizontal polarization via either CP SET SRM or the system configuration file's SRM statement is one way out. Rethinking the partition's weight and logical CPU count is another.
Choosing CPUPAD
In vertical mode, in situations of high forecast T/V ceilings z/VM will attempt to reduce system overhead by parking logical CPUs even though the power forecast suggests those logical CPUs would have been powered. The amount of parking done is related to the severity of the T/V forecast.
The purpose of the CPUPAD setting is to moderate T/V-based parking. In other words, in high T/V situations CPUPAD stops z/VM from parking down to the bare minimum capacity needed to contain the forecast utilization ceiling. CPUPAD specifies the "headroom" or extra capacity z/VM should leave unparked over and above what is needed to contain the forecast utilization ceiling. This lets the system administrator leave room for unpredictable demand spikes. For example, if the system administrator knows that at any moment the CPU utilization of the system might suddenly and immediately increase by six physical CPUs' worth of power, it would be a good idea to cover that possibility by running with CPUPAD set to 600%. Ordinarily z/VM runs with only CPUPAD 100%. The CPUPAD setting can be changed with the SET SRM CPUPAD command or with the SRM system configuration file statement.
In building the T/V-based parking enhancement, IBM examined its warehouse of MONWRITE data gathered from customers over the years. IBM also examined the T/V values seen in some of its own workloads. Based on this work IBM selected T/V=1.5 as the value at which the system just barely begins to apply T/V-based parking. By T/V=2.0 the T/V-based parking enhancement is fully engaged. Fully engaged means that parking is done completely according to forecast CPU utilization ceiling plus CPUPAD.
The same study also revealed information about the tendency of customers' systems to incur unforecastable immediate spikes in CPU utilization. The great majority of the data IBM examined showed utilization to be fairly steady when viewed over small time intervals. Simulations suggested CPUPAD 100% would contain nearly all of the variation seen in our study. No data IBM saw required a CPUPAD value greater than 300%.
To disable T/V-based parking, just set CPUPAD to a very high value. The maximum accepted value for CPUPAD is 6400%.
Keep in mind that no value of CPUPAD can cause the system to run with more logical CPUs unparked than are needed to consume forecast capacity. The only way to achieve this is to run horizontally, which runs with all CPUs unparked all the time.
If the workload's bottleneck comes from its ability to achieve execution milestones inside the z/VM Control Program -- for example, to accomplish Diagnose instructions or to accomplish VSWITCH data transfers -- it would probably be appropriate to run with a high CPUPAD value so as to suppress T/V-based parking. While the CPU cost of each achieved CP operation might be greater because of increased MP effect, perhaps more such operations could be accomplished each second and so ETR might rise.
Choosing EXCESSUSE
When z/VM projects total CPU power available for the next interval, it forms the projection by adding to the partition's entitlement the amount of unentitled power the partition projects it will be able to draw. Our z/VM HiperDispatch article describes this in more detail.
The default setting for EXCESSUSE, MEDIUM, causes z/VM to project unentitled power with a confidence percentage of 70%. In other words, z/VM projects the amount of excess power it is 70% likely to get from PR/SM for the next interval. z/VM then unparks according to the projection.
A 70% confidence projection means there is a 30% chance z/VM will overpredict excess power. The consequence of having overpredicted is that z/VM will run with too many logical CPUs unparked and that it will overestimate the capacity of the Vm and Vl logical CPUs. The chance of a single unfulfilled prediction doing large damage to the workload is probably small. But if z/VM chronically overpredicts excess power, the workload might suffer.
SRM EXCESSUSE LOW causes predictions of unentitled power to be made with higher confidence. This of course makes the projections lower in magnitude. SRM EXCESSUSE HIGH results in low-confidence, high-magnitude predictions.
Customers whose CECs exhibit wide, frequent swings in utilization should probably run with EXCESSUSE LOW. This will help to keep their workloads safe from unfulfilled projections. The more steady the CEC's workload, the more confident the customer can feel about using less-confident, higher-magnitude projections of unentitled power.
Use of CP DEDICATE
In vertical mode z/VM does not permit the use of the CP DEDICATE command, nor does it permit use of the DEDICATE card in the CP directory. Customers dedicating logical CPUs to guests must revisit their decisions before choosing vertical mode.
On Rebalance and Reshuffle
IBM's experience suggests that workloads suitable for using the rebalance heuristic are those consisting of a few CPU-heavy guests with clearly differentiated CPU utilization and with a total number of virtual CPUs not much greater than the number of logical CPUs defined for the partition. In workloads such as these, rebalance will generally place each guest into the same topological container over and over and will tend to place distinct guests apart from one another in the topology. Absent those workload traits, it has been IBM's experience that selecting the classic workload distributor, reshuffle, is the correct choice.
Seeing The Effect
To see the effect of z/VM HiperDispatch, be sure to collect reliable base case measurement data before your migration. Collect MONWRITE data from peak periods, being sure to enable the CPU Measurement Facility; the z/VM 6.2 article describes how to collect the CPU MF counters, and this CPU MF article describes how to reduce them. Be sure also to collect an appropriate transaction rate for your workload. Then do your migration, and then collect the same measurement data again, and then do your comparison.
Use of CP INDICATE LOAD
In previous z/VM releases the percent-busy values displayed by CP INDICATE LOAD were calculated based on the fraction of time z/VM loaded a wait PSW. If z/VM never loaded a wait, the value displayed would be 100%, assuming of course a steady state.
The previous releases' behavior was considered to be misleading. A value of 100% implied that the logical CPU was using a whole physical engine's worth of CPU power. In fact this was not the case. A value of 100% meant only that the logical CPU was using all of the CPU power PR/SM would let it use. Further complicating the matter is the fact that unless the partition is dedicated or the logical CPU is a Vh, the amount of power PR/SM will let a logical CPU consume is a time-varying quantity. Thus a constant value seen in CP INDICATE LOAD did not at all mean the logical CPU was running at a constant, well, anything.
In z/VM 6.3 CP INDICATE LOAD was changed so that the displayed percentages really do reflect percent of the power available from a physical CPU. A value of 100% now means the logical CPU is drawing a whole physical CPU's worth of power. This removes confusion and also aligns the definition with the various CPU-busy values displayed by z/VM Performance Toolkit.
The CP INDICATE LOAD value is actually a time-smoothed value calculated from a sample history gathered over the last few minutes. This was true in previous releases of z/VM and continues to be true in z/VM 6.3. No changes were made to the smoothing process.
z/VM Performance Toolkit Considerations
Large discrepancies between entitlement and logical CPU count have always had potential to cause problems as the CEC becomes CPU-constrained. The problem is that as the CEC becomes CPU-constrained, PR/SM might throttle back overconsuming partitions' consumptions toward merely their entitlements instead of letting partitions consume as much as their logical CPU counts allow. A partition accustomed to running far beyond its entitlement can become incapacitated or hampered if the CEC becomes constrained and PR/SM begins throttling the partition's consumption. In an extreme case the workload might not survive the throttling.
Throttling of this type was difficult to discern on releases of z/VM prior to 6.3. About the only way to see it in z/VM Performance Toolkit was to notice that in the FCX126 LPAR report large amounts of suspend time were appearing. This phenomenon would have to have been accompanied by physical CPU utilizations approaching the capacity of the CEC. The latter was quite difficult to notice in antique z/VM releases because no z/VM Performance Toolkit report directly tabulated total physical CPU utilization. On those releases, summing the correct rows of the FCX126 LPAR report so as to calculate physical CPU utilization was about the only way to use a Perfkit listing to notice a constrained CEC. Fairly recent z/VM Performance Toolkit editions extended the FCX126 LPAR report with a Summary of Physical Processors epilogue which helped illustrate total CEC utilization.
On z/VM 6.3, PR/SM throttling a partition toward its entitlement is now much easier to see. For one, the FCX302 PHYSLOG report directly tabulates physical CPU utilization as a function of time, so it is simple to see whether the CEC is constrained. Further, the FCX306 LSHARACT report displays partition entitlement, partition logical CPU count, and partition CPU utilization right alongside one another, so it is easy to see which partitions are exposed to being throttled. Last, in vertical mode z/VM 6.3 parks unentitled logical CPUs according to the power forecast, so if PR/SM is throttling a partition whose logical CPU count exceeds its entitlement, z/VM will begin parking engines, and the FCX299 PUCFGLOG report will show this parking right away.
Because of the changes in z/VM 6.3, many z/VM Performance Toolkit reports became obsolete and so they are not generated when Perfkit is handling z/VM 6.3 data. The AVAILLOG report is a good example of these. Other reports' layouts or columns are changed. The SYSSUMLG report is an example of these. If you have dependencies on the existence or format of z/VM Performance Toolkit reports or screens, refer to our performance management chapter and study the list of z/VM Performance Toolkit changes.
Back to Table of Contents.
Performance Management
These changes affect the performance management of z/VM:
- MONDCSS and the SET RESERVED Command
- Space for MONWRITE Data
- Monitor Changes
- Command and Output Changes
- Effects on Accounting Data
- Performance Toolkit for VM Changes
- Omegamon XE Changes
MONDCSS and the SET RESERVED Command
The SET RESERVED command can be used to specify the number of pages of your monitor saved segment (MONDCSS) that should remain resident even though the system is paging. Reserved settings are not preserved across IPL, so you will need to include the SET RESERVED command for the monitor saved segment in your IPL procedure. For more information on SET RESERVED see z/VM CP Commands and Utilities Reference.
Space for MONWRITE Data
z/VM HiperDispatch emits the new D5 R16 MRPRCPUP event record every two seconds. As a result, MONWRITE files might be larger than in previous releases. Keep track of space on the MONWRITE collection disk and make adjustments as needed.
Monitor Changes
Several z/VM 6.3 enhancements affect CP monitor data. There are four new monitor records and several changed records. The detailed monitor record layouts are found on the control blocks page.
The next generation FCP adapter incorporates a "data-mover" hardware function that provides direct memory access (DMA) between the FCP adapter's SCSI interface card and memory. The data-mover function eliminates the need to store SCSI data within an interim buffer in the FCP adapter, which is typically referred to as a "store-and-forward" data transfer approach. The following monitor records are updated for this support:
| Monitor Record | Record Name |
|---|---|
| Domain 1 Record 19 | Indicates configuration of a QDIO device |
| Domain 6 Record 25 | Indicates that a QDIO device had been activated |
z/VM HiperDispatch provides z/VM host exploitation of CPU topology information and vertical polarization for greater processor cache efficiency and reduced multi-processor effects. z/VM HiperDispatch can be used to increase the CPU performance and scalability of z/VM and guest workloads to make more efficient use of resources.
The following monitor records are added and/or updated for z/VM HiperDispatch support:
Added monitor records:
| Monitor Record | Record Name |
|---|---|
| Domain 5 Record 15 | Dispatch Vector Assignments |
| Domain 5 Record 16 | Park/Unpark Decision |
| Domain 5 Record 17 | Real CPU Data (per CPU) |
| Domain 5 Record 18 | Dispatch Vector High Frequency Data |
Updated monitor records:
| Monitor Record | Record Name |
|---|---|
| Domain 0 Record 2 | Processor Data (per processor) |
| Domain 0 Record 16 | Logical CPU Utilization Data in a logical Partition |
| Domain 0 Record 23 | Formal Spin Lock Data |
| Domain 0 Record 24 | Scheduler Activity (per processor type) |
| Domain 1 Record 4 | System Configuration Data |
| Domain 1 Record 5 | Processor Configuration |
| Domain 1 Record 16 | Scheduler Settings |
| Domain 2 Record 7 | SET SRM Changes |
| Domain 4 Record 2 | User Logoff Data |
| Domain 4 Record 3 | User Activity Data |
| Domain 5 Record 2 | Vary Off Processor |
| Domain 5 Record 3 | Processor Data |
Traditional System z HiperSockets messages are transmitted synchronously by the sending CPU, and feedback on success/failure is given immediately in the form of a condition code. However, in short-burst scenarios where more data needs to be sent than can be supported by the current number of queues, performance degrades as drivers are given busy conditions and are asked to make the decision to retry or fail. HiperSockets Completion Queues support provides a mechanism by which the hardware can buffer requests and perform them asynchronously. The following monitor records are updated for this support:
| Monitor Record | Record Name |
|---|---|
| Domain 1 Record 19 | Indicates configuration of a QDIO device |
| Domain 6 Record 25 | Indicates that a QDIO device had been activated |
| Domain 6 Record 26 | Indicates activity on a QDIO device |
| Domain 6 Record 27 | Indicates deactivaiton of a QDIO device |
z/VM's dump capacity is increased to support real memory up to a maximum of 1 TB in size. The following monitor records have been changed:
| Monitor Record | Record Name |
|---|---|
| Domain 1 Record 7 | Memory Configuration |
| Domain 3 Record 1 | Real Storage Management Data |
The z/VM memory management algorithms are redesigned to enable support for real memory up to 1 TB. These enhancements are intended to improve efficiency for the over commitment of virtual to real memory for guests and to improve performance. The following monitor records are changed for this support:
| Monitor Record | Record Name |
|---|---|
| Domain 0 Record 3 | Real Storage Data (Global) |
| Domain 0 Record 4 | Real Storage Data (Per Processor) |
| Domain 0 Record 6 | Auxiliary Storage (Global) |
| Domain 0 Record 7 | Shared Storage Data |
| Domain 1 Record 7 | Memory Configuration Data |
| Domain 1 Record 15 | Logged on User |
| Domain 2 Record 4 | Add User to Dispatch List |
| Domain 2 Record 5 | Drop User from Dispatch List |
| Domain 2 Record 6 | Add User to Eligible List |
| Domain 2 Record 8 | System Timer Pop |
| Domain 3 Record 1 | Real Storage Management (Global) |
| Domain 3 Record 2 | Real Storage Management (Per Processor) |
| Domain 3 Record 3 | Shared Storage Management |
| Domain 3 Record 14 | Address Space Information Record |
| Domain 3 Record 15 | NSS/DCSS/SSP Loaded into Storage |
| Domain 3 Record 16 | NSS/DCSS/SSP Removed from Storage |
| Domain 4 Record 2 | User Logoff Data |
| Domain 4 Record 3 | User Activity Data |
| Domain 4 Record 9 | User Activity at Transaction End |
Virtual Edge Port Aggregator (VEPA) is part of the emerging IEEE 802.1Qbg standardization effort and is designed to reduce the complexities associated with highly virtualized deployments such as hypervisor virtual switches bridging many virtual machines. VEPA provides the capability to take all virtual machine traffic sent by the server and send it to an adjacent network switch. This support updates the following monitor records:
| Monitor Record | Record Name |
|---|---|
| Domain 6 Record 21 | Virtual Switch Activity |
| Domain 6 Record 35 | Virtual Switch bridge port activity |
VSWITCH recovery stall prevention provides additional virtual switch uplink and bridge port recovery logic to failover to another backup device when encountering a missing interrupt condition. The following monitor record is changed for this support:
| Monitor Record | Record Name |
|---|---|
| Domain 6 Record 22 | Virtual Switch Failover |
To provide additional debug information for system and performance problems, z/VM 6.3 added or changed these monitor records:
| Monitor Record | Record Name |
|---|---|
| Domain 0 Record 17 | Physical CPU Data Utilization Data for LPAR Management |
| Domain 0 Record 20 | Extended Channel Measurement Data (Per Channel) |
| Domain 3 Record 4 | Auxiliary Storage Management |
| Domain 3 Record 11 | Auxiliary Shared Storage Management |
| Domain 5 Record 8 | I/O Processor (IOP) Utilization |
| Domain 5 Record 10 | Crypto Performance Measurement Data |
| Domain 6 Record 3 | Device Activity |
| Domain 6 Record 4 | Cache Activity Data |
| Domain 6 Record 7 | Enable Terminal |
| Domain 6 Record 8 | Disable Terminal |
| Domain 6 Record 14 | Set Subchannel Measurement Off |
| Domain 6 Record 31 | Minidisk Activity |
| Domain 9 Record 3 | ISFC Logical Link Definition Change |
Finally, it should be noted that in APAR VM65007 IBM introduced z/VM support for the zEC12 processor. This support is now available in base z/VM 6.3. Part of this work was to enhance z/VM to collect the kinds of CPU Measurement Facility counters the zEC12 emits. The D5 R13 MRPRCMFC record was not itself changed to handle the zEC12, but reduction programs will see that the MRPRCCMF record contains the zEC12's CPU MF counter version numbers if the record is from a zEC12. Existing MRPRCCMF payload carriage techniques were used to carry the zEC12's counters.
Command and Output Changes
This section cites new or changed commands or command outputs that are relevant to the task of performance management. It is not an inventory of every new or changed command.
The section does not give syntax diagrams, sample command outputs, or the like. Current copies of z/VM publications can be found in the online library.
DEDICATE: The DEDICATE command is not supported if the partition is vertical.
QUERY PROCESSORS: The output is modified to display whether a CPU is parked.
INDICATE LOAD: The output is modified to display CPU polarity. Also, the CPU utilization is now percent of a physical CPU's capacity instead of percent of time without a wait PSW loaded.
INDICATE QUEUES: The output is modified to indicate DSVBK placement.
QUERY SRM: The command is modified to display polarization, CPUPAD, EXCESSUSE, and work distributor.
SET SRM: The command is modified to set polarization, CPUPAD, EXCESSUSE, or work distributor.
SET DUMP: The command is modified to allow specification of up to 32 RDEVs.
SDINST: This new command installs the stand-alone dump facility.
DUMPLD2: The command is modified to add a new operand, DASD.
SET AGELIST: This new command controls the global aging list.
QUERY AGELIST: This new command displays information about the global aging list.
SET RESERVED: This command is modified to allow setting reserved frame amounts for an NSS or DCSS.
QUERY RESERVED: This command is modified to display new information about settings for reserved frames.
INDICATE LOAD: The output's STEAL clause is removed.
INDICATE NSS: The output is modified to display counts of instantiated pages and reserved frames.
INDICATE SPACES: The output is modified to display counts of instantiated pages.
INDICATE USER: The output is modified to display counts of instantiated pages.
SET REORDER: The command now always returns RC=6005.
QUERY REORDER: The command now always displays that reorder is off.
IPL: The command supports a new DUMP option, NSSDATA.
SET VSWITCH: The command provides a new UPLINK SWITCHOVER function.
QUERY VSWITCH: The output is modified to contain uplink switchover information.
Effects on Accounting Data
z/VM 6.3 did not add, change, or delete any accounting records.
Performance Toolkit for VM Changes
Performance Toolkit for VM has been enhanced in z/VM 6.3.
The following reports have been changed:
Performance Toolkit for VM: Changed Reports
| Name | Number | Title | What Changed |
| AUXLOG | FCX146 | Auxiliary Storage Log |
|
| AVAILLOG | FCX254 | Available List Log |
|
| BENCHMRK | FCX173 | Benchmark Log Selection Menu |
|
| CPU | FCX100 | CPU Load and Transactions |
|
| DEMNDLOG | FCX259 | Demand Scan Log |
|
| GVNIC | FCX268 | General Virtual Network Device Description |
|
| GVSWITCH | FCX266 | General Virtual Switch Description |
|
| IOCHANGE | FCX185 | I/O Configuration Changes |
|
| LCHANNEL | FCX161 | LPAR Channel Load |
|
| LOCKLOG | FCX265 | Spin Lock Log |
|
| LPAR | FCX126 | LPAR Load |
|
| LPARLOG | FCX202 | LPAR Load Log |
|
| MENU | FCX124 | Performance Data Selection Menu |
|
| MONDATA | FCX155 | Monitor Data Statistics |
|
| NSS | FCX133 | Shared Segments |
|
| PROCMENU | FCX236 | Processor Load and Configuration Logs Menu |
|
| PROCSUM | FCX239 | Processor Summary Log |
|
| QDIO | FCX251 | QDIO Activity |
|
| SCSI | FCX249 | SCSI Device |
|
| SSIMENU | FCX271 | SSI Data Menu |
|
| STORAGE | FCX103 | Storage Utilization |
|
| STORMENU | FCX260 | Storage Management Logs Menu |
|
| SYSCONF | FCX180 | System Configuration |
|
| SYSLOAD | FCX198 | System Load Overview |
|
| SYSLOG | FCX179 | System Facilities Log |
|
| SYSSET | FCX154 | System Settings |
|
| SYSSUMLG | FCX225 | System Summary Log |
|
| SYSTEM | FCX102 | System Counters |
|
| USER | FCX112 | User Resource Usage |
|
| USERLOG | FCX162 | User Resource Usage Log |
|
| VDISKS | FCX147 | Virtual Disks in Storage |
|
| VNIC | FCX269 | Virtual Network Device Activity |
|
The following reports are new:
Performance Toolkit for VM: New Reports
| Name | Number | Title | Description |
| DEVICE HPF | FCX282 | HPF I/O Device | HPF I/O Device screen displays DASD devices with HPF support. |
| HPFLOG | FCX283 | HPF I/O Device Performance Log | HPF I/O Device Performance Log screen displays a "by time" log of HPF I/O performance data for the selected disk. |
| DEVMENU | FCX284 | I/O Device Data Selection Menu | I/O Device Data Selection menu displays a selection menu of available device reports. |
| LGRELOG | FCX285 | LGR Event Log | LGR Event Log screen displays information about the live guest relocation events that have occurred on the system. |
| LGRDATA | FCX286 | LGR Data | LGR Data screen displays information about the live guest relocations that have occurred on the system. |
| TOPOLOG | FCX287 | System Topology Machine Organization | System Topology Machine Organization screen displays LPAR topology information. |
| UPGMENU | FCX289 | User Paging Menu | User Paging menu displays a list of all the available user paging data displays. |
| UPGACT | FCX290 | User Page Activity | User Page Activity screen displays detailed information on z/VM's management of each virtual machine's memory management activities during the last measuring interval. |
| UPGACTLG | FCX291 | User Page Activity Log | User Page Activity Log screen displays a log of user page activity. |
| UPGUTL | FCX292 | User Page Utilization Data | User Page Utilization Data screen displays detailed information on each virtual machine's utilization of z/VM paging resources during the last measuring interval. |
| UPGUTLLG | FCX293 | User Page Utilization Data Log | User Page Utilization Data Log screen displays a log of user page utilization data. |
| AVLB2GLG | FCX294 | Available List Data Below 2G | Available List Data Below 2G screen displays "by time" information on the below-2-GB available list. |
| AVLA2GLG | FCX295 | Available List Data Above 2G | Available List Data Above 2G screen displays "by time" information on the above-2-GB available list. |
| STEALLOG | FCX296 | Steal Statistics | Steal Statistics screen displays "by time" information on z/VM's memory management stealing statistics. |
| AGELLOG | FCX297 | Age List Log | Age List Log screen displays "by time" information on z/VM's management of the Age List in real memory. |
| PUORGLOG | FCX298 | Logical PU Organization | Logical PU Organization screen displays PU organization information for a partition. |
| PUCFGLOG | FCX299 | Logical PU Configuration Log | Logical PU Configuration Log screen logs the calculations and decisions z/VM makes regarding how many logical processor units of each type are (and are not) actively doing work. |
| DSVCLOG | FCX300 | Dispatch Vector Configuration Log | Dispatch Vector Configuration Log screen displays each dispatch vector (DV) and the LPUs assigned to the DV. Each DV is identified by its ID and is then annotated with information about its topological location and about the LPUs assigned to it. |
| DSVBKACT | FCX301 | Dispatch Vector Activity | Dispatch Vector Activity screen displays the activity of the DSVBKs. |
| PHYSLOG | FCX302 | Real CPU Utilization Log | Real CPU Utilization Log screen displays real CPU utilization by time. |
| DSVSLOG | FCX303 | DSVBK Steals per Processor Log | DSVBK Steals per Processor Log screen displays information about DSVBK steal rates. |
| PRCLOG | FCX304 | Processor Log | Processor Log screen displays monitor data from z/VM release 6.3.0 and later releases. |
| LPARMENU | FCX305 | Logical Partition Activity Menu | Logical Partition Activity menu displays a selection menu of LPAR reports. |
| LSHARACT | FCX306 | Logical Partition Share | Logical Partition Share screen displays a summary report of LPAR weights. |
| LPARLOGM | FCX307 | Logical Partition Logs Menu | Logical Partition Logs menu displays a selection menu of LPAR logs by time. |
IBM continually improves Performance Toolkit for VM in response to customer-reported or IBM-reported defects or suggestions. In Function Level 630 the following small improvements or repairs are notable:
- SORT performance improvement.
- Added support for device groups (FCONTROL DEVGROUP).
- Added support for OSA types 6 and 7.
- FCONX $PROFILE (sample) file corrected for optimal default settings.
- Added an ability for automatic scrolling of CP messages.
- Support for more than 100 logical CPUs in a LPAR.
- Unify the rules for suffix letters to express multipliers on datums (binary/decimal scaling factor).
- Added Left/Right buttons for wide reports on the web.
- Update the sizing exec FCXSEGSZ for new OMEGAMON tables (for handling SSI and LGR data).
Omegamon XE Changes
Omegamon XE has added several new workspaces so as to expand and enrich its ability to comment on z/VM system performance. In particular, Omegamon XE now offers these additional workspaces and functions:
- CPC workspace which shows your total processor usage, by processor type
- Single System Image
- Live Guest Relocation
- Emulated FBA on SCSI (EDEV) disks
- Integration with Smart Cloud Monitoring
- Cognos Reports
- Self-defining Agents (automatic updating of your ITM infrastructure)
To support these Omegamon XE endeavors, Performance Toolkit for VM now puts additional CP Monitor data into the PERFOUT DCSS.
Back to Table of Contents.
New Functions
This section contains discussions of the following performance evaluations:
- Storage Management Scaling Improvements
- z/VM HiperDispatch
- System Dump Improvements
Back to Table of Contents.
Storage Management Scaling Improvements
Abstract
z/VM 6.3 provides several storage management enhancements that let z/VM scale real storage efficiently past 256 GB in a storage-overcommitted environment. Because of these enhancements z/VM 6.3 supports 1 TB of real storage and 128 GB of XSTORE.
Workloads affected by the reorder process or by serial searches in previous z/VM releases generally receive benefit from the new storage management algorithms. ETR improvements as high as 1465% were observed.
The Apache and VIRSTOR workloads described below showed scaling at the same rate as the resources they depended on were varied. When resources were scaled linearly with a slope of one, ETR and ITR scaled at the same rate, except when external hardware limitations interfered.
Although some of the specific experiments were limited by configuration, workload scaling to 1 TB was not limited by storage management searching algorithms.
Introduction
This article provides a design overview and performance evaluation for the storage management enhancements implemented in z/VM 6.3. Demand scan uses new memory management techniques such as trial invalidation and a global aging list. These new techniques replace the previous page eviction selection algorithms.
Demand Scan Changes
In previous releases demand scan uses a three-pass scheme based on scheduler lists as a way to visit users and reclaim frames. For several reasons the previous demand scan does not scale well above 256 GB. First, it is too soft on guests in pass 1. Pass 2 is more aggressive but is based on an inaccurate working set size calculation. Pass 3 takes too aggressively from all frame-owned lists and does not honor SET RESERVED specifications. The scheduler lists no longer portray active users in a way that is usable by storage management for choosing good candidates from which to reclaim memory frames.
In z/VM 6.3 the pass-based scheme was removed. Demand scan was enhanced to use the system's global cyclic list to navigate users. The global cyclic list is used to locate the user-frame-owned lists (UFOs), the system-frame-owned list, and the VDISK-frame-owned list. Demand scan navigates the cyclic list in order visiting each entity in it and evaluating its frame list for adjustment. In Figure 1 the global cyclic list is shown with blue arrows.
UFOs and Invalid-but-Resident State
In an environment where storage is overcommitted, UFOs now have a section where pages' page table entries are invalidated on a trial basis to test how long pages remain unreferenced. This UFO section is called the invalid-but-resident (IBR) section and is shown in Figure 1. When a guest references a page that has an invalid page table entry, a page fault occurs and the page table entry is revalidated. This is called revalidation and is shown in Figure 1.
A UFO's IBR section target size is based on the guest's current IBR section size prorated to the ratio of its revalidation to invalidation ratio against the system average revalidation to invalidation ratio. This effectively compares the guest's revalidation to invalidation rate to the system average and raises its invalidation section target size if it is below average and lowers it if it is above average.
Working set size is no longer used to determine guest residency targets.
The Global Aging List
z/VM 6.3 also introduces the global aging list, also shown in Figure 1. The global aging list lets z/VM do system-wide tracking of recency of reference of pages preliminarily targeted for eviction. In this way it provides similar function to XSTORE with reduced overhead.
Frames added to the global aging list come from the bottoms of the various UFOs. These frames are added to the global aging list at its top. Frames move toward the bottom of the global aging list because of subsequent adds at the list's top or because of revalidations causing dequeues. When frames reach the early write pointer, they are evaluated as to whether they should be written to DASD. Frame reclaims happen at the bottom of the list.
A fault taken on a page held in a frame residing on the global aging list results in revalidation of the page's page table entry and pointer adjustments that move the frame to the top of the user's UFO active section.
The global aging list is more efficient than XSTORE because the list is managed with pointer manipulation rather than by moving page contents.
The system begins building the global aging list only when DPA minus in-use frames is less than the aging list target size.
The global aging list target size can be set via command or system configuration file entry. The default aging list target size is 2% of the dynamic paging area (DPA). The maximum aging list size is 5% of the DPA and the minimum size is 1 MB.
Early Writes
z/VM 6.3 introduces early writing of pages held in frames queued near the bottom of the global aging list. Early writing helps expedite frame reclaim.
Early writing's goal is to keep the bottom 10% of the global aging list prewritten. The percentage of the aging list prewritten can float because of changes in the system and constraint level. In a system where writing to paging DASD is the constraint, the prewritten section can go empty.
When the prewritten section is empty and the system needs frames, reclaim of a frame has to wait for the frame's content to be written to DASD. This is called write-on-demand.
Early writing can be set on or off via command or system configuration file entry.
Improved Channel Programs
In z/VM 6.3 the paging subsystem's channel programs are enhanced to use Locate Record channel-command words. These improved paging channel programs can read or write discontiguous slots on DASD.
No Rewriting of Unchanged Pages
Paging algorithms were enhanced to let pages remain associated with their backing slots on DASD when they are read. This approach lets the system avoid rewriting unchanged pages yet still lets paging blocks be formed when the frames are reclaimed.
Block Reads
Reading pages from DASD is still a block-read operation, the paging blocks having been formed at frame reclaim time. When a block read happens, one of the pages read is the one faulted upon, and the rest come in solely because they are part of the block. These "along for the ride" pages, called pages not referenced (PNRs), are inserted into the UFO at the top of the IBR section. In previous releases PNRs were inserted at the top of the UFO. The change lets demand scan more quickly identify pages not being referenced.
The Available List
In z/VM 6.3 available list management was improved in a number of different ways.
The first improvement relates to how demand scan is triggered. Requests to allocate frames come into storage management via four different interfaces: TYPE=ANY singles or contiguous, which can be satisfied from either below-2-GB or above-2-GB storage, and TYPE=BELOW singles or contiguous, which can be satisfied by only below-2-GB frames. z/VM 6.2 initiated list replenishment by looking at only the available list populations. The change in z/VM 6.3 is that after each call to allocate storage, the system now evaluates the number of frames available to satisfy the TYPE=ANY calls, regardless of the frame lists that might be used to satisfy them. When a low threshold is reached for either of the TYPE=ANY calls, demand scan is initiated to refill the lists.
Further, TYPE=ANY requests are now satisfied from the top of storage down, using the below-2-GB frames last. This helps reduce the likelihood of a below-2-GB constraint.
Last, when below-2-GB frames need to be replenished, storage management now finds them via a scan of the real frame table instead of via scans of frame-owned lists. This eliminates long searches in large storage environments.
Maximum Virtual Storage
Mappable virtual storage is increased from 8 TB to 64 TB. This was accomplished by increasing the count of Page Table Resource Manager (PTRM) address spaces from 16 to 128. A PTRM space contains structures such as page tables. Each PTRM address space can map 512 GB of guest real storage. All PTRM address spaces are initialized at IPL.
| Figure 1. Memory Management Algorithm Visualization |
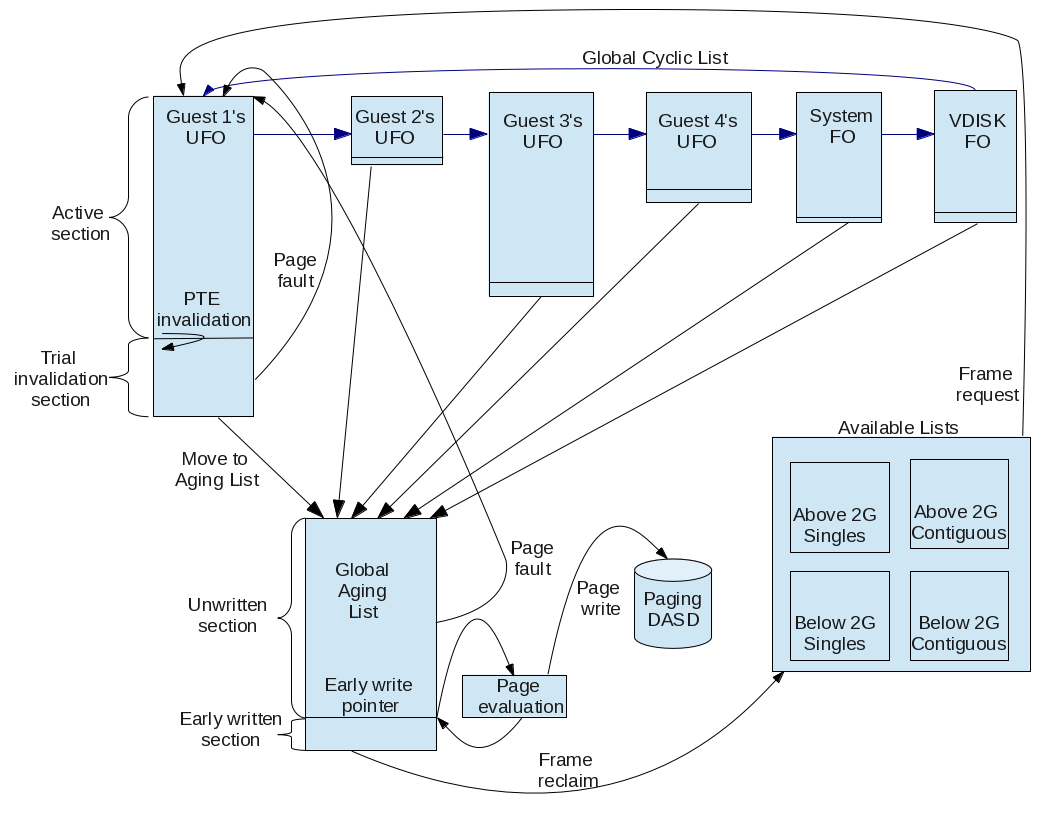 |
Method
z/VM 6.3 memory management enhancements were evaluated with Virtual Storage Exerciser (VIRSTOR) and Apache to create specialized workloads that would exercise known serialization and search conditions and evaluate scalability up to 1 TB of real storage. A wide variety of these specialized VIRSTOR and APACHE workloads were used.
Storage management algorithms of previous z/VM releases were dependent on efficient use of XSTORE while z/VM 6.3 algorithms do not depend on XSTORE. For z/VM 6.3 measurements, XSTORE was included in the configuration only to demonstrate why its use is not recommended. For direct comparison, z/VM 6.2 measurements were generally completed both with and without XSTORE and z/VM 6.3 was compared to the better of the z/VM 6.2 measurements.
For some z/VM 6.2 measurements, reorder processing was turned off and used as a comparison base for z/VM 6.3.
Specific configurations for comparison included storage sizes from 2.5 GB to 256 GB and dedicated processors from 1 to 24. Only four specific measurements are discussed in this article, but a summary of the others is included in Summary of Key Findings.
The LPAR used for scalability had dedicated processors but was subject to a variable amount of processor cache contention interference from other LPARs. Observed differences are discussed as needed in the results section.
The LPAR used for scalability had access to a single DASD controller for paging volumes. Although the defined paging volumes had dedicated logical control units, dedicated switches, and dedicated paths, interference from other systems also using the same DASD controller caused variation in the results.
The total capacity of the DASD subsystem limited the results of certain experiments. Observed differences are discussed as needed in the results section.
Specific configurations for scalability included storage sizes from 128 GB to 1 TB and dedicated processors from 2 to 8.
New z/VM monitor data available with the storage management support is described in Performance Management.
Results and Discussion
7 GB VIRSTOR
The 7 GB VIRSTOR workload consists of two groups of users. The first group, CM1, consists of two smaller VIRSTOR users that are actively looping through 13 MB of storage and changing every other page they touch. The second group, CM2, consists of 12 larger VIRSTOR users actively looping through 700 MB of storage and changing 10% of the pages they touch.
Fairness for this workload is evaluated in two different ways: fairness within groups and system-wide fairness.
-
Fairness within groups is
based on transaction rate. It is
calculated
by dividing the lowest loop count by the
highest loop count to determine how much
individual guests varied.
A result of 1 shows
perfect fairness in this category.
- System-wide fairness is at its core a statement about the system-wide correctness of page eviction. Demand scan aims to keep in storage the pages that are most frequently used. If its decisions are correct, higher processor utilization and decreased page wait both result.
Enhancements in z/VM 6.3 improved fairness within the CM1 group by 4% to a ratio of 0.99. z/VM 6.3 also improved fairness within the CM2 group by 59% to a value of 1.0.
System-wide fairness also improved, resulting in a 14% decrease in page wait and a 355% increase in processor utilization.
CM1 users' resident pages increased 298% to 3150. This is the exact amount of storage the CM1 users were designed to touch. This too shows that z/VM is keeping the most frequently used pages in storage.
CM1 users are revalidating their pages prior to them getting to the early write pointer. Figure 2 shows DASD writes in the first interval where the CM1 user's unneeded pages were written out. It shows no writing after the unneeded pages were written out. Zero DASD reads shows that the pages that were written were good choices because they were never read.
DASD writes for the CM1 users were reduced 99.4% and DASD reads were reduced 100%, leading to 1704% more virtual CPU used by the CM1 users. This resulted in the overall workload improvement.
| Figure 2. Excerpt of FCX 291 Page Activity Log for User CM100001 |
          <--------------------- Storage --------------->
                                             <Movement/s>
 Interval <--- Transition/s ----> <-Steal/s->
 End Time  Inst Relse Inval Reval Ready NoRdy Reads Write
 >>Mean>> 46837  48.2 7573K 7527K 24728 22034     0 46761
 22:28:25 1110K  1170 8247K 7708K 15715  522K     0  537K
 22:28:55     0     0 9069K 9069K     0     0     0     0
 22:29:25     0     0 8809K 8809K     0     0     0     0
 22:29:55     0     0 9208K 9208K     0     0     0     0
 22:30:25     0     0 8761K 8761K     0     0     0     0
 22:30:55     0     0 8666K 8666K     0     0     0     0
 22:31:25     0     0 8600K 8600K     0     0     0     0
 22:31:55     0     0 8509K 8509K     0     0     0     0
 22:32:25     0     0 8150K 8150K     0     0     0     0
 22:32:55     0     0 8294K 8294K     0     0     0     0
 22:33:25     0     0 8273K 8273K     0     0     0     0
 22:33:55     0     0 8149K 8149K     0     0     0     0
 22:34:25     0     0 7950K 7950K     0     0     0     0
 22:34:55     0     0 7748K 7748K     0     0     0     0
 22:35:25     0     0 8170K 8170K     0     0     0     0
 22:35:55     0     0 7485K 7485K     0     0     0     0
 22:36:25     0     0 7712K 7712K     0     0     0     0
 22:36:55     0     0 7814K 7814K     0     0     0     0
|
The number of pages on DASD increased 56% because of the new scheme used that does not release backing slots when pages are read.
This measurement received a benefit from the DASD subsystem keeping the backing page slots. It avoided rewriting pages whose contents were already on DASD, resulting in a 77% decrease in the page write rate.
The count of PTRM address spaces increased from 1 to 128, because all PTRM address spaces are now initialized at IPL.
Figure 3 is an excerpt from a z/VM Performance Toolkit FCX296 STEALLOG report introduced in z/VM 6.3. It shows all of the following things:
- Demand scan was active 20% of the time on average.
- Demand scan produced an average of 399 MB worth of frames per second.
- Demand scan was writing on demand during the startup intervals of this workload.
- User pages were invalidated at a rate of 414 MB per second.
- User pages were revalidated in the UFO IBR section at a rate of 324 MB per second.
- Aging list revalidations averaged 69 MB per second. This rate being lower than the invalidations shows that pages moved to the aging list were good choices for reclaim.
Revalidation counts include PNRs that are revalidated. Because of this, the revalidation counts can be greater than the invalidation counts.
| Figure 3. Excerpt of FCX296 STEALLOG |
            Pct <---- Storage/s------->
 Interval  Time Total Write <--User--->  AgeL
 End Time  Actv Stoln OnDmd Inval Reval Reval
 >>Mean>>  20.2  399M 8067K  414M  324M   69M
 22:28:25  10.9  319M  144M  335M  191M 7230K
 22:28:55  23.9  564M   13M  581M  523M   40M
 22:29:25  23.4  520M    .0  537M  455M   64M
 22:29:55  23.3  500M  1775  518M  418M   82M
 22:30:25  22.4  457M  283K  474M  374M   82M
 22:30:55  22.6  445M    .0  462M  360M   85M
 22:31:25  22.7  440M 60484  456M  356M   84M
 22:31:55  23.0  437M    .0  453M  352M   84M
 22:32:25  22.1  414M    .0  430M  333M   81M
 22:32:55  22.4  422M    .0  438M  339M   83M
 22:33:25  22.3  420M    .0  436M  337M   83M
 22:33:55  22.2  415M    .0  431M  334M   81M
 22:34:25  22.0  403M    .0  419M  324M   80M
 22:34:55  21.6  391M    .0  406M  313M   78M
 22:35:25  22.7  416M    .0  432M  334M   81M
 22:35:55  20.4  379M    .0  394M  304M   75M
 22:36:25  21.4  391M    .0  406M  314M   77M
 22:36:55  21.9  396M    .0  411M  318M   78M
|
| Table 1. 7 GB VIRSTOR | ||||
| Run ID | 7VW7280 | 7VX7280 | Delta | Pct |
| CP Level | 6.2.0 | 6.3.0 | ||
| ETR | 1.9451 | 30.4431 | 28.4980 | 1465.1 |
| ITR | 11.86 | 40.75 | 28.89 | 243.6 |
| Total Util/Proc | 16.4 | 74.7 | 58.3 | 355.5 |
| CM1 Fairness | 0.952 | 0.991 | 0.039 | 4.1 |
| CM2 Fairness | 0.629 | 1.000 | 0.371 | 59.0 |
| CM1 ETR | 1.6824 | 30.3293 | 28.6469 | 1702.7 |
| CM2 ETR | 0.2627 | 0.1138 | -0.1489 | -56.7 |
| SYSTEM PGW Wait | 90 | 77 | -13 | -14.4 |
| Page slot util | 16 | 25 | 9 | 56.3 |
| PTRM Spaces | 1 | 128 | 127 | 12700 |
| DASD Pg Write Rate | 62393 | 14187 | -48206 | -77.3 |
| DASD Pg Read Rate | 62539 | 101000 | 38461 | 61.5 |
| CM1 group Virt CPU Sec | 26.64 | 480.6 | 454.0 | 1704.2 |
| CM1 group DASD Reads | 2041 | .0 | -2041.0 | -100.0 |
| CM1 group DASD Writes | 1820 | 11.4 | -1808.6 | -99.4 |
| CM1 group Resident Pages | 790 | 3150 | 2360 | 298.7 |
| CM2 group DASD Reads | 4883 | 8466 | 3583 | 73.4 |
| CM2 group DASD Writes | 4901 | 1181 | -3720 | -75.9 |
| Notes: 2097-726, 3 dedicated CPUs, 7 GB real. Four 8.0 Gbps Fibre-channel switched channels, 2107-E8 control unit, 34 3390-3 volumes. 12 CM2 users, 2 CM1 users. | ||||
Apache 3 GB XSTORE
The Apache 3 GB XSTORE workload is designed to page to only XSTORE in z/VM 6.2. Because of the changes in z/VM 6.3, XSTORE is no longer as efficient and cannot be used as a paging device as it was in past releases. Table 2 shows that z/VM 6.3 does not get the benefit from XSTORE that z/VM 6.2 did.
Using XSTORE in this environment results in wasted page writes to DASD. These writes take system resources away from the rest of the workload. In z/VM 6.3 a page needs to be written to DASD before it is put into XSTORE. This constrains XSTORE writes to the speed of the DASD.
As a result of using z/VM 6.3 on a non-recommended hardware configuration, ETR decreased 8% and ITR decreased 12%.
If you have a system that pages to only XSTORE, similar to the Apache 3 GB XSTORE, IBM recommends that you set the agelist to the minimum size and turn off agelist early writes.
|
Table 2. Apache 3 GB XSTORE | ||||
| Run ID | APXW9120 | APXXM820 | Delta | Pct |
| CP Level | 6.2.0 | 6.3.0 | ||
| ETR | 394.148 | 362.740 | -31.408 | -8.0 |
| ITR | 417.79 | 366.70 | -51.09 | -12.2 |
| Xstor Total Rate | 146000 | 132000 | -14000 | -9.6 |
| Xstor Migr Rate | 0 | 0 | 0 | - |
| Xstor PGOUT Rate | 73241 | 66047 | -7194 | -9.8 |
| Xstor PGIN Rate | 73182 | 65980 | -7202 | -9.8 |
| DASD Pg Write Rate | 0 | 3450 | 3450 | - |
| DASD Pg Read Rate | 0 | 0 | 0 | - |
| Notes: 2827-772, 3 dedicated CPUs. Four 8.0 Gbps Fibre-channel switched channels, 2107-E8 control unit, 34 3390-3 volumes. | ||||
Maximum z/VM 6.2 Configuration
Although Summary of Key Findings addresses the comparison of z/VM 6.3 measurements to z/VM 6.2 measurements, two specific comparisons are included here to demonstrate attributes of the storage management enhancements.
Workloads affected by the reorder process or by serial searches can receive benefit from the new storage management algorithms. Workloads not affected by the reorder process or serial searches show equality.
Following are two specific workload comparisons at the maximum supported z/VM 6.2 configuration (256 GB real plus 128 GB XSTORE) versus the z/VM 6.3 replacement configuration (384 GB real). One workload shows benefit and the other shows equality.
Maximum z/VM 6.2 Configuration, VIRSTOR
Table 3 contains a comparison of selected values between z/VM 6.3 and z/VM 6.2 for a VIRSTOR workload. This workload provides a good demonstration of the storage management change between these two releases.
The 3665 reorders for z/VM 6.2 are gone in z/VM 6.3. Each reorder processed a list in excess of 500,000 items. This accounts for a portion of the reduction in system utilization.
Although other serial searches are not as easy to quantify, the effect of their elimination is best represented by the 99% reduction in spin time and the 84% reduction in system utilization.
Moving the z/VM 6.2 XSTORE to real storage in z/VM 6.3 eliminated 77,000 XSTORE paging operations per second, which accounts for some of the reduction in system time. This would be partially offset by the 53% increase in DASD paging rate.
The 28% reduction in T/V ratio is another indicator of the benefit from elimination of serial searches.
This workload also provides a good demonstration of changes in the below-2-GB storage usage. There are no user pages below 2 GB in z/VM 6.2 but more than 88% of the below-2-GB storage contains user pages in z/VM 6.3.
Based on the z/VM 6.3 algorithm to leave pages in the same DASD slot, one would expect the number of pages on DASD to be higher than for z/VM 6.2. However, for this workload the number of pages on DASD increased less than 5%. Revalidation of pages prior to reaching the early write point is the key, and perhaps this is a valid demonstration of the benefit of the z/VM 6.3 selection algorithm.
Overall, the z/VM 6.3 changes provided a 70% increase in transaction rate and a 71% increase in ITR for this workload.
|
Table 3. Maximum z/VM 6.2 Configuration, VIRSTOR | ||||
| Run ID | STWG522W | STXG614H | Delta | Pct |
| CP Level | 6.2.0 | 6.3.0 | ||
| SYSGEN Storage (GB) | 256 | 384 | 128 | 50.0 |
| Total CP Xstor (GB) | 128 | 0 | -128 | -100.0 |
| ETR | 0.0746 | 0.1274 | 0.0528 | 70.8 |
| ITR | 77.77 | 133.63 | 55.86 | 71.8 |
| System Util/Proc | 31.4 | 5.0 | -26.4 | -84.1 |
| Pct Spin Time | 5.655 | .033 | -5.622 | -99.4 |
| Page slot util | 9 | 10 | 1 | 11.1 |
| Total Util/Proc | 96.6 | 94.9 | -1.7 | -1.8 |
| DASD Service Time | 1.5 | 1.1 | -0.4 | -26.7 |
| DASD Pg Total Rate | 61836 | 94721 | 32885 | 53.2 |
| T/V Ratio | 1.51 | 1.08 | -0.43 | -28.5 |
| Reorder Count | 3665 | na | ||
| Reorder Res Gbytes | 7629.39 | na | ||
| Resident Pages <2G | 0 | 466465 | 466465 | - |
| Resident Pages >2G | 61429536 | 94748945 | 33319409 | 54.2 |
| Resident DASD | 53668080 | 55681740 | 2013660 | 3.8 |
| CP Util/Proc | 32.4 | 6.9 | -25.5 | -78.7 |
| Emul Util/Proc | 64.2 | 88.0 | 23.8 | 37.1 |
| Master Util/Proc | 96.7 | 94.6 | -2.1 | -2.2 |
| Master Emul Util/Proc | 51.6 | 82.9 | 31.3 | 60.7 |
| Notes: 2817-744, 4 dedicated CPUs. Four 8.0 Gbps Fibre-channel switched channels, 2107-E8 control unit, 48 3390-54 volumes. 32 VIRSTOR1 users (20 GB, SHARE 100), 32 VIRSTOR2 users (20 GB, SHARE 200), 32 VIRSTOR3 users (20 GB, SHARE 300), 32 VIRSTOR4 users (20 GB, SHARE 400). VIRSTOR parms (AE B=32000 C=2 G=600 I=20 N=160 RD=16 RW=7200 S=1250 T=1800 WR=16 Z=120). | ||||
Maximum z/VM 6.2 Configuration, Apache
Table 4 contains a comparison of selected values between z/VM 6.3 and z/VM 6.2 for an Apache workload. This workload provides a good demonstration of the storage management changes between these two releases.
The 603 reorders for z/VM 6.2 are gone in z/VM 6.3. Each reorder processed a list in excess of 600,000 items. This accounts for a portion of the reduction in system utilization.
Although other serial searches are not as easy to quantify, the effect of their elimination is best represented by the 89% reduction in spin time and the 84% reduction in system utilization.
Moving the z/VM 6.2 XSTORE to real storage in z/VM 6.3 eliminated 82,000 XSTORE paging operations per second, which would account for some of the reduction in system time. There was also an 11.5% decrease in DASD paging rate.
The 6.6% reduction in T/V ratio is much smaller than the storage management metrics. This occurs because storage management represents a smaller percentage of this workload than it did in the previous workload.
This workload also provides a good demonstration of changes in the below-2-GB storage usage. There are only 73 user pages below 2 GB in z/VM 6.2 but more than 90% of the below-2-GB storage contains user pages in z/VM 6.3.
Based on the z/VM 6.3 algorithm to leave pages in the same DASD slot, one would expect the number of pages on DASD to be higher than for z/VM 6.2. However, for this workload the number of pages on DASD decreased 1.2%. Revalidation of pages prior to reaching the early write point is the key, and perhaps this is a valid demonstration of the benefit of the z/VM 6.3 selection algorithm.
Although many of the specific storage management items showed similar percentage improvement as the previous workload, storage management represents a much smaller percentage of this workload, so the overall results didn't show much improvement.
Overall, the z/VM 6.3 changes provided a 1.3% increase in transaction rate and a 1.5% decrease in ITR for this workload.
| Table 4. Maximum z/VM 6.2 Configuration, Apache | ||||
| Run ID | A38W952A | A38XGLD0 | Delta | Pct |
| SYSGEN Storage (GB) | 256 | 384 | 128 | 50.0 |
| Total CP Xstor (GB) | 128 | 0 | -128 | -100.0 |
| ETR | 720.332 | 729.670 | 9.338 | 1.3 |
| ITR | 716.23 | 705.56 | -10.67 | -1.5 |
| CP Level | 6.2.0 | 6.3.0 | ||
| Resident Pages <2G | 73 | 486837 | 486764 | >9999 |
| Pct Spin Time | 1.061 | .112 | -0.949 | -89.4 |
| DASD Service Time | 5.4 | 5.1 | -0.3 | -5.6 |
| DASD Pg Total Rate | 33574 | 29702 | -3872 | -11.5 |
| Resident DASD | 34066034 | 33670739 | -395295 | -1.2 |
| Reorder Count | 603 | na | ||
| Reorder Res Gbytes | 1544.41 | na | ||
| CP Util/Proc | 33.1 | 26.9 | -6.2 | -18.7 |
| System Util/Proc | 7.0 | 1.1 | -5.9 | -84.3 |
| T/V Ratio | 1.52 | 1.42 | -0.10 | -6.6 |
| Xstor Total Rate | 82489 | 0 | -82489 | -100.0 |
| Xstor Migr Rate | 15999 | 0 | -15999 | -100.0 |
| DASD Pg Read Rate | 16361 | 16047 | -314 | -1.9 |
| DASD Pg Write Rate | 17214 | 13655 | -3559 | -20.7 |
| Notes: 2817-744, 9 dedicated CPUs. Four 8.0 Gbps Fibre-channel switched channels, 2107-E8 control unit, 48 3390-54 volumes. | ||||
Non-overcommitted Storage Scaling
This set of measurements was designed to evaluate storage scaling from 128 GB to 1 TB for a non-overcommitted workload. All measurements used the same number of processors and a primed VIRSTOR workload that touched all of its pages. A virtual storage size was selected for each measurement that would use approximately 90% of the available storage. If there are no scaling issues, transaction rate and ITR should remain constant.
z/VM 6.2 avoided some known serial searches by not using below-2-GB storage for user pages in certain storage sizes. Because z/VM 6.3 uses below-2-GB storage for user pages in all supported configurations, the purpose of this experiment was to verify that the scalability of extended storage support was not affected by the new below-2-GB storage algorithm. Because only 90% of the storage is used in each configuration, this verifies the z/VM algorithm of using the below-2-GB last instead of first. Full utilization of below-2-GB storage is evaluated in the overcommitted scalability section.
Table 5 contains a comparison of selected results for the VIRSTOR non-overcommitted storage scaling measurements.
Results show nearly perfect scaling for both the transaction rate and ITR. Figure 4 illustrates these results.
Results show nearly perfect fairness among the users. Fairness is demonstrated by comparing the minimum loops and maximum loops completed by the individual VIRSTOR users. The variation was less that 3% in all four measurements.
| Table 5. Non-overcommitted Storage Scaling | ||||
| Run ID | STXG614I | STXG614J | STXG614K | STXG614L |
| SYSGEN Storage (GB) | 128 | 256 | 512 | 1024 |
| SYSGEN Storage ratio | 1.000 | 2.000 | 4.000 | 8.000 |
| VIRSTOR End ADDR (GB) | 16 | 30 | 58 | 114 |
| VIRSTOR1 ETR ratio | 1.000 | 0.998 | 1.038 | 1.081 |
| VIRSTOR1 Min Loops | 543 | 273 | 143 | 75 |
| VIRSTOR1 Max Loops | 556 | 278 | 146 | 76 |
| ITR ratio | 1.000 | 1.053 | 1.099 | 1.074 |
| Resident Pages <2G | 24 | 24 | 24 | 24 |
| Resident Pages >2G | 29424000 | 58800000 | 117504000 | 234960000 |
| PTRM Reside | 230000 | 460000 | 918000 | 1836000 |
| Resident Pages <2G ratio | 1.000 | 1.000 | 1.000 | 1.000 |
| Resident DASD ratio | 1.000 | 5.400 | 4.967 | 1.300 |
| Resident Pages >2G ratio | 1.000 | 1.998 | 3.993 | 7.985 |
| PTRM Reside ratio | 1.000 | 2.000 | 3.991 | 7.983 |
| Notes: 2817-744, 4 dedicated CPUs. Four 8.0 Gbps Fibre-channel switched channels, 2107-E8 control unit, 48 3390-54 volumes. 8 users. VIRSTOR parms (C=3 I=4 T=600 V=4). | ||||
| Figure 4. Non-overcommitted VIRSTOR Scaling Curve |
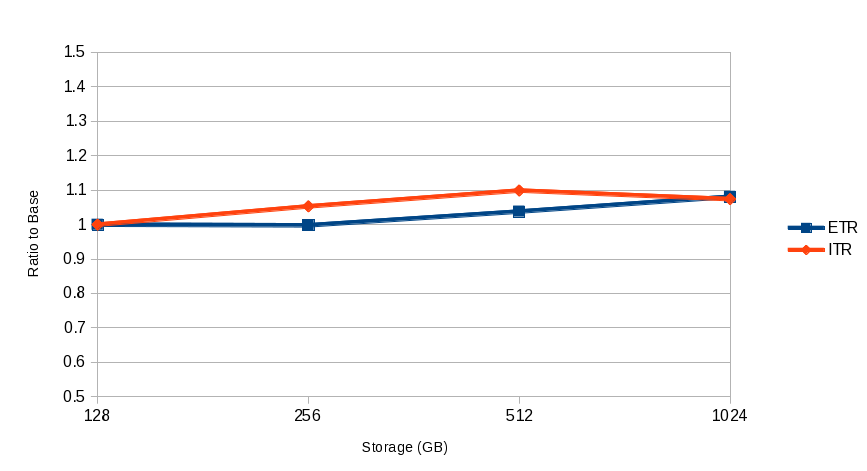 |
Overcommitted VIRSTOR Scaling of Storage, Processors, Users, and Paging Devices
For this scaling experiment, all resources and the workload were scaled by the same ratio. For perfect scaling, the transaction rate and ITR would scale with the same ratio as the resources.
Although number of paging devices was scaled as other resources, they are all on the same real DASD controller, switches, and paths. Because of this, DASD control unit cache did not scale at the same ratio as other resources. DASD service time is highly dependent on sufficient control unit cache being available.
Table 6 contains a comparison of selected results for the VIRSTOR storage-overcommitted scaling measurements.
For the set of four measurements, as storage, processors, users, and paging devices increased, DASD service time increased more than 100%. Despite the increase in DASD service time, DASD paging rate, number of resident pages, number of PTRM pages, and number of DASD resident pages increased in proportion to the workload scaling factors.
Despite the increase in DASD service time, processor utilization decreased by less than 3% across the set of four measurements.
Figure 5 illustrates that VIRSTOR transaction rate scaled nearly perfectly with the workload and configuration scaling factors. This is a very good sign that the new storage management algorithms should not prevent the expected scaling.
ITR scaled nearly perfectly with the workload and configuration scaling factors. This is another very good sign that the new storage management algorithms should not prevent the expected scaling.
|
Table 6. Overcommited VIRSTOR Scaling | ||||
| Run ID | STXG614F | STXG614E | STXG614D | STXG614C |
| SYSGEN Storage (GB) | 256 | 512 | 768 | 1024 |
| SYSGEN Storage ratio | 1.000 | 2.000 | 3.000 | 4.000 |
| Processors | 2 | 4 | 6 | 8 |
| Paging devices | 12 | 24 | 36 | 48 |
| Paging devices ratio | 1.000 | 2.000 | 3.000 | 4.000 |
| VIRSTOR Users | 88 | 176 | 264 | 352 |
| VIRSTOR Users ratio | 1.000 | 2.000 | 3.000 | 4.000 |
| Total Util/Proc | 98.5 | 98.0 | 96.8 | 95.8 |
| VIRSTOR ETR ratio | 1.000 | 2.000 | 3.000 | 4.023 |
| ITR ratio | 1.000 | 2.009 | 3.053 | 4.140 |
| DASD Pg Total Rate ratio | 1.000 | 1.908 | 2.789 | 3.575 |
| Resident Pages Total ratio | 1.000 | 2.001 | 3.002 | 4.004 |
| Resident DASD ratio | 1.000 | 1.988 | 2.957 | 3.930 |
| PTRM Reside ratio | 1.000 | 1.997 | 2.981 | 3.973 |
| DASD Service Time ratio | 1.000 | 1.522 | 1.913 | 2.228 |
| VIRSTOR1 Page Fairness | 0.986 | 0.979 | 0.982 | 0.979 |
| VIRSTOR2 Page Fairness | 0.989 | 0.986 | 0.981 | 0.983 |
| VIRSTOR3 Page Fairness | 0.989 | 0.985 | 0.982 | 0.978 |
| VIRSTOR4 Page Fairness | 0.990 | 0.983 | 0.985 | 0.986 |
| Notes: 2817-744. Four 8.0 Gbps Fibre-channel switched channels, 2105-E8 control unit, 3390-54 volumes. VIRSTOR1 users (20 GB, SHARE 100), VIRSTOR2 users (20 GB, SHARE 200), VIRSTOR3 users (20 GB, SHARE 300), VIRSTOR4 users (20 GB, SHARE 400). VIRSTOR parms (AE B=512000 C=2 I=20 N=1280 RD=16 RW=57600 S=104 T=1800 WR=16 Z=960). | ||||
| Figure 5. Overcommitted VIRSTOR Scaling Curve |
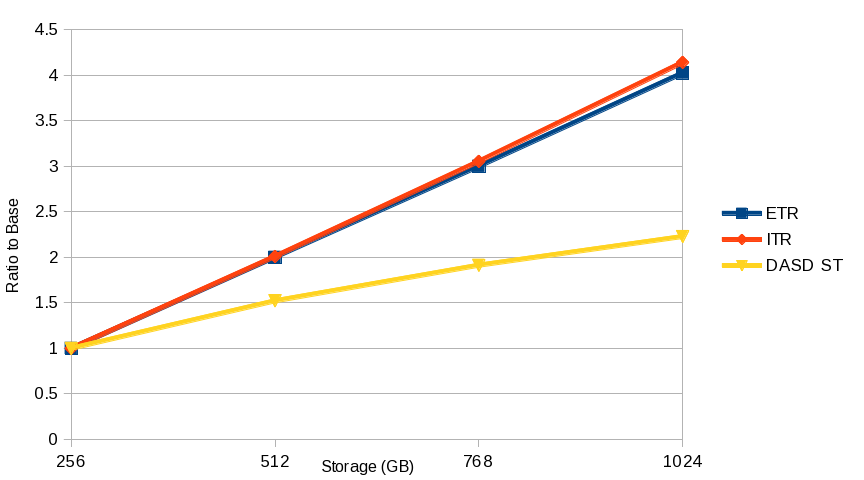 |
Overcommitted Apache Scaling of Storage, Processors, Users, and Paging Devices
For the Apache scaling measurements, storage, processors, AWM clients, and Apache servers were increased by the same ratio.
The full paging infrastructure available to the measurement LPAR was used in all measurements. All paging devices are on the same real DASD controller, switches, and paths. This DASD controller is also shared with other LPARs and other CECs thus exposing measurements to a variable amount of interference.
Table 7 contains a comparison of selected results for the Apache storage-overcommitted scaling measurements.
For the set of four measurements, as storage, processors, AWM clients, and Apache servers increased, number of resident pages, number of PTRM pages, and number of DASD pages increased nearly identical to the workload and configuration factors.
For the set of four measurements, as storage, processors, AWM clients, and Apache servers increased, DASD service time increased.
With the increased DASD service time, processor utilization could not be maintained at a constant level. This prevented the transaction rate from scaling at a rate equal to the workload and configuration scaling.
Although ITR didn't scale as well as the previous workload, it was not highly affected by the increasing DASD service time and scaled as expected. Figure 6 illustrates this scaling.
Despite the fact that the paging infrastructure could not be scaled as other workload and configuration factors, this experiment demonstrates the ability of the storage management algorithms to continue scaling. System utilization remained nearly constant throughout the set of measurements and is another good sign for continued scaling.
|
Table 7. Overcommited Apache Scaling | ||||
| Run ID | A56XGLD0 | A12XGLD0 | A68XGLD0 | A1TXGDL3 |
| SYSGEN Storage (GB) | 256 | 512 | 768 | 1024 |
| Processors | 2 | 4 | 6 | 8 |
| Processors ratio | 1.000 | 2.000 | 3.000 | 4.000 |
| Clients ratio | 1.000 | 2.000 | 3.000 | 4.000 |
| Servers ratio | 1.000 | 2.000 | 3.000 | 4.000 |
| ETR | 141.551 | 270.615 | 400.684 | 437.466 |
| ITR | 144.79 | 278.86 | 426.23 | 541.11 |
| ITR ratio | 1.000 | 1.926 | 2.944 | 3.737 |
| Total Util/Proc | 98.2 | 99.9 | 95.9 | 80.9 |
| System Util/Proc | 2.5 | 2.7 | 2.6 | 2.4 |
| DASD Service Time | 0.9 | 1.1 | 2.9 | 4.9 |
| DASD Service Time ratio | 1.000 | 1.222 | 3.222 | 5.444 |
| Resident DASD | 21758673 | 44553845 | 66713500 | 86049187 |
| PTRM Reside | 689000 | 1356000 | 1921000 | 2562000 |
| PTRM DASD | 7770 | 4456 | 103000 | 125624 |
| DASD Pg Total Rate | 16687 | 35834 | 53363 | 60968 |
| PTRM Reside ratio | 1.000 | 1.968 | 2.788 | 3.718 |
| DASD Pg Total Rate ratio | 1.000 | 2.147 | 3.198 | 3.654 |
| PTRM DASD ratio | 1.000 | 0.573 | 13.256 | 16.168 |
| Page slot util | 4 | 8 | 12 | 15 |
| Resident Pages <2G | 486063 | 478642 | 481875 | 482034 |
| Resident Pages >2G | 65296000 | 130118000 | 196125000 | 262269000 |
| Notes: 2817-744. Four 8.0 Gbps Fibre-channel switched channels, 2107-E8 control unit, 48 3390-54 volumes. | ||||
| Figure 6. Overcommitted Apache Scaling Curve |
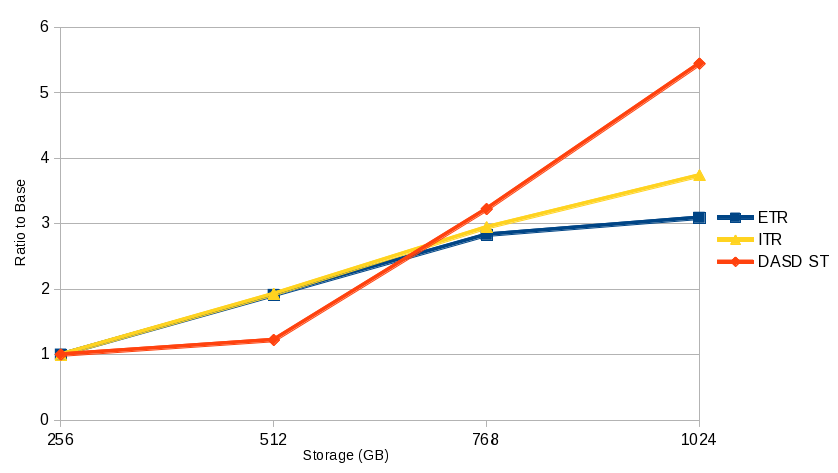 |
Summary and Conclusions
z/VM 6.3 extends the maximum supported configuration to 1 TB of real storage and 128 GB of XSTORE and provides several storage management enhancements that let real storage scale efficiently past 256 GB in a storage-overcommitted environment.
Although XSTORE is still supported, it functions differently now and its use is not recommended. When migrating from an older level of z/VM, any XSTORE should be reconfigured as real storage.
z/VM 6.3 also increases maximum addressable virtual storage to 64 TB. The count of Page Table Resource Manager (PTRM) address spaces increased from 16 to 128 and are all initialized at IPL.
Reorder processing has been removed and replaced with algorithms that scale more efficiently past 256 GB.
Below-2-GB storage is now used for user pages in all supported real storage sizes. To help reduce serial searches, below-2-GB storage is now used last, and the below-2-GB available list is refilled by scanning the real memory frame table.
Workloads affected by the reorder process or by serial searches in previous z/VM releases generally receive benefit from the new storage management algorithms in z/VM 6.3.
Workloads not affected by the reorder process or serial searches in previous z/VM releases generally show similar results on z/VM 6.3.
Although some of the specific experiments were limited by configuration, workload scaling to 1 TB was not limited by storage management searching algorithms.
In general, it is recommended to keep the default aging list size. Systems that never run storage-overcommitted should be run with the global aging list set to minimum size and with global aging list early writes disabled.
Back to Table of Contents.
z/VM HiperDispatch
Abstract
The z/VM HiperDispatch enhancement exploits System z and PR/SM technologies to improve efficiency in use of CPU resource. The enhancement also changes z/VM's dispatching heuristics for guests, again, to help improve CPU efficiency. According to the characteristics of the workload, improvements in measured workloads varied from 0% up to 49% on ETR.
z/VM HiperDispatch also contains technology that can sense and correct for excessive MP level in its partition. According to the characteristics of the workload, this technology can even further improve efficiency in use of CPU, but how this affects ETR is a function of the traits of the workload.
Introduction
In z/VM 6.3 IBM introduced the z/VM HiperDispatch enhancement. With this enhancement z/VM now exploits System z and PR/SM technology meant to help a partition to run more efficiently. Also with this enhancement z/VM has changed the heuristics it uses for dispatching virtual servers, to help virtual servers to get better performance.
Our Understanding z/VM HiperDispatch article contains a functional description of the z/VM HiperDispatch enhancement. The article includes discussions of relevant System z and PR/SM concepts. The article also discusses workloads, measurements, and z/VM Performance Toolkit. The reader will probably find it helpful to refer to that article in parallel with reading this chapter of the report.
Method
To measure the effect of z/VM HiperDispatch, two suites of workloads were used.
The first suite consisted of workloads routinely used to check regression performance of z/VM. Generally speaking these workloads are either CMS-based or Linux-based and are not necessarily amenable to being improved by z/VM HiperDispatch. As cited in Summary of Key Findings, generally these workloads did not experience significant changes on z/VM 6.3 compared to z/VM 6.2.
The second suite of workloads consisted of tiles of Virtual Storage Exerciser virtual servers, crafted so that the workload would be amenable to being improved by z/VM HiperDispatch. These amenable workloads were run in an assortment of configurations, varying the makeup of a tile, the number of tiles, the N-way level of the partition, and the System z machine type. The suite was run in a dedicated partition while said partition was the only partition activated on the CEC. This assured that logical CPU motion would not take place and that interference from other partitions would not be a factor in a difference in results. The suite was also run in such a fashion that the topology of the partition would be the same for a given N-way for all of the various releases and configurations. This assured that a topology difference would not be a factor in a difference in results. Finally, the suite was run very memory-rich.
The writeup below presents select representatives from the second suite. Cases presented are chosen to illustrate various phenomena of interest.
Results and Discussion
It Needs Room to Work
When there are far more ready-to-run virtual CPUs than there are logical CPUs, z/VM HiperDispatch does not improve the workload's result. But as partition capacity increases for a given size of workload, z/VM HiperDispatch can have a positive effect on workload performance. In other words, if the workload fits the partition, z/VM HiperDispatch can make a difference.
To illustrate this several different families of measurements are presented.
One family is eight light, high-T/V tiles. Each light tile consists of three virtual CPUs that together produce 81% busy. Thus running eight of them produces 24 virtual CPUs that together attempt to draw 648% chargeable CPU time. This workload runs with T/V that increases with increasing N. At N=8 the T/V is approximately 1.5.
Figure 1 illustrates the result for this workload in a variety of N-way configurations. z/VM 6.3 had little effect on this workload until N=8. At N=8, z/VM 6.2 had ETR 8,567, but z/VM 6.3 vertical with rebalance had an ETR of 10,625 for an increase of 24%. As illustrated on the chart, z/VM 6.3 run vertically did better on this workload than z/VM 6.2 at all higher N-way levels. This graph helps to illustrate that z/VM 6.3 run horizontally differs very little from z/VM 6.2.
| Figure 1. zEC12, 8 light tiles, high T/V, ETR as f(N-way), for N=1, 4, 8, 16, 24, and 32, for z/VM 6.2, z/VM 6.3 horizontal (H), z/VM 6.3 vertical reshuffle (V F), and z/VM 6.3 vertical rebalance (V B). |
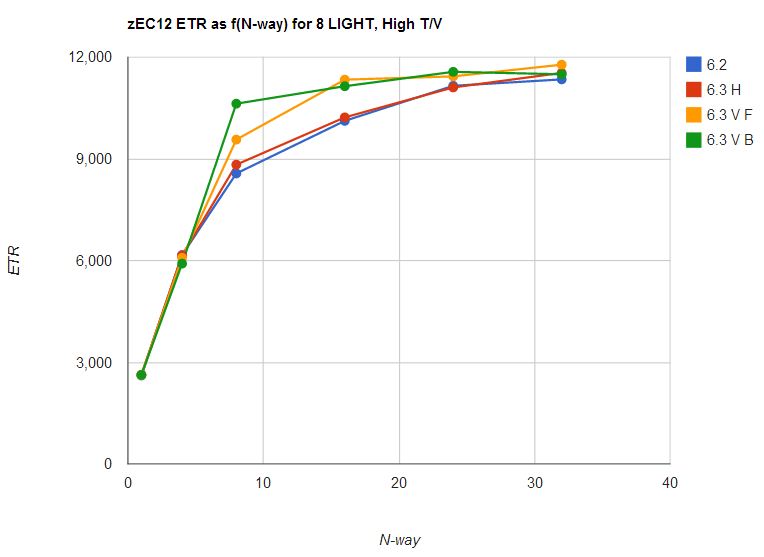
|
Another family is 16 light, low-T/V tiles. Each light tile consists of three virtual CPUs that together produce 81% busy. Thus running 16 of them produces 48 virtual CPUs that together attempt to draw 1296% chargeable CPU time. This workload runs with T/V of 1.00.
Figure 2 illustrates the result for this workload in a variety of N-way configurations. z/VM 6.3 had little effect on this workload until N=16. At N=16, z/VM 6.2 had ETR 17,628, but z/VM 6.3 vertical with rebalance had an ETR of 19,256 for an increase of 9%. At N=24 z/VM 6.3 vertical achieved an ETR of roughly 21,500, which was 26% better than the horizontal configurations' ETRs of roughly 17,100. This graph too helps to illustrate that z/VM 6.3 run horizontally differs very little from z/VM 6.2.
| Figure 2. zEC12, 16 light tiles, low T/V, ETR as f(N-way), for N=1, 4, 8, 16, 24, and 32, for z/VM 6.2, z/VM 6.3 horizontal (H), z/VM 6.3 vertical reshuffle (V F), and z/VM 6.3 vertical rebalance (V B). |
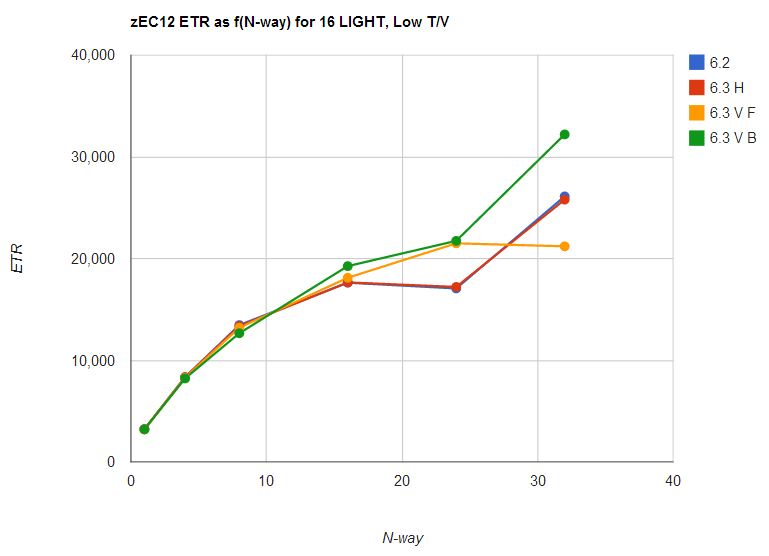
|
Another family is two heavy, low-T/V tiles. Each heavy tile consists of 13 virtual CPUs that together produce 540% busy. Thus running two of them produces 26 virtual CPUs that together attempt to draw 1080% chargeable CPU time. This workload runs with T/V of 1.00.
Figure 3 illustrates the result for this workload in a variety of N-way configurations. z/VM 6.3 had little effect on this workload until N=8. At N=16 the two horizontal configurations had ETR of 25,500 but the two vertical configurations had ETR of 27,700 or an increase of 8.7%.
| Figure 3. zEC12, 2 heavy tiles, low T/V, ETR as f(N-way), for N=1, 4, 8, 16, 24, and 32, for z/VM 6.2, z/VM 6.3 horizontal (H), z/VM 6.3 vertical reshuffle (V F), and z/VM 6.3 vertical rebalance (V B). |
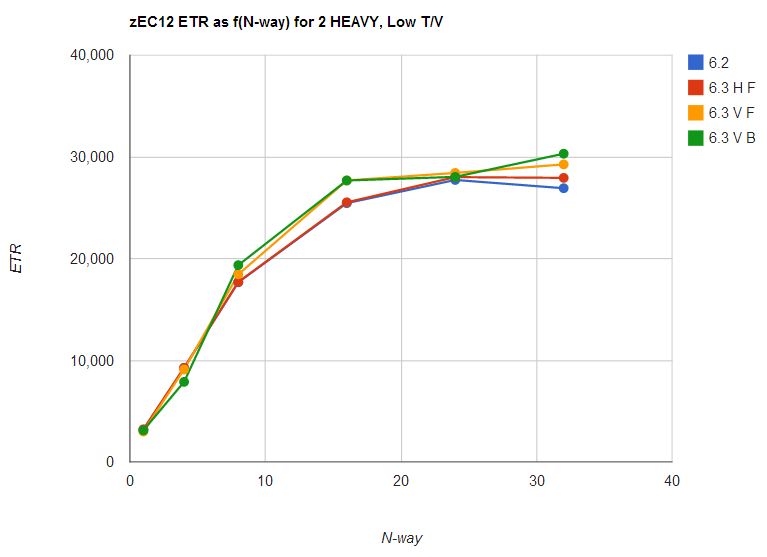
|
Another family is eight heavy, low-T/V tiles. Each heavy tile consists of 13 virtual CPUs that together produce 540% busy. Thus running eight of them produces 104 virtual CPUs that together attempt to draw 4320% chargeable CPU time. This workload runs with T/V of 1.00.
Figure 4 illustrates the result for this workload in a variety of N-way configurations. z/VM 6.3 had little effect on this workload until N=16. At N=16 z/VM 6.3 improved the workload by 7%. At N=24 z/VM 6.3 improved 21% over z/VM 6.2. At N=32 z/VM 6.3 improved 49% over z/VM 6.2.
| Figure 4. zEC12, 8 heavy tiles, low T/V, ETR as f(N-way), for N=1, 4, 8, 16, 24, and 32, for z/VM 6.2, z/VM 6.3 horizontal (H), z/VM 6.3 vertical reshuffle (V F), and z/VM 6.3 vertical rebalance (V B). |
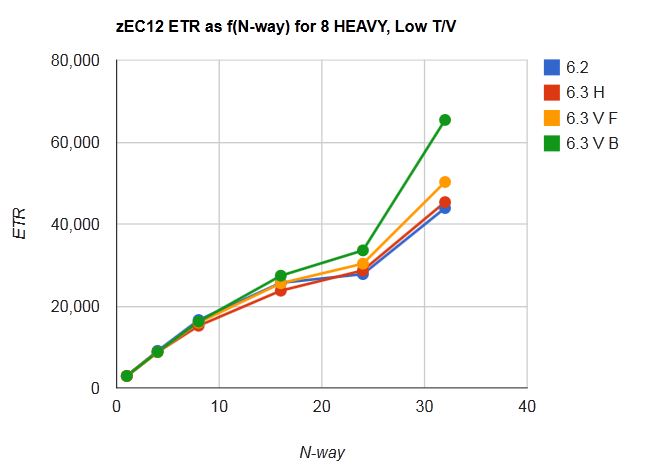
|
Effect of T/V-Based Parking
The purpose of T/V-based parking is to remove MP effect from the system if it appears from T/V ratio that MP effect might be elevated.
To show the effect of T/V-based parking, IBM ran the eight light tiles, high-T/V workload on z10, at various N-way levels, on z/VM 6.2, and on z/VM 6.3 with T/V-based parking disabled, and on z/VM 6.3 with T/V-based parking strongly enabled, and on z/VM 6.3 with T/V-based parking mildly enabled.
This workload has the property that its ETR is achieved entirely in a guest CPU loop whose instruction count per transaction is extremely steady. In other words, ETR is governed entirely by factors within the CPU. Consequently, this workload serves to illustrate both the potential benefits and the possible hazards associated with T/V-based parking.
Table 1 presents the results. Comments follow.
| Table 1. Effect of CPUPAD on a High-T/V Workload. | |||||
| z/VM -> | 6.2 | 6.3 | 6.3 | 6.3 | |
| T/V-based parking -> | n/a | none | strong | weak | |
| N | CPUPAD -> | n/a | 6400% | 100% | 300% |
| 8 | Run ID | GF003930 | GF003935 | GF003940 | GF003945 |
| Unparked LPUs | 8.0 | 8.0 | 8.0 | 8.0 | |
| %Total | 766.7 | 774.6 | 775.0 | 776.4 | |
| %Guests | 549.6 | 553.8 | 553.3 | 554.4 | |
| %c-CP | 98.5 | 94.3 | 94.8 | 93.7 | |
| %nc-CP | 118.6 | 126.5 | 126.9 | 128.3 | |
| T/V ratio | 1.39 | 1.40 | 1.40 | 1.40 | |
| SRMSLOCK coll /sec | 220000 | 230000 | 231000 | 233000 | |
| SRMSLOCK spin usec /coll | 1.091 | 1.257 | 1.247 | 1.270 | |
| SRMSLOCK spin sec /sec | 0.240 | 0.289 | 0.288 | 0.296 | |
| Tx/sec | 2940 | 2899 | 2912 | 2942 | |
| %Total /tx | 0.2608 | 0.2672 | 0.2661 | 0.2639 | |
| %Guests /tx | 0.1869 | 0.1910 | 0.1900 | 0.1884 | |
| %c-CP /tx | 0.0335 | 0.0325 | 0.0326 | 0.0318 | |
| %nc-CP /tx | 0.0403 | 0.0436 | 0.0436 | 0.0436 | |
| SRMSLOCK coll /tx | 74.830 | 79.338 | 79.327 | 79.198 | |
| SRMSLOCK spin usec /tx | 81.6 | 99.7 | 98.9 | 100.6 | |
| 16 | Run ID | GF003931 | GF003936 | GF003941 | GF003946 |
| Unparked LPUs | 16.0 | 16.0 | 13.7 | 15.1 | |
| %Total | 1255.4 | 1327.5 | 1009.4 | 1084.7 | |
| %Guests | 560.1 | 563.5 | 563.7 | 566.8 | |
| %c-CP | 88.0 | 84.5 | 84.4 | 81.2 | |
| %nc-CP | 607.3 | 679.5 | 361.3 | 436.7 | |
| T/V ratio | 2.24 | 2.36 | 1.79 | 1.91 | |
| SRMSLOCK coll /sec | 282000 | 273000 | 356000 | 338000 | |
| SRMSLOCK spin usec /coll | 13.05 | 15.85 | 4.740 | 6.706 | |
| SRMSLOCK spin sec /sec | 3.68 | 4.33 | 1.69 | 2.27 | |
| Tx/sec | 3412 | 3621 | 2836 | 2981 | |
| %Total /tx | 0.3679 | 0.3666 | 0.3559 | 0.3639 | |
| %Guests /tx | 0.1642 | 0.1556 | 0.1988 | 0.1901 | |
| %c-CP /tx | 0.0258 | 0.0233 | 0.0298 | 0.0272 | |
| %nc-CP /tx | 0.1780 | 0.1877 | 0.1274 | 0.1465 | |
| SRMSLOCK coll /tx | 82.649 | 75.394 | 125.529 | 113.385 | |
| SRMSLOCK spin usec /tx | 1078 | 1194 | 595 | 760 | |
| Notes: z10, memory-rich. 8 light tiles, high T/V. z/VM 6.3 is vertical mode with reshuffle. %c-CP is chargeable CP CPU utilization, sometimes called "guest CP time". %nc-CP is nonchargeable CP CPU utilization, sometimes called "system time". | |||||
At N=8, because of the size of the workload and because of the T/V value achieved, T/V-based parking did not engage and had no effect. No engines are parked and the results do not significantly differ across the three z/VM 6.3 columns.
At N=16 the effect of T/V-based parking is seen. At strong T/V-based parking (CPUPAD 100%), compared to running with all engines unparked, nonchargeable CP CPU time was decreased by (679.5 - 361.3) or 3.18 engines' worth of power. The (4.33 - 1.69) = 2.64 engines' worth of drop in SRMSLOCK spin time accounts for the majority of the drop in nonchargeable CP CPU time. At weak T/V-based parking (CPUPAD 300%), the same two effects are seen but not as strongly as when T/V-based parking was more strict. These findings illustrate that discarding excessive MP level can increase efficiency in using CPU.
In this particular workload, though, the guests experienced decreased ETR as parking increased. Because guest path length per transaction is very steady in this workload, the increase in %Guests/tx with increased parking accounts for the drop in memory stride rate and implies that the guests experienced increasing CPI with increased parking. This makes sense because with increased parking the work was being handled on fewer L1s. If the System z CPU Measurement Facility could separate guest CPI from z/VM Control Program CPI, we would undoubtedly see a small rise in guest CPI to explain the increase in %Guests/tx.
This table demonstrates that T/V-based parking has both advantages and drawbacks. While it might indeed increase efficiency inside the z/VM Control Program, the impact on ETR will be governed by what gates the workload's throughput. When ETR is governed by some external factor, such as service time on I/O devices, T/V-based parking has the potential to improve CPU efficiency with no loss to ETR.
In other words, the table illustrates that customers must evaluate T/V-based parking using their own workloads and then decide the intensity with which to enable it.
Summary and Conclusions
IBM's experiments illustrate that z/VM HiperDispatch can help the performance of a workload when the relationship between workload size and partition size allows it.
In IBM's measurements, workloads having a high ratio of runnable virtual CPUs to logical CPUs did not show benefit. As the ratio decreased, z/VM 6.3 generally showed improvements compared to z/VM 6.2. The amount of improvement varies according to the relationship between the size of the workload and the size of the partition.
T/V-based parking has the potential to improve efficiency of use of CPU time, but how ETR is affected is a function of the characteristics and constraining factors in the workload.
Back to Table of Contents.
System Dump Improvements
Abstract
Because z/VM 6.3 increased its supported storage to 1 TB, the z/VM dump program needed to add the capability to dump 1 TB. As part of these extensions, the rate at which dumps could be written to the dump devices was improved. For ECKD devices, dump rates improved 50% to 90% over z/VM 6.2. For EDEV devices, dump rates improved 190% to 1500% over z/VM 6.2.
Introduction
This article addresses performance enhancements for z/VM dump creation.
For ECKD, channel programs were improved to chain as many contiguous or noncontiguous frames as possible for each I/O operation.
For EDEV, each I/O now writes as many contiguous frames as possible.
These enhancements apply to both SNAPDUMP and PSW RESTART dumps.
Method
Virtual Storage Exerciser was used to create specialized workloads for evaluation of these performance improvements. The workloads merely populated a specific amount of storage prior to issuing the specific z/VM dump command being evaluated. Variations included number of guests and guest virtual storage size. Variations in these parameters affect the number of frames dumped by the z/VM dump program. Once the application had created the desired storage conditions, the appropriate z/VM dump command was issued.
Table 1 defines specific parameters for four load configurations. Results tables found later in this chapter identify loads by load configuration number defined here.
|
Table 1. Load Configurations |
||||
| Load Configuration -> | 1 | 2 | 3 | 4 |
| System Model | 2817-744 | 2817-744 | 2817-744 | 2817-744 |
| SYSGEN Storage | 256 GB | 256 GB | 1 TB | 1 TB |
| Processors (dedicated) | 4 | 4 | 4 | 4 |
| VIRSTOR Users | 1 | 10 | 10 | 1 |
| VIRSTOR End Addr | 230 GB | 3 GB | 100 GB | 990 GB |
| VIRSTOR Increment | 4 KB | 4 KB | 4 KB | 4 KB |
| Notes: 2817-744. I/O configuration details are included in each results table. | ||||
Experiments were constructed by varying configuration choices as follows:
- Both SNAPDUMP and PSW RESTART dumps were evaluated.
- Both ECKD and EDEV (Emulated FBA on SCSI) devices were evaluated.
- Storage sizes of 256 GB and 1 TB were evaluated.
- Measurements of 256 GB systems were completed on both z/VM 6.2 and z/VM 6.3.
- Measurements of 1 TB systems were completed only on z/VM 6.3.
The z/VM dump program collected the information necessary to determine the rate.
Results and Discussion
The results tables include the following columns:
- %FT, which is the percentage of dumped frames that are CP frame table frames.
- Elps Time, which is the dump elapsed time, in seconds.
- Rate, which is the dump rate, in frames per second.
256 GB Storage With ECKD Devices
Table 2 contains the results for both z/VM 6.2 and z/VM 6.3 measurements using ECKD devices in 256 GB of storage.
|
Table 2. ECKD Dumps With 256 GB |
|||||||||
| LOAD | DASD | Dump | Dumped | % | Elps | ||||
| Run ID | Conf | Type | Type | Rel | Size | Frames | FT | Time | Rate |
| JW1E2561 | 1 | ECKD | SNAP | 6.2 | 256 GB | 1013470 | 51 | 257 | 3943 |
| JX1E2563 | 1 | ECKD | SNAP | 6.3 | 256 GB | 1014243 | 51 | 157 | 6460 |
| JW1E2562 | 1 | ECKD | PSW | 6.2 | 256 GB | 1013612 | 51 | 248 | 4087 |
| JX1E2564 | 1 | ECKD | PSW | 6.3 | 256 GB | 1015453 | 51 | 159 | 6386 |
| JWAE2561 | 2 | ECKD | SNAP | 6.2 | 256 GB | 565281 | 92 | 178 | 3176 |
| JXAE2563 | 2 | ECKD | SNAP | 6.3 | 256 GB | 566038 | 92 | 92 | 6153 |
| JWAE2562 | 2 | ECKD | PSW | 6.2 | 256 GB | 565617 | 92 | 178 | 3178 |
| JXAE2564 | 2 | ECKD | PSW | 6.3 | 256 GB | 566058 | 92 | 92 | 6153 |
| Notes: 2817-744. Four 8.0 Gbps Fibre-channel switched channels, 2107-E8 control unit, 14 3390-3 volumes. | |||||||||
Results from this environment demonstrate a 50% to 90% dump rate improvement over z/VM 6.2 for both SNAPDUMP and PSW RESTART dumps.
256 GB Storage With EDEV Devices
Table 3 contains the results for both z/VM 6.2 and z/VM 6.3 measurements using EDEV devices in 256 GB of storage.
|
Table 3. EDEV Dumps With 256 GB |
|||||||||
| LOAD | DASD | Dump | Dumped | % | Elps | ||||
| Run ID | Conf | Type | Type | Rel | Size | Frames | FT | Time | Rate |
| JW1S2561 | 1 | EDEV | SNAP | 6.2 | 256 GB | 1025710 | 51 | 903 | 1136 |
| JX1S2565 | 1 | EDEV | SNAP | 6.3 | 256 GB | 1026690 | 51 | 308 | 3333 |
| JW1S2562 | 1 | EDEV | PSW | 6.2 | 256 GB | 1030687 | 50 | 909 | 1134 |
| JX1S2566 | 1 | EDEV | PSW | 6.3 | 256 GB | 1026735 | 51 | 308 | 3334 |
| JWAS2561 | 2 | EDEV | SNAP | 6.2 | 256 GB | 577397 | 90 | 638 | 905 |
| JXAS2566 | 2 | EDEV | SNAP | 6.3 | 256 GB | 578493 | 90 | 38 | 15224 |
| JWAS2562 | 2 | EDEV | PSW | 6.2 | 256 GB | 577599 | 90 | 638 | 905 |
| JXAS2567 | 2 | EDEV | PSW | 6.3 | 256 GB | 578258 | 90 | 38 | 15217 |
| Notes: 2817-744. One 16.8 Gbps Fibre-channel-protocol channel, 6310-80 control unit, 100 9336 volumes. | |||||||||
Results from this environment demonstrate a 190% to 1500% dump rate improvement over z/VM 6.2 for both SNAPDUMP and PSW RESTART dumps. The dump rate to EDEV devices is highly dependent on the number of contiguous frames. The best improvements occurred for load configurations where the dumped frames were 90% CP frame table frames.
1 TB Storage With ECKD Devices
Table 4 contains the results for z/VM 6.3 measurements using ECKD devices in 1 TB of storage.
|
Table 4. ECKD Dumps With 1 TB |
|||||||||
| LOAD | DASD | Dump | Dumped | % | Elps | ||||
| Run ID | Conf | Type | Type | Rel | Size | Frames | FT | Time | Rate |
| JXAE1T4 | 3 | ECKD | SNAP | 6.3 | 1 TB | 4138337 | 50 | 639 | 6476 |
| JXAE1T5 | 3 | ECKD | PSW | 6.3 | 1 TB | 4138299 | 50 | 631 | 6558 |
| JX1E1T3 | 4 | ECKD | SNAP | 6.3 | 1 TB | 4154508 | 50 | 632 | 6574 |
| JX1E1T4 | 4 | ECKD | PSW | 6.3 | 1 TB | 4154470 | 50 | 632 | 6574 |
| Notes: 2817-744. Four 8.0 Gbps Fibre-channel switched channels, 2107-E8 control unit, 14 3390-3 volumes. | |||||||||
Results from this environment demonstrate dump rates within 10% of all dump rates seen in the 256 GB measurements.
1 TB Storage With EDEV Devices
Table 5 contains the results for z/VM 6.3 measurements using EDEV devices in 256 GB of storage.
|
Table 5. EDEV Dumps With 1 TB |
|||||||||
| LOAD | DASD | Dump | Dumped | % | Elps | ||||
| Run ID | Conf | Type | Type | Rel | Size | Frames | FT | Time | Rate |
| JXAS1T6 | 3 | EDEV | SNAP | 6.3 | 1 TB | 4150681 | 50 | 1308 | 3173 |
| JXAS1T7 | 3 | EDEV | PSW | 6.3 | 1 TB | 4150648 | 50 | 1305 | 3181 |
| Notes: 2817-744. One 16.8 Gbps Fibre-channel-protocol channel, 6310-80 control unit, 100 9336 volumes. | |||||||||
Results from this environment demonstrate dump rates equivalent to those seen in the 256 GB measurements.
Summary and Conclusions
For ECKD devices, dump rates improved 50% to 90% over z/VM 6.2.
For EDEV devices, dump rates improved 190% to 1500% over z/VM 6.2.
For ECKD devices at 1 TB, all dump rates were within 10% of all dump rates achieved at 256 GB.
For EDEV devices at 1 TB, dump rates were within 10% of all dump rates achieved at 256 GB for similar load configurations.
Back to Table of Contents.
CPU Pooling
Abstract
CPU pooling, added to z/VM 6.3 by PTF, implements the notion of group capping of CPU consumption. Groups of guests can now be capped collectively; in other words, the capped or limited quantity is the amount of CPU consumed by the group altogether. The group of guests is called a CPU pool. The pool's limit can be expressed in terms of either a percentage of the system's total CPU power or of an absolute amount of CPU power. z/VM lets an administrator define several pools of limited guests. For each pool, a cap is defined for exactly one CPU type. The cappable types are CPs or IFLs.
CPU pooling is available on z/VM 6.3 with APAR VM65418.
Introduction
This article discusses the capabilities provided by CPU pooling. It also provides an overview of the monitor records that have been updated to include CPU pooling information and explains how those records can be used to understand CPU pooling's effect on the system. Further, the article demonstrates the effectiveness of CPU pooling using examples of workloads that include guests that are members of CPU pools. Finally, the article shows that the z/VM Control Program overhead introduced with CPU pooling is very small.
Background
This section explains how CPU pooling can be used to control the amount of CPU time consumed by a group of guests. It also summarizes the z/VM monitor records that have been updated to monitor limiting with CPU pools. Finally, the section explains how to use the monitor records to understand CPU pooling's effect on guests that are members of a CPU pool.
CPU Pooling Overview
A CPU pool can be created by using the DEFINE CPUPOOL command. The command's operands specify the following:
- The name of the CPU pool.
-
The pool's consumption limit.
There are two types of consumption
limits that can be set for a given CPU
pool:
- LIMITHARD limits the CPU pool to a specific percentage of the CPU power available of the specified CPU type.
- CAPACITY limits the CPU pool to a specific amount of CPU power of the specified CPU type.
- The type of CPU, either IFL or CP.
Guests can be assigned to a CPU pool by using the SCHEDULE command. The command's operands specify the following:
- The name of the CPU pool.
- The guest being assigned to the pool. Note that a given guest virtual machine can be assigned to only one CPU pool at a time.
To make a guest's CPU pool assignment permanent, and to make the guest always belong to a specific pool, place the SCHEDULE command in the guest's CP directory entry.
A CPU pool exists only from the time the DEFINE CPUPOOL command is issued until the z/VM system shuts down or DELETE CPUPOOL is issued against it. Further, the CPU pool must be defined before any SCHEDULE commands are issued against it. If a permanent CPU pool is desired, add the DEFINE CPUPOOL command to AUTOLOG1's PROFILE EXEC or add the command to an exec AUTOLOG1 runs. This will ensure that the CPU pool is created early in the IPL process before guests to be assigned to the group are logged on.
For more information about the DEFINE CPUPOOL and SCHEDULE commands, refer to z/VM CP Commands and Utilities Reference.
For more information about using CPU pools, refer to z/VM Performance.
Monitor Changes for CPU Pooling
The CPU Pooling enhancement added or changed the following monitor records:
-
MRMTRCPC: Domain 1 (MONITOR) Record 28 - a new CONFIGURATION record.
The new CPU Pool Configuration monitor record comes out whenever Monitor is started.
It also is given to every new guest that connects to Monitor.
The record
gives the current information about each CPU pool that is already defined on the system.
-
MRMTRCPD: Domain 1 (MONITOR) Record 29 - a new EVENT record.
The new CPU Pool Definition monitor record comes out whenever a DEFINE CPUPOOL, SET CPUPOOL,
or DELETE CPUPOOL command is issued.
The record
gives the current information about the CPU pool that just changed.
-
MRPRCCPU: Domain 5 (PROCESSOR) Record 19 - a new SAMPLE record.
The new CPU Pool Utilization monitor record comes out for each CPU pool defined on the
system.
The record
gives information describing how the CPU pool is
performing, how much CPU time it is consuming, and how often/long it is being limited.
-
MRUSECPC: Domain 4 (USER) Record 13 - a new EVENT record.
The new CPU Pool Change monitor record comes out whenever a guest is added to a CPU pool, moved
from one CPU pool to another, or removed from a CPU pool. It is produced when a SCHEDULE command
changes a guest's CPU pool, or the guest leaves a CPU pool by logging off, or a VMRELOCATE command moves a
guest in a CPU pool from one system to another.
The record
gives the previous and current CPU pool information for the
specific guest whose CPU pool has been changed.
-
MRUSEACT: Domain 4 (USER) Record 3 - an existing SAMPLE record.
The mapping of the User Activity Data monitor record is updated to add one field, the CPU pool name, to the
record.
-
MRSCLALL: Domain 2 (SCHEDULER) Record 13 - an existing EVENT record.
The mapping of the Add VMDBK To The Limit List monitor record is updated to add two fields to the
record. One field is a code added to indicate the reason why the guest is being put onto the limit
list, either because of hitting an individual limit or because of hitting the pool limit.
The second field is the name of the CPU pool to which the guest is assigned.
-
MRSCLDLL: Domain 2 (SCHEDULER) Record 14 - an existing EVENT record.
The mapping of the Drop VMDBK From The Limit List monitor record is updated to add one field,
the CPU pool name, to the record.
- MRMTRUSR: Domain 1 (MONITOR) Record 15 - an existing CONFIGURATION record. The mapping of the Logged on User monitor record is updated to add one field, the CPU pool name, to the record.
Using Monitor Records to Calculate CPU Utilization with CPU Pooling
The CPU utilization of a CPU pool is calculated using data contained in Domain 5 Record 19 (D5R19) and Domain 1 Record 29 (D1R29).
The difference between PRCCPU_LIMMTTIM values in consecutive D5R19 records provides the total CPU time consumed by CPU pool members during the most recently completed limiting interval.
The difference between PRCCPU_LIMMTODE values in consecutive D5R19 records provides the elapsed time of the most recently completed limiting interval.
In calculating CPU utilization percents, the PRCCPU_LIMMTODE delta must be used for the denominator; do NOT use the MRHDRTOD delta.
If between two D5R19 records there is an intervening D1R29 record with the value of x'01' (DEFINE CPUPOOL) in MTRCPD_COMMAND, the MRHDRTOD value of the D1R29 record must be used in place of the PRCCPU_LIMMTODE value from the previous D5R19 record to calculate the elapsed time of the most recently completed limiting interval.
The total CPU time consumed in the most recently completed limiting interval divided by the elapsed time of the most recently completed limiting interval gives the CPU utilization for the most recently completed limiting interval.
Using Monitor Records to Understand CPU Utilization Variations with CPU Pooling
The following monitor records provide information which will help to explain variations in expected CPU utilization.
-
MRSYTPRP: Domain 0 (SYSTEM) Record 2 - Processor Data (Per Processor) - an existing SAMPLE record.
If CPU pooling is being limited by CAPACITY, the intervening D0R2
records can be used to determine the number of CPs and IFLs online.
If the number of online processors of the type being limited is less than the
CAPACITY setting, no limiting will take place.
-
MRMTRCPD: Domain 1 (MONITOR) Record 29 - a new EVENT record.
If there is an intervening D1R29 record with the value of x'02' (SET CPUPOOL)
in MTRCPD_COMMAND, the LIMITHARD or CAPACITY setting of a CPU pool might have
changed, and the CPU utilization might not be what was expected.
If there is an intervening D1R29 record with the value of x'03' (DELETE CPUPOOL)
in MTRCPD_COMMAND, the CPU utilization might not be what was expected.
-
MRUSECPC: Domain 4 (USER) Record 13 - a new EVENT record.
If there is an intervening D4R13 record with USECPC_COMMAND containing
the value of
x'01' (SCHEDULE or VMRELOCATE added user to CPU pool), or
x'02' (SCHEDULE moved user from one CPU pool to another), or
x'03' (SCHEDULE removed user from CPU pool), or
x'04' (VMRELOCATE or LOGOFF removed user from CPU pool),
the CPU utilization may not be what was expected.
-
MRPRCVON: Domain 5 (PROCESSOR) Record 1 - Vary on Processor - an existing EVENT record.
If CPU pooling is being limited by CAPACITY, and the type of processor being varied on
matches the type being limited, the effects of limiting might change.
If the number of online processors of the type being limited is still less than
or equal to the CAPACITY setting, no limiting will take place and CPU utilization
will be limited by the number of processors online.
If the number of online processors of the type being limited is greater than
the CAPACITY setting, limiting will begin to take place.
- MRPRCVOF: Domain 5 (PROCESSOR) Record 2 - Vary Off Processor - an existing EVENT record. If CPU pooling is being limited by CAPACITY, and the type of processor being varied off matches the type being limited, the effects of limiting might change. If the number of online processors of the type being limited is still greater than the CAPACITY setting, limiting will continue to take place. If the number of online processors of the type being limited is less than or equal to the CAPACITY setting, limiting will stop taking place, and CPU utilization will be limited by the number of processors online.
Method
Virtual Storage Exerciser and Apache were used to create specialized workloads to evaluate the effectiveness of CPU pooling. Base measurements with no CPU pools were conducted to quantify the amount of CP overhead introduced by CPU pooling.
Virtual Storage Exerciser (VIRSTOEX) workload variations included the following:
-
Multiple guests in multiple CPU pools with each CPU pool having
the same LIMITHARD setting. The guests in each CPU pool had a
variety of individual share settings including some with ABSolute
SHARE LIMITHARD settings.
The CPU pool limit settings were designed to limit the total CPU consumption
by the guests in the pool to less than the total CPU consumption they
would have achieved without CPU Pooling.
In measurements where some guests also had individual limits, the
individual limits were designed to further limit their CPU consumption
to less than they would have achieved with just CPU Pooling limits.
-
Multiple guests in multiple CPU pools with each CPU pool having
different LIMITHARD settings. The guests in each CPU pool
had a
variety of individual share settings including some with ABSolute
SHARE LIMITHARD settings.
The CPU pool limit settings were designed to limit the total CPU consumption
by the guests in the pool to less than the total CPU consumption they
would have achieved without CPU Pooling.
In measurements where some guests also had individual limits, the
individual limits were designed to further limit their CPU consumption
to less than they would have achieved with just CPU pooling limits.
-
Multiple guests in multiple CPU pools with each CPU pool having
the same CAPACITY settings. The guests in each CPU pool had a
variety of individual share settings including some with ABSolute
SHARE LIMITHARD settings.
The CPU pool limit settings were designed to limit the total CPU consumption
by the guests in the pool to less than the total CPU consumption they
would have achieved without CPU Pooling.
In measurements where some guests also had individual limits, the
individual limits were designed to further limit their CPU consumption
to less than they would have achieved with just CPU pooling limits.
- Multiple guests in multiple CPU pools with each CPU pool having different CAPACITY settings. The guests in each CPU pool had a variety of individual share settings including some with ABSolute SHARE LIMITHARD settings. The CPU pool limit settings were designed to limit the total CPU consumption by the guests in the pool to less than the total CPU consumption they would have achieved without CPU pooling. In measurements where some guests also had individual limits, the individual limits were designed to further limit their CPU consumption to less than they would have achieved with just CPU pooling limits.
Apache workloads included the following variations. Note that none of the Apache workload variations included CPU pool guests that had individual limits. For these measurements, limiting was done with CPU pool limits only.
-
Multiple guests in multiple CPU pools with each CPU pool having
the same LIMITHARD specification.
The CPU pool limit settings were designed to limit the total CPU consumption
by the guests in the pool to less than the total CPU consumption they
would have achieved without CPU pooling.
-
Multiple guests in multiple CPU pools with each CPU pool having
the same CAPACITY specification.
The CPU pool limit settings were designed to limit the total CPU consumption
by the guests in the pool to less than the total CPU consumption they
would have achieved without CPU pooling.
- Multiple guests in multiple CPU pools with some having LIMITHARD specifications and some having CAPACITY specifications. The CPU pool limit settings were designed to limit the total CPU consumption by the guests in the pool to less than the total CPU consumption they would have achieved without CPU pooling.
Results and Discussion
Table 1 contains measurement results obtained with VIRSTOEX. VIRSTOEX workloads use CMS guest virtual machines. The table contains:
- Limit type for each of the 4 CPU pools
- Limit type for each individual guest in VIRSTOR group 3
- Maximum share setting for each individual guest in VIRSTOR group 3
- Maximum share setting for each of the 4 CPU pools
- ETR and ITR ratios for the entire workload
- Processor utilization
- Minimum, maximum, and average utilization of each CPU pool from the monitor intervals of the measurement
- Average processor utilization for each of the 4 VIRSTOR groups
These measurement results illustrate the following points:
-
The cost of using CPU pooling is very small.
The z/VM Control Program overhead incurred is indicated by the Internal Throughput Rate (ITR). ITR in Table 1 shows a comparison of ITR ratios to the base measurement that did not use CPU pools. The reduced ITR ratio is very small in the cases of the measurements conducted with CPU pools. In fact, it is so small that it could be attributed to measurement run variation.
-
CPU pools effectively limit their guest groups when limited with
either LIMITHARD or CAPACITY limiting.
The measurement results shown in Table 1 for the LIMITHARD-limited CPU pool case and the CAPACITY-limited CPU pool case show that CPU pool limiting is very effective.
-
CPU pools limit appropriately when CPU pool guests
have individual share limits.
The measurement results in Table 1 show that CPU pool guests with individual share limits were limited by the individual share limits because the individual share limits were lower than the CPU pool limits. In general, guests with individual share limits that are also members of a CPU pool are limited by the lower limit. In other words, if the CPU pool limit would limit a guest to less CPU than its individual share limit, the CPU pool limit is the controlling factor. On the other hand, if the guest's individual share limit is lower than the CPU pool limit, the guest is limited by its individual share limit.
-
CPU pooling can diminish the distribution of CPU time
based on relative share settings.
In the first measurement, without CPU Pooling, the four groups of guests consumed CPU time in proportion to their relative share settings. In the second and third measurements, the total CPU time consumed by VIRSTOR2, VIRSTOR3, and VIRSTOR4 groups was significantly diminished. In the fifth measurement, with VIRSTOR3 guests limited with individual limits and CPU pooling in effect, the other three groups of guests had nearly identical total CPU consumption.
| Table 1. CPU Pooling - VIRSTOEX Measurement Comparisons | |||||
| Run ID | STXH4080 | STXH4081 | STXH4082 | STXH4083 | STXH4084 |
| CPUPOOL1 Limit Type | na | LIMITHARD | CAPACITY | na | CAPACITY |
| CPUPOOL2 Limit Type | na | LIMITHARD | CAPACITY | na | CAPACITY |
| CPUPOOL3 Limit Type | na | LIMITHARD | CAPACITY | na | CAPACITY |
| CPUPOOL4 Limit Type | na | LIMITHARD | CAPACITY | na | CAPACITY |
| VIRSTOR3 Limit Type | ... | ... | ... | Hard | Hard |
| VIRSTOR3 Max Abs Shr | ... | ... | ... | 3 | 3 |
| CPUPOOL1 Max Share | na | 16.00 | 150.0 | na | 100.0 |
| CPUPOOL2 Max Share | na | 16.00 | 150.0 | na | 100.0 |
| CPUPOOL3 Max Share | na | 16.00 | 150.0 | na | 100.0 |
| CPUPOOL4 Max Share | na | 16.00 | 150.0 | na | 100.0 |
| ETR Ratio | 1.000 | 0.628 | 0.742 | 1.017 | 0.555 |
| ITR Ratio | 1.000 | 0.978 | 0.985 | 1.014 | 1.104 |
| Total Util/Proc | 96.4 | 64.6 | 73.1 | 96.3 | 49.1 |
| Emul Util/Proc | 92.3 | 60.3 | 68.4 | 92.3 | 45.2 |
| CP Util/Proc | 4.1 | 4.3 | 4.7 | 4.0 | 3.9 |
| System Util/Proc | 0.5 | 0.6 | 0.6 | 0.5 | 0.8 |
| CPUPOOL1 Min %Util | na | 128.0 | 150.0 | na | 100.0 |
| CPUPOOL2 Min %Util | na | 128.0 | 150.0 | na | 100.0 |
| CPUPOOL3 Min %Util | na | 128.0 | 150.0 | na | 100.0 |
| CPUPOOL4 Min %Util | na | 128.0 | 150.0 | na | 100.0 |
| CPUPOOL1 Mean %Util | na | 128.0 | 150.0 | na | 100.0 |
| CPUPOOL2 Mean %Util | na | 128.0 | 150.0 | na | 100.0 |
| CPUPOOL3 Mean %Util | na | 128.0 | 150.0 | na | 100.0 |
| CPUPOOL4 Mean %Util | na | 128.0 | 150.0 | na | 100.0 |
| CPUPOOL1 Max %Util | na | 128.0 | 150.0 | na | 100.0 |
| CPUPOOL2 Max %Util | na | 128.0 | 150.0 | na | 100.0 |
| CPUPOOL3 Max %Util | na | 128.0 | 150.0 | na | 100.0 |
| CPUPOOL4 Max %Util | na | 128.0 | 150.0 | na | 100.0 |
| VIRSTOR1 Util | 19.950 | 21.737 | 21.383 | 25.333 | 25.367 |
| VIRSTOR2 Util | 39.750 | 29.772 | 32.533 | 51.767 | 25.317 |
| VIRSTOR3 Util | 57.600 | 35.789 | 41.800 | 22.867 | 20.433 |
| VIRSTOR4 Util | 74.417 | 40.719 | 49.050 | 91.533 | 25.350 |
| Notes: 2827-795, 8 dedicated CPs, 1 TB of storage. Four 8.0 Gbps Fibre-channel switched channels, 2107-E8 control unit, 34 3390-3 volumes. 4 VIRSTOR1 guests (20 GB, SHARE 100), 4 VIRSTOR2 guests (20 GB, SHARE 200), 4 VIRSTOR3 guests (20 GB, SHARE 300), 4 VIRSTOR4 guests (20 GB, SHARE 400). VIRSTOR parms (C=3 I=4 T=600). z/VM 6.3 of April 8, 2014. | |||||
Table 2 contains measurement results obtained with Apache web serving. Apache measurements were done with Linux guest virtual machines. The Linux client machines make requests to the Linux server machines. The Linux server machines serve web pages that satisfy the client requests. The table contains:
- Limit type for each of the 4 CPU pools
- Maximum share setting for each of the 4 CPU pools
- Minimum, maximum, and average utilization of each CPU pool from the monitor intervals of the measurement
- Processor utilization
- Percentage of high frequency wait samples that found APACHE servers on the Limit list
- ETR and ITR ratios for the entire workload
- Processor time per transaction for the AWM clients and for the Apache servers
- T/V ratio
These measurement results illustrate the following points:
-
The cost of using CPU pooling is very small.
With the Apache web serving workload, ITR ratio is not the appropriate metric to illustrate this point. In fact, observe in the table that ITR ratio actually increases in the measurements that include CPU pools. The characteristics of the Apache web serving workload result in an increase in ITR ratio most likely because the Linux guest time (emulation time) is reduced when the servers are limited because of their pool memberships. Instead, looking at CP usec/tx and the T/V ratio shows us that the overhead of using CPU pooling is very small.
-
CPU pools effectively limit their guest groups when limited with
either LIMITHARD or CAPACITY limiting.
The measurement results shown in Table 2 for the LIMITHARD-limited CPU pool case, the CAPACITY-limited CPU pool case, and the case that includes both CAPACITY and LIMITHARD CPU pools show that CPU pool limiting is very effective.
| Table 2. CPU Pooling - Apache Measurement Comparisons | ||||
| Run ID | A8XT4083 | A8XT4080 | A8XT4081 | A8XT4082 |
| CPUPOOL1 Limit Type | na | LIMITHARD | CAPACITY | LIMITHARD |
| CPUPOOL2 Limit Type | na | LIMITHARD | CAPACITY | LIMITHARD |
| CPUPOOL3 Limit Type | na | LIMITHARD | CAPACITY | CAPACITY |
| CPUPOOL4 Limit Type | na | LIMITHARD | CAPACITY | CAPACITY |
| CPUPOOL1 Max Share | na | 4.999 | 40.00 | 4.999 |
| CPUPOOL2 Max Share | na | 4.999 | 40.00 | 4.999 |
| CPUPOOL3 Max Share | na | 4.999 | 40.00 | 40.00 |
| CPUPOOL4 Max Share | na | 4.999 | 40.00 | 40.00 |
| CPUPOOL1 Max %Util | na | 39.99 | 40.00 | 39.99 |
| CPUPOOL2 Max %Util | na | 39.99 | 40.00 | 39.99 |
| CPUPOOL3 Max %Util | na | 39.99 | 40.00 | 40.00 |
| CPUPOOL4 Max %Util | na | 39.99 | 40.00 | 40.00 |
| CPUPOOL1 Mean %Util | na | 38.98 | 39.05 | 39.04 |
| CPUPOOL2 Mean %Util | na | 38.96 | 39.06 | 39.02 |
| CPUPOOL3 Mean %Util | na | 38.96 | 39.05 | 39.04 |
| CPUPOOL4 Mean %Util | na | 38.97 | 39.07 | 39.04 |
| CPUPOOL1 Min %Util | na | 9.493 | 11.53 | 11.41 |
| CPUPOOL2 Min %Util | na | 9.033 | 11.63 | 10.80 |
| CPUPOOL3 Min %Util | na | 8.982 | 11.53 | 11.15 |
| CPUPOOL4 Min %Util | na | 9.287 | 12.07 | 11.09 |
| Total Util/Proc | 1.000 | 0.679 | 0.683 | 0.684 |
| APACHE LIMIT Wait | 0 | 25 | 25 | 24 |
| ETR Ratio | 1.000 | 0.735 | 0.740 | 0.739 |
| ITR Ratio | 1.000 | 1.087 | 1.090 | 1.086 |
| CP usec/Tx | 1.000 | 1.076 | 1.067 | 1.067 |
| Emul usec/Tx | 1.000 | 0.891 | 0.889 | 0.893 |
| AWM Emul CPU/Tx | 1.000 | 0.899 | 0.899 | 0.899 |
| APACHE Emul CPU/Tx | 1.000 | 0.800 | 0.800 | 0.800 |
| APACHE CP CPU/Tx | 1.000 | 1.000 | 1.000 | 1.000 |
| AWM CP CPU/Tx | 1.000 | 0.875 | 1.000 | 1.000 |
| T/V Ratio | 1.000 | 1.034 | 1.034 | 1.034 |
| Notes: 2827-795, 8 dedicated CPs, 128 GB of storage. Four 8.0 Gbps Fibre-channel switched channels, 2107-E8 control unit, 224 3390-54 volumes. z/VM 6.3 of April 8, 2014. 6 AWM clients, 16 Apache servers, 2 URL files, 15 KB avg URL size. | ||||
Summary and Conclusions
- CPU pools provide effective CPU time limiting, regardless of the type of guest.
- CPU pools limit effectively for both types of limits - LIMITHARD or CAPACITY.
- CPU pools limit appropriately when a pool contains guests that have individual limits as well. Guest individual limits take effect only if they limit the guest more than the CPU pool limit would.
- CPU pooling can diminish the distribution of CPU consumption based on relative share settings.
- CPU pooling has very little additional resource consumption.
Back to Table of Contents.
z/VM Version 6 Release 2
The following sections discuss the performance characteristics of z/VM 6.2 and the results of the z/VM 6.2 performance evaluation.
Back to Table of Contents.
Summary of Key Findings
This section summarizes key z/VM 6.2 performance items and contains links that take the reader to more detailed information about each one.
Further, our performance improvements article gives information about other performance enhancements in z/VM 6.2.
For descriptions of other performance-related changes, see the z/VM 6.2 performance considerations and performance management sections.
To compare performance of z/VM 6.2 to previous releases, IBM ran a variety of workloads on the two systems. For the base case, IBM used z/VM 6.1 plus all Control Program (CP) PTFs available as of September 8, 2011. For the comparison case, IBM used z/VM 6.2 at the "code freeze" level of October 3, 2011.
Regression measurements comparing these two z/VM levels showed nearly identical results for most workloads. Variation was generally less than 5%.
Because of several improvements brought either by z/VM 6.2 or by recent PTFs rolled into z/VM 6.2, some customers might see performance improvements. Customers whose partitions have too many logical PUs for the work might see benefit, likely because of improvements in the z/VM spin lock manager. Storage-constrained systems with high pressure on storage below 2 GB might see benefit from z/VM's improved strategies for using below-2-GB storage only when it's really needed. Workloads with high ratios of busy virtual PUs to logical PUs might see smoother, less erratic operation because of repairs made in the z/VM scheduler. For more discussion of these, see our improvements article.
Key Performance Improvements
z/VM 6.2 contains the following enhancements that offer performance improvements compared to previous z/VM releases:
Memory Scaling Improvements: z/VM 6.2 contains several improvements to its memory management algorithms. First, z/VM now avoids using below-2-GB memory for pageable purposes when doing so would expose the system to long linear searches. Further, z/VM now does a better job of coalescing adjacent free memory; this makes it easier to find contiguous free frames when they're needed, such as for segment tables. Also, z/VM now uses better serialization techniques when releasing pages of an address space; this helps improve parallelism and reduce memory management delays imposed on guests. Last, z/VM now offers the system administrator a means to turn off the guest memory frame reorder process, thereby letting the administrator decrease system overhead or reduce guests stalls if these phenomena have become problematic.
ISFC Improvements: Preparing ISFC to be the transport mechanism for live guest relocation meant greatly increasing its data carrying capacity. While the improvements were meant for supporting relocations, the changes also help APPC/VM traffic.
Since the time of z/VM 5.4, IBM has also shipped several good z/VM performance improvements as PTFs. For more information on those, refer to our improvements discussion.
Other Functional Enhancements
z/VM 6.2 offers the ability to relocate a running guest from one z/VM system to another. This function, called live guest relocation or LGR, makes it possible to do load balancing among a set of z/VM partitions bound together into a Single System Image or SSI. LGR also makes it possible to take down a z/VM system without workload disruption by first evacuating critical workload to a nearby z/VM partition.
IBM measured the SSI and LGR functions in two different ways. First, IBM ran a number of experiments to explore the notion of splitting a workload among the members of an SSI. In our resource distribution article we discuss the findings of those experiments. Second, IBM ran many measurements to evaluate the performance characteristics of relocating guests among systems. These measurements paid special attention to factors such as the level of memory constraint on source and target systems and the capacity of the ISFC link connecting the two systems. In our guest relocation article we discuss the performance characteristics of LGR.
Though it first appeared as a PTF for z/VM 5.4 and z/VM 6.1, the new CPU Measurement Facility host counters support deserves mention as a key z/VM improvement. z/VM performance analysts are generally familiar with the idea that counters and accumulators can be used to record the performance experience of a running computer. The CPU Measurement Facility host counters bring that counting and accruing scheme to bear on the notion of watching the internal performance experience of the CPU hardware itself. Rather than counting software-initiated activities such as I/Os, memory allocations, and page faults, the CPU MF counters, a System z hardware facility, accrue knowledge about phenomena internal to the CPU, such as instructions run, clock cycles used to run them, and memory cache misses incurred in the fetching of opcodes and operands. The new z/VM support periodically harvests the CPU MF counters from the CPU hardware and logs out the counter values in a new Monitor sample record. Though Performance Toolkit offers no reduction of the counter values, customers can send their MONWRITE files to IBM for analysis of the counter records. IBM can in turn use the aggregated customer data to understand machine performance at a very low level and to guide customers as they consider machine changes or upgrades. For more information about this new support, refer to our performance considerations article.
Back to Table of Contents.
Changes That Affect Performance
This chapter contains descriptions of various changes in z/VM 6.2 that affect performance. It is divided into three sections -- Performance Improvements, Performance Considerations, and Performance Management.
Back to Table of Contents.
Performance Improvements
In Summary of Key Findings this report gives capsule summaries of the performance notables in z/VM 6.2. The reader can refer to the key findings chapter or to the individual enhancements' chapters for more information on these major items.
z/VM 6.2's Single System Image function contains changes to the management of Minidisk Cache (MDC) for minidisks shared across systems. Prior to z/VM 6.2, the system administrator had to ensure that when a real volume was shared, MDC was set off for the whole real volume. This helped assure data integrity and up-to-date visibility of changes, but it shut off the performance advantages of running with MDC. In z/VM 6.2, the members of the SSI cooperate to turn on and off MDC according to whether the members' links taken together would permit MDC to be on or rather would require it to be off. For example, if all members' minidisk links are all read-links, MDC can be enabled on all members without danger. But if one member write-links a minidisk on the shared volume, the other members must turn off MDC for that minidisk for the duration of the one member's write-link. The members of the SSI negotiate these MDC transitions automatically. Customers using MDC will welcome this improvement.
z/VM 6.2 also contains a significant number of changes or improvements that were first shipped as service to z/VM 5.4 or z/VM 6.1. Because IBM refreshes this report only at z/VM release boundaries, we've not yet had a chance to describe the many improvements shipped in these PTFs.
Spin Lock Remediation: In VM64927 IBM significantly reworked the Control Program's spin lock manager. Instead of blindly using Diag x'44' to yield its PR/SM time slice when a spin was protracting, CP now determines which other logical PU holds the sought spin lock, uses SIGP Sense-Running-Status to determine whether said logical PU is already executing, and then issues Diag x'9C' to yield to that specific other logical PU if said logical PU is not running. These changes decrease z/VM's tendency to induce PR/SM overhead and can result in significantly decreased CPU utilization in extreme cases.
SHARE ABSOLUTE LIMITHARD: In VM64721 IBM repaired the z/VM scheduler so that hard-limiting an absolute share user's CPU consumption works correctly. Customers using absolute CPU shares with hard-limiting will want to apply this fix.
VSWITCH Failover Behavior: In VM64850 IBM repaired performance problems incurred on VSWITCHes when failover happens. During failover processing CP failed to provide the VSWITCH with sufficient QDIO buffers. This in turn limited data rate, increased CPU utilization, and opened the possibility for packet loss. The PTF repairs the problem.
Erratic System Performance: In VM64887 IBM repaired performance problems encountered on systems having a very high ratio of virtual CPUs to logical CPUs where the majority of the virtual CPUs were runnable a large fraction of the time. A condition called PLDV overflow was occasionally not being sensed and so runnable virtual CPUs were occasionally not being run when they should have been run. Customers running with high ratios of runnable virtual CPUs to logical CPUs should notice smoother operation.
VARY ON / VARY OFF Processor: In VM64767 and VM64876 IBM repaired CP VARY PROCESSOR command problems which could occasionally cause system hangs or abends.
MCW002 During QDIO Block Processing: In VM64527 IBM repaired problems with the management of memory used to hold FCP Operation Blocks, commonly known as FOB blocks. Freed (released) FOB blocks could pile up on per-logical-PU free-storage queues and never be released to the system-wide free queues. This imbalance could eventually cause a system abend.
Master-only Work on SYSTEMMP: In VM64756 IBM repaired a situation which could cause non-master logical processors no longer to service work stacked on the SYSTEMMP VMDBK. The work-stacking logic for SYSTEMMP work was changed so that non-master logical PUs would not quit checking for SYSTEMMP work once a piece of master-only work got stacked onto SYSTEMMP. In extreme cases the defect could have caused abends.
Short-Term Memory Leak: In VM64633 IBM repaired a memory leak encountered when BACKING=ANY free storage was needed but no storage above 2 GB was available. In this situation CP would unconditionally extend the backed-below-2-GB chain instead of checking whether there was free storage already available on that chain. In other words, this was basically a leak of memory below 2 GB.
Performance of CMS FORMAT: In VM64602 and VM64603 IBM shipped performance improvements for CMS FORMAT. Together these changes allow CMS to format a whole track with a single I/O.
Erasing Large SFS Files: In VM64513 IBM improved the performance of erasing large SFS files. A control block list search was eliminated, thus decreasing CPU utilization and elapsed time for the erasure.
Several Memory Management Improvements: In VM64774 IBM introduced the SET REORDER command. In VM64795 and VM65032 IBM improved the coalesce function for adjacent free memory. In VM64715 IBM improved the serialization technique used during Diag x'10' page-release processing. Our storage management article describes the aggregate effect of these improvements.
IBM continually improves z/VM in response to customer-reported and IBM-reported defects or suggestions. In z/VM 6.2, the following small improvements or repairs are notable:
- CP frame table scans now exclude entries marked permanently nonpageable.
Back to Table of Contents.
Performance Considerations
As customers begin to deploy z/VM 6.2, they might wish to give consideration to the following items.
On Load Balancing and Capacity Planning
z/VM Single System Image offers the customer an opportunity to deploy work across multiple partitions as if the partitions were one single z/VM image. Guests can be logged onto the partitions where they fit and can be moved among partitions when needed. Movement of guests from one member to another is accomplished with the VMRELOCATE command.
Easy guest movement implies easy load balancing. If a guest experiences a growth spurt, we might accommodate the spurt by moving the guest to a more lightly loaded member. Prior to z/VM 6.2, this kind of rebalancing was more difficult.
To assure live guest relocation will succeed when the time comes, it will be necessary to provide capacity on the respective members in such a manner that they can back each other up. For example, running each of the four members at 90% CPU-busy and then expecting to be able to distribute a down member's entire workload into the other three members' available CPU power just will not work. In other words, where before we tracked a system's unused capacity mainly to project its own upgrade schedule, we must now track and plan members' unused capacity in terms of its ability to help absorb work from a down member. Keep in mind that members' unused capacity is comprised of more than just unused CPU cycles. Memory and paging space also need enough spare room to handle migrated work.
As you do capacity planning in an SSI, consider tracking the members' utilization and growth in "essential" and "nonessential" buckets. By "essential" we mean the member workload that must be migrated to other members when the present member must be taken down, such as for service. The unused capacity on the other members must be large enough to contain the down member's essential work. The down member's nonessential work can just wait until the down member resumes operating.
When one partition of a cluster is down for service, the underlying physical assets it ordinarily consumes aren't necessarily unavailable. When two partitions of an SSI reside on the same CEC, the physical CPU power ordinarily used by one member can be diverted to the other when the former is down. Consider for example the case of two 24-way partitions, each normally running with 12 logical PUs varied off. When we take one partition down for service, we can first move vital guests to the other partition and simultaneously vary on logical PUs there to handle the load. In this way we keep the workload running uninterrupted and at constant capacity, even though part of our configuration took a planned outage.
Sometimes achieving work movement doesn't necessarily mean moving a running guest from one system to another. High-availability clustering solutions for Linux, such as SuSE Linux Enterprise High Availability Extensions for System z, make it possible for one guest to soak up its partner's work when the partner fails. The surviving guest can handle the total load, though, only if the partition on which the guest is running has the spare capacity, and further, only if the surviving guest is configured to tap into it. If you are using HA solutions to move work, think about the importance of proper virtual configuration in achieving your goals when something's not quite right.
On Guest Mobility
The notion that a guest can begin its life on one system and then move to another without a LOGOFF/LOGON sequence can be a real game-changer for certain habits and procedures. IBM encourages customers to think through items and situations like those listed below, to assess for impact and to make corrections or changes where needed.
Charge-back: Can your procedures for charge-back and resource billing account for the notion that a guest suddenly disappeared from one system and reappeared somewhere else?
Second-level schedulers: Some customers have procedures that attempt to schedule groups of virtual machines together, such as by adjusting share settings of guests whose names appear in a list. What happens to your procedures if the guests in that group move separately among the members in an SSI?
VM Resource Manager: VMRM is not generally equipped to handle the notion that guests can move among systems. IBM recommends that moveable guests not be included in VMRM-managed groups.
On MONWRITE and Performance Toolkit
There continues to be a CP Monitor data stream for each of the individual members of an SSI. To collect a complete view of the operation of the SSI, it will therefore be necessary for you to run MONWRITE on all of the members of the SSI. Remember to practice good archiving and organizing habits for the MONWRITE files you produce. During a performance tuning exercise you will probably want to look at all of the MONWRITE files for a given time period. If you contact IBM for help with a problem, IBM might ask for MONWRITE files from all systems for the same time period.
Performance Toolkit for VM continues to run separately on each member of the cluster. There will be a PERFSVM virtual machine on each member, achieved through the multiconfiguration virtual machine support in the CP directory.
Now more than ever you might wish to configure Performance Toolkit for VM so that you can use its remote performance monitoring facility. In this setup, one PERFSVM acts as the concentrator for performance data collected by PERFSVM instances running on other z/VM systems. The contributors forward their data through APPC/VM or other means. Through one browser session or one CMS session with that one "master" PERFSVM, you as the performance analyst can inspect data pertaining to all of the contributing systems.
Performance Toolkit for VM does not produce "cluster-view" reports for resources shared among the members of an SSI. For example, when a real DASD is shared among the members, no one member's MONWRITE data records the device's total-busy view. Each system's data might portray the volume as lightly used when in aggregate the volume is heavily busy. Manual inspection of the individual systems' respective reports is one way to detect such phenomena. For the specific case of DASD busy, the controller-sourced FCX176 and FCX177 reports might offer some insight.
On Getting Help from IBM
If you open a problem with IBM, IBM might need you to send concurrently taken dumps. Be prepared for this. Practice with SNAPDUMP and with PSW restart dumps. Know the effect of a SNAPDUMP on your workload. Be prepared for the idea that you might have to issue the SNAPDUMP command simultaneously on multiple systems. Practice compressing dumps and preparing them for transmission to IBM.
On the CPU Measurement Facility Host Counters
Starting with VM64961 for z/VM 5.4 and z/VM 6.1, z/VM can now collect and log out the System z CPU Measurement Facility host counters. These counters record the performance experience of the System z CEC on such metrics as instructions run, clock cycles used, and cache misses experienced. Analyzing the counters provides a view of the performance of the System z CPU and of the success of the memory cache in keeping the CPU from having to wait for memory fetches. The counters record other CPU-specific phenomena also.
To use the new z/VM CPU MF support, do the following:
- Run on System z hardware that includes the
CPU Measurement Facility. A z10 at driver 76D bundle 20 or
later, or any z196, or any z114 is all that is needed.
- Run z/VM 5.4 or z/VM 6.1 with VM64961 applied,
or run z/VM 6.2.
- Authorize the z/VM partition to collect its
partition's counters. This is done at the System z
SE or HMC. The IBM red paper
Setting Up and Using the IBM System z CPU Measurement Facility with
z/OS
describes this step. See section 2.2.2 therein for details.
The steps to authorize a partition at the SE or HMC
are the same regardless of whether the partition runs z/VM or
z/OS.
-
Configure CP Monitor to emit sample records in
the PROCESSOR domain. Most customers running Monitor already
configure CP Monitor in this way.
To check whether Monitor is already doing this, just issue
CP QUERY MONITOR
and look at the output to see whether
processor samples are enabled.
If they are not, place a
CP MONITOR SAMPLE ENABLE PROCESSOR command at the
spot in your startup automation that turns on Monitor.
This might be MONWRITE's PROFILE EXEC or PERFSVM's
PROFILE EXEC, for example.
-
Start recording MONWRITE data as you normally would.
- To check that everything's working, issue CP QUERY MONITOR. Look for processor samples to be enabled with the CPUMFC annotation appearing in the output. If you see NOCPUMFC, something's gone wrong. Check everything over, and if you can't figure it out, contact IBM for help.
Once these steps are accomplished, the new CPU MF sample records, D5 R13 MRPRCMFC, will appear in the Monitor data stream. MONWRITE will journal the new records to disk along with the rest of the Monitor records. Performance Toolkit for VM will not analyze the new records, but it won't be harmed by them either.
While it is not absolutely essential, it is very helpful for MONWRITE data containing D5 R13 MRPRCMFC records also to contain D5 R14 MRPRCTOP system topology event records. Each time PR/SM changes the placement of the z/VM partition's logical CPUs onto the CPC's CPU chips and nodes, z/VM detects the change and cuts a D5 R14 record reporting the new placement. For the D5 R14 records to appear in the monitor data stream, the system programmer must run CP Monitor with processor events enabled. Note also that the D1 R26 MRMTRTOP system topology config record is sent to each *MONITOR listener when the listener begins listening. APAR VM64947 implements the D5 R14 records on z/VM 5.4 or z/VM 6.1.
IBM wants z/VM customers to contribute MONWRITE data containing CPU MF counters. These contributed MONWRITE files will help IBM to understand the stressors z/VM workloads tend to place on System z processors. For more information about how to contribute, use the "Contact z/VM" link on this web page.
On z/CMS
Prior to z/VM 6.2, IBM offered a z/Architecture-mode CMS, called z/CMS, as an unsupported sample. In z/VM 6.2, z/CMS is now supported. Some customers might consider z/CMS as an alternative to the standard ESA/XC-mode CMS, which is also still supported.
z/CMS can run in a z/Architecture guest. This is useful mostly so that you can use z/Architecture instructions in a CMS application you or your vendor writes. A second point to note, though, is that a z/Architecture guest can be larger than 2 GB. z/CMS CMSSTOR provides basic storage management for the storage above the 2 GB bar, but other CMS APIs cannot handle buffers located there.
If you use z/CMS, remember that z/Architecture is not ESA/XC architecture. A z/CMS guest cannot use ESA/XC architecture features, such as VM Data Spaces. This means it cannot use SFS DIRCONTROL-in-Data-Space, even though the SFS server is still running in ESA/XC mode. Similarly, one would not want to run DB/2 for VM under z/CMS if one depended on DB/2's MAPMDISK support.
If you are using an RSK-exploitive application under z/CMS, remember that the RSK's data-space-exploitive features will be unavailable.
Back to Table of Contents.
Performance Management
These changes affect the performance management of z/VM:
- MONDCSS and SAMPLE CONFIG Changes
- MONWRITE Changes
- Monitor Changes
- Command and Output Changes
- Effects on Accounting Data
- Performance Toolkit for VM Changes
- Omegamon XE Changes
MONDCSS and SAMPLE CONFIG Changes
The size of the default monitor MONDCSS segment shipped with z/VM has been increased from 16 MB (4096 pages) to 64 MB (16384 pages). In addition, the default size of the MONITOR SAMPLE CONFIG area has been increased from 241 pages to 4096 pages. The changes to these defaults were implemented because the old defaults are often too small for most systems today. Modern systems are running with an increasing number of devices and virtual machines, and the SAMPLE CONFIG area as previously defined can not contain all the data. Also, over the last several releases both the size of the monitor records and the number of monitor records being generated have grown, thus the need for a larger MONDCSS segment. Even though the segment is larger, the entire 64 MB of storage is not completely used. Empty pages in the segment are not instantiated and the pages used for configuration evaporate after a short time.
If you use your own MONDCSS segment, the new default SAMPLE CONFIG size may be too large. If this is the case you will receive the following error message when you try to connect using the *MONITOR system service and the MONWRITE utility.
HCPMOW6270E MONWRITE severed the IUCV connection, reason code 2C
HCPMOW6267I MONITOR writer connection to *MONITOR ended
If you receive this message you will have to increase the size of your MONDCSS segment or manually set the size of your SAMPLE CONFIG area using the MONITOR command.
MONWRITE Changes
The size of the MONWRITE 191 disk has been increased to 300 cylinders to handle the size of the monitor data modern systems tend to record.
The MONWRITE module is now generated as relocatable.
MONVIEW Changes
The MONVIEW sample program now finds monitor records that do not set their control record domain flags.
The MONVIEW sample program now processes domains higher than 10.
Monitor Changes
Several z/VM 6.2 enhancements affect CP monitor data. There are two new monitor domains, Domain 9 - ISFC and Domain 11 - Single-System Image, nineteen new monitor records, several changed records, and two records which are no longer generated. The detailed monitor record layouts are found on our control blocks page.
In z/VM 6.2, Cryptographic Coprocessor Facility (CCF) Support has been removed. The System z processors supported by z/VM provide the following cryptographic hardware features: CP Assist for Cryptographic Function (CPACF), Crypto Express2 feature, and Crypto Express3 feature. Because the old Cryptographic Coprocessor Facility (CCF) and its predecessors are no longer available on these processors, CP support for old cryptographic hardware has been removed. Due to the removal of this support the following monitor records are no longer generated.
| Monitor Record | Record Name |
|---|---|
| Domain 5 Record 6 | Add Access to CRYPTO Facility |
| Domain 5 Record 7 | Remove Access to CRYPTO Facility |
Enhancements have been made to the ISFC subsystem. These enhancements improve the transport mechanism and provide convenient interfaces for exploitation by other subsystems within the CP nucleus. To show activity related to ISFC links and ISFC transport end points the new ISFC Domain (Domain 9) has been added along with the following new monitor records:
| Monitor Record | Record Name |
|---|---|
| Domain 1 Record 23 | ISFC End Point Configuration |
| Domain 1 Record 24 | ISFC Logical Link Configuration |
| Domain 9 Record 1 | ISFC End Point Status Change |
| Domain 9 Record 2 | ISFC End Point Activity |
| Domain 9 Record 3 | ISFC Logical Link Definition Change |
| Domain 9 Record 4 | ISFC Logical Link Activity |
Real device mapping is now provided as a means of identifying a device either by a customer-generated equivalency ID (EQID) or by a CP-generated EQID. This mapping is used to ensure virtual machines relocated via the new Live Guest Relocation (LGR) support added in z/VM 6.2 continue to use the same or equivalent devices following a relocation. The following CP monitor records have been updated to add the device EQID:
| Monitor Record | Record Name |
|---|---|
| Domain 1 Record 6 | Device Configuration Data |
| Domain 6 Record 1 | Vary On Device |
A new SSI Domain (Domain 11) and new monitor records have been added in conjunction with the single system image (SSI) cluster configuration and management support.
| Monitor Record | Record Name |
|---|---|
| Domain 1 Record 25 | SSI Configuration Information |
| Domain 11 Record 1 | State Change Synchronization Activity |
| Domain 11 Record 2 | State/Mode Information |
| Domain 11 Record 3 | State Change Event |
| Domain 11 Record 4 | Slot Definition |
In addition the following monitor records have been updated for the new user identity and configuration support:
| Monitor Record | Record Name |
|---|---|
| Domain 1 Record 15 | Logged on user |
| Domain 4 Record 1 | User Logon Data |
z/VM 6.2 provides shared disk enhancements that improve the support for sharing real DASD among z/VM images and simplifies the management of minidisk links and minidisk cache (MDC) for minidisks shared by multiple images. The following monitor records have been added for this support:
| Monitor Record | Record Name |
|---|---|
| Domain 6 Record 31 | Minidisk Activity |
| Domain 11 Record 6 | XDISK Serialization Activity |
| Domain 11 Record 7 | XDISK Activity |
The following monitor records have been updated for this support:
| Monitor Record | Record Name |
|---|---|
| Domain 0 Record 14 | Expanded Storage Data (Global) |
| Domain 4 Record 2 | User Logoff Data |
| Domain 4 Record 3 | User Activity Data |
With the added ability to relocate a virtual machine from one z/VM image in a single system image to another, the following monitor records have been added and updated:
Added monitor records:
| Monitor Record | Record Name |
|---|---|
| Domain 4 Record 11 | Guest Relocation Started |
| Domain 4 Record 12 | Guest Relocation Ended |
Updated monitor records:
| Monitor Record | Record Name |
|---|---|
| Domain 0 Record 3 | Real Storage Data (Global) |
| Domain 0 Record 7 | Shared Storage Data |
| Domain 0 Record 8 | User Data |
| Domain 0 Record 12 | User Wait States |
| Domain 1 Record 15 | Logged On User |
| Domain 2 Record 11 | I/O Priority Changes |
| Domain 4 Record 1 | User Logon |
| Domain 4 Record 2 | User Logoff Data |
| Domain 4 Record 3 | User Activity Data |
| Domain 4 Record 4 | User Interaction Data |
| Domain 8 Record 1 | Virtual NIC Session Activity |
| Domain 10 Record 2 | Sample Application Data |
The following monitor records have been added or changed for the new CPU-Measurement Facility Host Counters support.
| Monitor Record | Record Name |
|---|---|
| Domain 1 Record 14 | Domain Detail |
| Domain 5 Record 13 | CPU-Measurement Facility |
To record information for data added by the new System Topology support, the following two new records have been added:
| Monitor Record | Record Name |
|---|---|
| Domain 1 Record 26 | System Topology (Configuration) |
| Domain 5 Record 14 | System Topology (Event) |
To provide additional debug information for system and performance problems, z/VM 6.2 added or changed these monitor records:
| Monitor Record | Record Name |
|---|---|
| Domain 0 Record 2 | Processor Data (per processor) |
| Domain 0 Record 13 | Scheduler Activity (per processor) |
| Domain 0 Record 17 | Physical CPU Data Utilization Data for LPAR Management |
| Domain 0 Record 23 | Formal Spin Lock Data |
| Domain 1 Record 1 | Event Profile |
| Domain 1 Record 4 | System Configuration Data |
| Domain 1 Record 6 | Device Configuration Data |
| Domain 1 Record 7 | Memory Configuration Data |
| Domain 1 Record 9 | Sample Profile |
| Domain 1 Record 18 | Record of CPU Capability Change |
| Domain 2 Record 9 | SET SHARE Changes |
| Domain 2 Record 13 | Add VMDBK to the limit list |
| Domain 2 Record 14 | Drop VMDBK from the limit list |
| Domain 3 Record 1 | Real Storage Management (Global) |
| Domain 3 Record 2 | Real Storage Activity (per processor) |
| Domain 3 Record 4 | Auxiliary Storage Management |
| Domain 3 Record 21 | Central Storage added to Real Memory |
| Domain 4 Record 9 | User Activity at Transaction End |
| Domain 5 Record 9 | Crypto Performance Counters |
| Domain 6 Record 1 | Vary On Device |
| Domain 6 Record 21 | Virtual Switch Activity |
z/VM 6.2 corrects a problem in how the high-frequency state sampler assesses state for the base virtual CPU of a virtual MP guest. It has always been true that if a nonbase virtual CPU goes to the dispatch list, the base virtual CPU goes also even if it is nondispatchable. Prior to z/VM 6.2, the high-frequency state sampler would count such a base virtual CPU as "other" state. This led to elevated "other" counts. On z/VM 6.2, the high-frequency state sampler counts such a base virtual CPU as "dormant" state. Monitor records D4 R4 MRUSEINT and D4 R10 MRUSEITE are affected.
VM64818 for z/VM 5.4 and z/VM 6.1 changed the D1 R4 MRMTRSYS record to add a new flag byte MTRSYS_CALLEVEL. This flag byte records the presence of APARs that add ambiguous changes to Monitor records. On those two releases only, if VM64818 is applied, the bits in MTRSYS_CALLEVEL have the following meanings:
x80                VM64798 is installed (z/VM 6.1 only)
x40                VM64794 is installed (z/VM 5.4 or 6.1)
All other bits     unused
In z/VM 6.2 these two bits are no longer meaningful.
D5 R9 MRPRCAPC is now generated only if crypto hardware is present in the partition.
Command and Output Changes
This section cites new or changed commands or command outputs that are relevant to the task of performance management. The section does not give syntax diagrams, sample command outputs, or the like. Current copies of z/VM publications can be found in our online library.
MONITOR: adds support for new domains.
MONITOR SAMPLE: adds support for CPU Measurement Facility host counters. Also affects z/VM 5.4 and z/VM 6.1 if VM64961 is applied.
QUERY CAPABILITY: command outputs are modified to support z196. Also affects z/VM 5.4 and z/VM 6.1 if VM64798 is applied.
QUERY ISFC TRANSPORT: new command.
QUERY ISLINK: changes output format to reflect ISFC's new data-carrying capabilities.
QUERY MDCACHE: adds support for MDC becoming disabled due to a write-link from another member of the SSI.
QUERY MONITOR: adds support for new domains.
QUERY MONITOR: adds support for CPU Measurement Facility host counters. Also affects z/VM 5.4 and z/VM 6.1 if VM64961 is applied.
QUERY REORDER: new command. Also new in z/VM 5.4 and 6.1 if VM64774 is applied.
SET REORDER: new command. Also new in z/VM 5.4 and 6.1 if VM64774 is applied.
SET SRM STORBUF: The defaults on SET SRM STORBUF are now 300 250 200.
SET SRM LIMITHARD: The default for SET SRM LIMITHARD is now CONSUMPTION.
VMRELOCATE: new command.
Effects on Accounting Data
VM64798 (z196 support) changed the type 0D record to add CPU capability fields:
ACONCCAP DS    CL8   (45-52) Nominal CPU Capability
ACOCCR   DS    CL3   (53-55) Capacity-Change Reason
ACOCAI   DS    CL3   (56-58) Capacity-Adjustment Indication
ACOCPRSV DS    CL20  (59-78) Reserved
The new fields are all character representations of decimal values, left-padded with zeroes.
Performance Toolkit for VM Changes
Performance Toolkit for VM has been enhanced in z/VM 6.2.
The following reports have been changed:
Performance Toolkit for VM: Changed Reports
| Name | Number | Title | What Changed |
| CHANNEL | FCX107 | Channel Load |
|
| CPU | FCX100 | CPU Load and Transactions |
|
| DASDLOG | FCX183 | DASD performance log |
|
| DEMNDLOG | FCX259 | Demand Scan Log |
|
| DEVCONF | FCX131 | I/O Device Configuration |
|
| DEVCONF | FCX131 | I/O Device Configuration |
|
| DEVICE | FCX108 | General I/O Device |
|
| DEVICE CPOWNED | FCX109 | CP Owned Device |
|
| DEVICE details | FCX110 | I/O Device Details |
|
| DEVLOG | FCX168 | General I/O Device Data Log |
|
| GVNIC | FCX268 | General Virtual Network Device Description |
|
| GVSWITCH | FCX266 | General Virtual Switch Description |
|
| LCHANNEL | FCX161 | LPAR Channel Load |
|
| LPAR | FCX126 | LPAR Log |
|
| LPARLOG | FCX202 | LPAR Load Log |
|
| LXCPU | FCX243 | General Linux CPU Utilization |
|
| MONDATA | FCX155 | Monitor Data Statistics |
|
| MONITOR | FCX124 | Performance Data Selection Menu |
|
| MONSET | FCX149 | Monitor Settings |
|
| PROCLOG | FCX144 | Processor Log |
|
| QDIO | FCX251 | QDIO Activity |
|
| QDIOLOG | FCX252 | QDIO Activity Log |
|
| SFSLOG | FCX150 | Shared File System Log |
|
| STORAGE | FCX103 | Storage Utilization |
|
| SYSCONF | FCX180 | System Configuration |
|
| SYSSET | FCX154 | System Settings |
|
| SYSSUMLG | FCX225 | System Summary Log |
|
| SYSTEM | FCX102 | System Counters |
|
| UCOMM | FCX132 | User Communication |
|
| UCOMMLOG userid | FCX167 | User Communication Log |
|
| UCONF | FCX226 | User Configuration |
|
| UPAGE | FCX113 | User Page Data |
|
| UPAGELOG userid | FCX163 | User Page Data Log |
|
| USER userid | FCX115 | User Resource Details |
|
| VNIC | FCX269 | Virtual Network Device Activity |
|
The following reports are new:
Performance Toolkit for VM: New Reports
| Name | Number | Title | Description |
| SSIMENU | FCX271 | SSI Data Menu | The SSI Data Menu displays a selection menu of available SSI / ISFC reports. |
| ISFECONF | FCX272 | ISFC End Point Configuration | The ISFC End Point Configuration Screen displays the ISFC end points present on this system. |
| ISFEACT | FCX273 | ISFC End Point Activity | The ISFC End Point Activity Screen displays ISFC transport traffic by endpoint. |
| ISFLACT | FCX274 | ISFC Logical Link Activity | The ISFC Logical Link Activity Screen displays ISFC logical link activity. |
| ISFLCONF | FCX275 | ISFC Logical Link Configuration | The ISFC Logical Link Configuration Screen displays the configuration of ISFC logical links. |
| SSICONF | FCX276 | SSI Configuration | The SSI Configuration Screen displays the SSI configuration of this system. |
| SSISCHLG | FCX277 | SSI State Change Synchronization Activity Log | The SSI State Change Synchronization Activity Log Screen displays the current SSI state change synchronization activity, by time. |
| SSISMILG | FCX278 | SSI State/Mode Information Log | The SSI State/Mode Information Log Screen displays SSI configuration of this system, by time. |
| ISFELOG epoint | FCX279 | ISFC End Point Activity Log | The ISFC End Point Activity Log screen shows a log of the activity of the selected ISFC endpoint. The screen is available from BENCHMRK menu. |
| ISFLLOG partner | FCX280 | ISFC Logical Link Activity Log | The ISFC Logical Link Activity Log displays a log of the traffic on the selected ISFC logical link. The screen is available from BENCHMRK menu. |
| ISFLALOG | FCX281 | ISFC Logical Link Activity By-Time Log | The ISFC Logical Link Activity By-Time Log displays overall performance data for all ISFC logical links existing in the system, by time. |
IBM continually improves Performance Toolkit for VM in response to customer-reported and IBM-reported defects or suggestions. In Function Level 620, the following small improvements or repairs are notable:
- Obsolete TFTP report removed.
- Obsolete DASD I/O Assist report (IOASSIST) removed.
- FCONX $PROFILE (sample) file corrected for optimal default settings.
- The Performance Toolkit for VM does not start with VMSIZE less than 32M.
- The maximum allowed REDISP count has been increased to 14400.
- The new message '*** Status refreshed ***' is displayed on the configuration screens each time the Monitor configuration data is received.
- The Performance Toolkit for VM sends a proper alert in case of any Perfkit abend to a special user defined by the FC MAINTID command.
- Special notification message FCX111I is issued and stays displayed when PERFKIT encounters a critical condition.
- Corrected SHARE values in USER reports for mixed engine configuration.
- The Emergency Safeguard Feature (ESF) controlled by FC EMERGENC subcommand was developed.
- Added support of multi-day Monitor data files in BATCH mode.
- Added support of benchmark feature for multi-day Monitor data files.
- Added the logoff button to the Web interface screen.
- Added the new parameter to the FC MONCOLL WEBSERV command to implement an ability to change the default timeout (30 min) for inactive Web sessions.
- Added *VSWITCH, *ASYNCMD, *SCLP, *VMEVENT services to some reports.
- The Performance Toolkit for VM now supports new SMAPI APIs for Event Management.
Omegamon XE Changes
Omegamon XE has added several new workspaces so as to expand and enrich its ability to comment on z/VM system performance. In particular, Omegamon XE now offers these additional workspaces and functions:
- System Health
- Resource Constraint
- Virtual Memory Overcommit
- Scaled LPAR usage metrics
- Integration with TBSM
To support these Omegamon XE endeavors, Performance Toolkit for VM now puts additional CP Monitor data into the PERFOUT DCSS.
Back to Table of Contents.
New Functions
This section contains discussions of the following performance evaluations:
- Live Guest Relocation
- Workload and Resource Distribution
- ISFC Improvements
- Storage Management Improvements
Back to Table of Contents.
Live Guest Relocation
Abstract
With z/VM 6.2, the z/VM Single System Image (SSI) cluster is introduced. SSI is a multisystem environment in which the z/VM member systems can be managed as a single resource pool. Running virtual servers (guests) can be relocated from one member to another within the SSI cluster using the new VMRELOCATE command. For a complete description of the VMRELOCATE command, refer to z/VM: CP Commands and Utilities Reference.
Live Guest Relocation (LGR) is a powerful tool that can be used to manage maintenance windows, balance workloads, or perform other operations that might otherwise disrupt logged-on guests. For example, LGR can be used to allow critical Linux servers to continue to run their applications during planned system outages. LGR can also enable workload balancing across systems in an SSI cluster without scheduling outages for Linux virtual servers. For information concerning setting up an SSI cluster for LGR, refer to z/VM: Getting Started with Linux on System z.
For live guest relocation, our experiments evaluated two key measures of relocation performance: quiesce time and relocation time.
-
Quiesce time is the
amount of time a relocating guest virtual machine is stopped.
Quiesce occurs during the final two passes through
storage to move all the guest's pages that have changed since the
previous pass. It is important to minimize the quiesce time because
the guest is not running for this length of time. Certain
applications may have a limit on the length of quiesce time that
they can tolerate and still resume running normally after relocation.
- Relocation time is the amount of elapsed time from when the VMRELOCATE command is issued to when the guest virtual machine is successfully restarted on the destination system. The relocation time represents the total time required to complete the relocation of a guest virtual machine. Relocation time can be important because a whole set of relocations might need to be accomplished during a fixed period of time, such as a maintenance window.
The performance evaluation of LGR surfaced a number of factors affecting quiesce time and relocation time. The virtual machine size of the guest being relocated, the existing work on the source system and destination system, storage constraints on the source and destination systems, and the ISFC logical link configuration all influence the performance of relocations.
The evaluation found serial relocations (one at a time) generally provide the best overall performance results. The IMMEDIATE option provides the most efficient relocation, if minimizing quiesce time is not a priority for the guest being relocated.
Some z/VM monitor records have been updated and additional monitor records have been added to monitor the SSI cluster and guest relocations. A summary of the z/VM monitor record changes for z/VM 6.2 is available here.
Introduction
With z/VM 6.2, the introduction of z/VM Single System Image clusters and live guest relocation further improves the high availability of z/VM virtual servers and their applications. LGR provides the capability to move guest virtual machines with running applications between members of an SSI cluster. Prior to z/VM 6.2, customers had to endure application outages in order to perform system maintenance or other tasks that required a virtual server to be shut down or moved from one z/VM system to another.
This article explores the performance aspects of LGR, specifically, quiesce time and the total relocation time, for Linux virtual servers that are relocated within an SSI cluster. The system configurations and workload characteristics are discussed in the context of the performance evaluations conducted with z/VM 6.2 systems configured in an SSI cluster.
Background
This background section provides a general overview of things you need to consider before relocating guests. In addition, there is a discussion about storage capacity checks that are done by the system prior to and during the relocation process. There is also an explanation of how relocation handles memory move operations. Finally, there is a discussion of the throttling mechanisms built into the system to guard against overrun conditions that can arise on the source or destination system during a relocation.
General Considerations Prior to Relocation
In order to determine whether there are adequate storage resources available on the destination system, these factors should be considered:
- Storage taken by private VDISKs that the guest owns.
- The size to which the guest could grow, including standby and reserved storage settings.
- The level of storage overcommitment on the destination system prior to relocation.
Relocation may increase paging space demands on the destination system. Adhere to existing guidelines regarding number of paging slots required, remembering to include the incoming guests in calculations. One guideline often quoted is that the total number of defined paging slots should be at least twice as large as the total virtual storage across all guests and VDISKs. This can be checked with the UCONF, VDISKS, and DEVICE CPOWNED reports of Performance Toolkit.
One simple paging space guideline that should be considered is to avoid running the system in such a fashion that DASD paging space becomes more than 50% full. The easiest way to check this is to issue CP QUERY ALLOC PAGE. This command will show the percent used, the slots available, and the slots in use. If adding the size of the virtual machine(s) to be relocated (a 4KB page = a 4 KB slot) to the slots in use brings the in use percentage to over 50%, the relocation may have an undesirable impact on system performance.
If in doubt about available resources on the destination system, issue VMRELOCATE TEST first. The output of this command will include appropriate messages concerning potential storage issues on the destination system that could result if the relocation is attempted.
It is important to note that the SET RESERVED setting for the guest (if any) on the source system is not carried over to the destination system. The SET RESERVED setting for the guest on the destination should be established after the relocation completes based on the available resources and workload on the destination system.
Similarly, it is important to consider the share value for the guest being relocated. Even though the guest's SET SHARE value is carried over to the destination system, it may need to be adjusted with respect to the share values of other guests running on the destination system.
For a complete list of settings that do not carry over to the destination system or that should be reviewed, consult the usage notes in the VMRELOCATE command documentation (HELP VMRELOCATE).
Certain applications may have a limit on the length of quiesce time (length of time the application is stopped) that they can tolerate and still resume running normally after relocation. Consider using the MAXQuiesce option of the VMRELOCATE command to limit the length of quiesce time.
Mandatory Storage Checking Performed During Relocation
As part of eligibility checking and after each memory move pass, relocation ensures the guest's current storage size fits into available space on the destination system. For purposes of the calculation, relocation assumes the guest's storage is fully populated (including the guest's private VDISKs) and includes an estimate of the size of the supporting CP structures. Available space includes the sum of available central, expanded, and auxiliary storage.
This storage availability check cannot be bypassed. If it fails, the relocation is terminated. The error message displayed indicates the size of the guest along with the available capacity on the destination system.
Optional Storage Checks Performed During Relocation
In addition to the mandatory test described above, by default the following three checks are also performed during eligibility checking and after each memory move pass. The guest's maximum storage size includes any standby and reserved storage defined for it.
- Will the guest's current storage size (including CP supporting structures) exceed auxiliary paging space on the destination system?
- Will the guest's maximum storage size (including CP supporting structures) exceed available space (central storage, expanded storage, and auxiliary storage) on the destination system?
- Will the guest's maximum storage size (including CP supporting structures) exceed auxiliary paging space on the destination system?
If any of these tests fail, the relocation is terminated. The error message(s) displayed indicates the size of the guest along with the available capacity on the destination system.
If you decide the above three checks do not apply to your installation (for instance, because there is an abundance of central storage and a less-than-recommended amount of paging space), you can bypass them by specifying the FORCE STORAGE option on the VMRELOCATE command.
Determining the Number of Passes Through Storage During Relocation
When relocating a guest, the number of passes made through the guest's storage (referred to as memory move passes) is a factor in the length of quiesce time and relocation time for the relocating guest.
The number of memory move passes for any relocation will vary from three to 18. The minimum of three -- called first, penultimate, and final -- can be obtained only by using the IMMEDIATE option on the VMRELOCATE command.
When the IMMEDIATE option is not specified, the number of intermediate memory move passes is determined by various algorithms based on the number of changed pages in each pass to attempt to reduce quiesce time.
- A relocation will complete in four passes if the number of pages moved in pass 2 is lower than the calculated quiesce threshold or the time value specified as the maximum quiesce time (MAXQuiesce option) is expected to be met.
- An application that is not making progress toward the quiesce threshold will complete in eight passes.
Live Guest Relocation Throttling Mechanisms
The relocation process monitors system resources and might determine a relocation needs to be slowed down temporarily to avoid exhausting system resources.
Conditions that can arise and cause a throttle on the source system are:
- A shortage of available frames for storing outbound guest page content,
- An excessive number of paging requests queued on the paging volumes,
- An excessive number of outbound messages queued on the ISFC logical link,
- A destination system backlog where the destination system signals the source system to suspend processing until the overrun condition on the destination system is relieved.
Conditions that can arise and cause a throttle on the destination system are:
- A shortage of available frames for storing inbound guest page content,
- An excessive number of paging requests queued on the paging volumes,
- Contention with the storage frame replenishment mechanism for serialization of the relocating guest's pages,
- An excessive number of inbound messages on the logical link memory move socket.
Also, because relocation messages need to be presented to the destination system in the order in which they are sent, throttling might occur for the purpose of ordering inbound messages arriving on the ISFC logical link.
Resource Consumption Habits of Live Guest Relocation
Live guest relocation has a high priority with regards to obtaining CPU cycles to do work. This is because it runs under SYSTEMMP in the z/VM Control Program. SYSTEMMP work is prioritized over all non-SYSTEMMP work.
However, from a storage perspective, the story is quite different. Existing work's storage demands take priority over LGR work. As a result, LGR performance is worse when the source system and/or destination system is storage constrained.
Factors that Affect the Performance of Live Guest Relocation
Several factors affect LGR's quiesce time and relocation time. These factors are summarized here; the discussion is expanded where they are encountered in our workload evaluations.
-
The virtual machine size of the guest being relocated.
The larger the size, the longer the quiesce time and relocation time. The guest's dynamic address translation table (DAT) structures are scanned for relocation. The size of the DAT structures is directly related to the size of the guest virtual machine.
-
Existing work on the source and destination systems.
Existing work can cause contention for resources used by LGR. Generally, the more work being performed on the source and destination systems, the longer it will take relocations to complete.
-
Resource use characteristics of the applications and the running
environment of the relocating guest.
Characteristics such as how often the guest's pages are changing, whether the guest's pages are in resident memory, or expanded memory, or on DASD paging packs affects the length of quiesce time and relocation time.
-
System constraints on the source and destination systems.
Storage constraints and CPU constraints will lengthen quiesce time and relocation time whenever LGR must contend for these resources.
-
Concurrent versus serial guest relocations.
Concurrent relocations create more contention for system resources. This contention typically results in longer quiesce times. With one-at-a-time relocations, there is generally less resource contention.
-
The configuration of the ISFC logical link between the source system
and the destination system.
The most efficient ISFC logical link configuration is when each CHPID has four to five real device addresses activated. In addition, the speed of the FICON CHPIDs is also a factor. For example, 8 Gigabit FICON CHPIDs will move data faster than 4 Gigabit FICON CHPIDs. For more information about ISFC logical link performance, refer to our ISFC article.
Method
The performance aspects of live guest relocation were evaluated with various workloads running with guests of various sizes, running various combinations of applications, and running in configurations with and without storage constraints. These measurements were done with two-member SSI clusters. With the two-member SSI cluster, both member systems were in partitions with four dedicated general purpose CPs (Central Processors) on the same z10 CEC (Central Electronics Complex). Table 1 below shows the ISFC logical link configuration for the two-member SSI cluster.
Table 1. ISFC logical link configuration for the two-member SSI cluster.
| SSI Member System | ISFC Logical Link (FICON CHPIDs) | ISFC Capacity Factor * | SSI Member System |
| GDLMPPB1 | 1-2Gb, 2-4Gb, 1-8Gb | 18 | GDLMPPB2 |
| Note: * ISFC capacity factor is the sum of speeds of the FICON CHPIDs between the SSI member systems. | |||
Measurements were also conducted to evaluate the effect of LGR on existing workloads on the source and destination systems. A four-member SSI cluster was used to evaluate these effects. The four-member SSI cluster was configured across two z10 CECs with three members on one CEC and one member on the other CEC. Each member system was configured with four dedicated general purpose CPs. Table 2 below shows the ISFC logical link configuration for the four-member SSI cluster.
Table 2. ISFC logical link configuration for the four-member SSI cluster.
| SSI Member System | ISFC Logical Link (FICON CHPIDs) | ISFC Capacity Factor * | SSI Member System |
| GDLEPPA1 | 2-2Gb, 2-4Gb | 12 | GDLMPPA2 |
| GDLEPPA1 | 1-2Gb, 1-4Gb | 6 | GDLMPPA3 |
| GDLEPPA1 | 1-2Gb, 1-4Gb | 6 | GDLMPPA4 |
| GDLEPPA2 | 2-2Gb, 2-4Gb | 12 | GDLMPPA3 |
| GDLEPPA2 | 1-2Gb, 1-4Gb | 6 | GDLMPPA4 |
| GDLEPPA3 | 1-2Gb, 1-4Gb | 6 | GDLMPPA4 |
| Note: * ISFC capacity factor is the sum of speeds of the FICON CHPIDs between the SSI member systems. | |||
Results and Discussion
Evaluation - LGR with an Idle Guest with Varying Virtual Machine Size
The effect of virtual machine size on LGR performance was evaluated using an idle Linux guest. The selected virtual machine storage sizes were 2G, 40G, 100G, and 256G.
An idle guest is the best configuration to use for this measurement. With an idle guest there are very few pages moved after the first memory move pass. This means an idle guest should provide the minimum quiesce time and relocation time for a guest of a given size. Further, results should scale uniformly with the virtual storage size and are largely controlled by the capacity of the ISFC logical link.
The measurement ran in a two-member SSI cluster connected by an ISFC logical link made up of four FICON CTC CHPIDs configured as shown in Table 1.
There was no other active work on either the source or destination system.
Figure 1 illustrates the scaling of LGR quiesce time and relocation time for selected virtual machine sizes for an idle Linux guest.
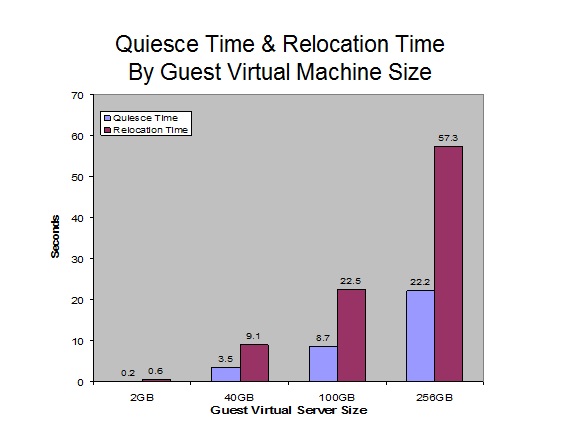
Quiesce time for an idle guest is dominated by the scan of the DAT tables and scales uniformly with the virtual storage size. Relocation time for an idle guest is basically the sum of the pass 1 memory move time and the quiesce time.
Evaluation - Capacity of the ISFC Logical Link
The effect of ISFC logical link capacity on LGR performance was evaluated using a 40G idle Linux guest. With an idle guest there are very few pages moved after the first memory move pass, so it is the best configuration to use to observe performance as a function of ISFC logical link capacity.
The evaluation was done in a two-member SSI cluster connected by an ISFC logical link. Five different configurations of the ISFC logical link were evaluated. Table 3 below shows the ISFC logical link configuration, capacity factor, and number of FICON CTCs for the five configurations evaluated.
Table 3. Evaluated ISFC Logical Link Configurations.
| ISFC Logical Link CHPIDs | ISFC Capacity Factor * | CTCs/FICON CHPID | Total CTCs |
| 1-2Gb, 2-4Gb, 1-8Gb | 18 | 4 | 16 |
| 1-2Gb, 2-4Gb | 10 | 4 | 12 |
| 1-2Gb, 1-4Gb | 6 | 4 | 8 |
| 1-4Gb | 4 | 4 | 4 |
| 1-2Gb | 2 | 4 | 4 |
| Note: * ISFC capacity factor is the sum of speeds of the FICON CTCs between the SSI member systems. | |||
There was no other active work on either the source or destination system.
Figure 2 shows the LGR quiesce time and relocation time for the ISFC logical link configurations that were evaluated. The chart illustrates the scaling of the quiesce time and relocation time as the ISFC logical link capacity decreases.
Figure 2. LGR Quiesce Time and Relocation Time as the
ISFC Logical Link Capacity Decreases.
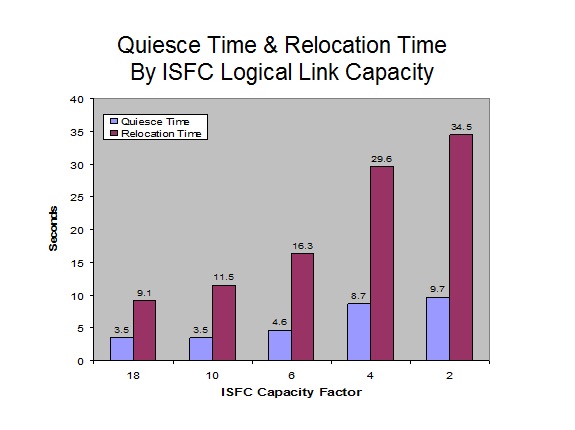
LGR performance scaled uniformly with the capacity of the logical link. Relocation time increases as the capacity of the logical link is decreased. Generally, quiesce time also increases as the capacity of the logical link is decreased.
Evaluation - Relocation Options that Affect Concurrency and Memory Move Passes
The effect of certain VMRELOCATE command options was evaluated by relocating 25 identical Linux guests. Each guest was defined as virtual 2-way with a virtual machine size of 4GB. Each guest was running the PING, PFAULT, and BLAST applications. PING provides network I/O; PFAULT uses processor cycles and randomly references storage, thereby constantly changing storage pages; BLAST generates application I/O.
Evaluations were completed for four different combinations of relocation options, listed below. In each case, the VMRELOCATE command for the next guest to be relocated was issued as soon as the system would allow it.
- Synchronous: using the VMRELOCATE command SYNC option
- Synchronous immediate: using the VMRELOCATE command SYNC option and IMMEDIATE option
- Asynchronous immediate: using the VMRELOCATE command ASYNC option and IMMEDIATE option
- Asynchronous: using the VMRELOCATE command ASYNC option
The measurement ran in a two-member SSI cluster connected by an ISFC logical link made up of four FICON CTC CHPIDs configured as shown in Table 1.
There was no other active work on either the source or destination system.
Figure 3 shows the average, minimum, and maximum LGR quiesce time and relocation time across the 25 Linux guests with each of the four relocation option combinations evaluated.
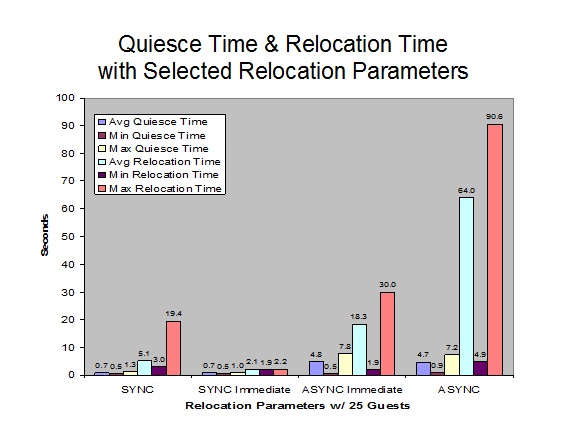
The combinations were assessed on success measures that might be important in various customer environments. Table 4 shows the combinations that did best on the success measures considered. No single combination was best at all categories.
Table 4. Success Measures and VMRELOCATE Option Combinations
| Achievement | Synchronous | Synchronous immediate | Asynchronous immediate | Asynchronous |
| Best total relocation time for all users | X | |||
| Best individual relocation times | X | |||
| Best individual quiesce times | X | |||
| Least number of memory move passes | X | X | ||
| Best response times for PING | X |
Evaluation - Storage Constraints
The effect of certain storage constraints was evaluated using a 100G Linux guest. The Linux guest was running the PFAULT application and changing 25% of its pages.
Four combinations of storage constraints were measured with this single large user workload:
- Non-constrained source system to non-constrained destination system (NC --> NC)
- Non-constrained source system to constrained destination system (NC --> C)
- Constrained source system to non-constrained destination system (C --> NC)
- Constrained source system to constrained destination system (C --> C)
To create these storage constraints, the following storage configurations were used:
- Non-constrained partitions were configured with 60G of central storage and 2G of expanded storage.
- Constrained partitions were configured with 22G of central storage and no expanded storage.
The measurement ran in a two-member SSI cluster connected by an ISFC logical link made up of four FICON CTC CHPIDs configured as shown in Table 1.
There was no other active work on either the source or destination system.
Figure 4 shows the LGR quiesce time and relocation time for the 100G Linux guest with each of the four storage-constrained combinations.
Figure 4. LGR Quiesce Time and Relocation Time with
Source and/or Destination Storage Constraints.
Relocation for the non-constrained source to non-constrained
destination
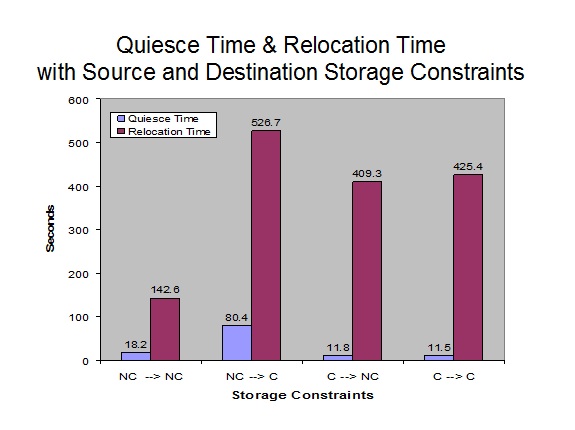
No Constraints
Compared to the idle workload, relocation time increased approximately 500% because of the increased number of memory move passes and the increased number of changed pages moved during each pass. Quiesce time increased approximately 100% because of the increased number of changed pages that needed to be moved during the quiesce passes.
| Metric | Idle | NC-->NC * | Delta | Pct Delta |
| Run Name | W0-SGLDD | W0-SGLDA | ||
| Quiesce Time (sec) | 8.71 | 18.16 | 9.45 | 108.5 |
| Relocation Time (sec) | 22.46 | 142.56 | 120.10 | 534.7 |
| Memory Move Passes | 4 | 8 | 4 | 100.0 |
| Total Pages Moved | 1297347 | 41942816 | 40645469 | 3133.0 |
| Note: * NC-->NC includes PFAULT running on the 100G Guest randomly changing 25% of its pages. | ||||
Non-Constrained Source to Constrained Destination (NC-->C)
Relocation for the non-constrained source to constrained destination took eight memory move passes as expected, with nearly 25G of changed pages moved in each of passes 2 through 6.
Compared to the non-constrained destination, relocation time increased more than 250% and quiesce time increased more than 300% because of throttling on the destination system while pages were being written to DASD. Since each memory move pass took longer, the application was able to change more pages and thus the total pages moved during the relocation was slightly higher.
| Metric | NC-->NC | NC-->C | Delta | Pct Delta |
| Run Name | W0-SGLDA | W0-SGLDF | ||
| Quiesce Time (sec) | 18.16 | 80.35 | 62.19 | 342.5 |
| Relocation Time (sec) | 142.56 | 526.69 | 384.13 | 269.5 |
| Memory Move Passes | 8 | 8 | 0 | 0 |
| Total Pages Moved | 41942816 | 46469235 | 4526419 | 10.8 |
Constrained Source
Relocation for the constrained source to non-constrained destination completed in the maximum 18 memory move passes. Because the application cannot change pages very rapidly (due to storage constraints on the source system), fewer pages need to be relocated in each pass, so progress toward a shorter quiesce time continues for the maximum number of passes.
Both measurements with the constrained source (C --> NC and C --> C) had similar relocation characteristics, so the constraint level of the destination system was not a significant factor.
Compared to the fully non-constrained measurement (NC --> NC), relocation time increased approximately 180%, but quiesce time decreased more than 30%. Fewer changed pages to move during the quiesce memory move passes accounts for the improved quiesce time.
| Metric | NC-->NC | C-->NC | Delta | Pct Delta |
| Run Name | W0-SGLDA | W0-SGLD8 | ||
| Quiesce Time (sec) | 18.16 | 11.84 | -6.32 | -34.8 |
| Relocation Time (sec) | 142.56 | 409.33 | 266.77 | 187.1 |
| Memory Move Passes | 8 | 18 | 10 | 125.0 |
| Total Pages Moved | 41942816 | 8914603 | -33028213 | -78.6 |
Evaluation -- Effects of LGR on Existing Workloads
The effect of LGR on existing workloads was evaluated using two 40G idle Linux guests.
The measurement ran in a four-member SSI cluster connected by ISFC logical links using FICON CTC CHPIDs configured as shown in Table 2.
One idle Linux guest was continually relocated between members one and two, while a second idle Linux guest was continually relocated between members three and four.
A base measurement for the performance of these relocations was obtained by running the relocations alone in the four-member SSI cluster.
An Apache workload provided existing work on each of the SSI member systems. Three different Apache workloads were used for this evaluation:
-
Non-constrained storage environment with Apache webserving and LGR
In this configuration Apache is able to use all the available processor cycles, so any cycles used by LGR have an effect on the Apache workload.
-
Non-constrained storage environment with virtual-I/O-intensive
Apache webserving and LGR
In this configuration Apache is limited by DASD response time, reducing its ability to consume processor cycles. So both processor cycles and storage are available for LGR.
-
Storage-constrained environment with Apache webserving and LGR
In this configuration LGR is affected by the shortage of available storage. Because of this, LGR does not use much in the way of processor cycles, leaving plenty of cycles available for Apache.
Base measurements for the performance of each of these Apache workloads were obtained by running them without the relocating Linux guests.
Comparison measurements were obtained by running each of the Apache workloads again with the addition of the idle Linux guest relocations included. In this way the effect of adding live guest relocations to the existing Apache workloads could be evaluated.
Figure 5 shows the throughput ratios for LGR and Apache with each of the three Apache workloads. It illustrates the impact to throughput for LGR and Apache in each case.
Figure 5. LGR Interference with an Existing Apache Workload
Running on Each SSI Member.
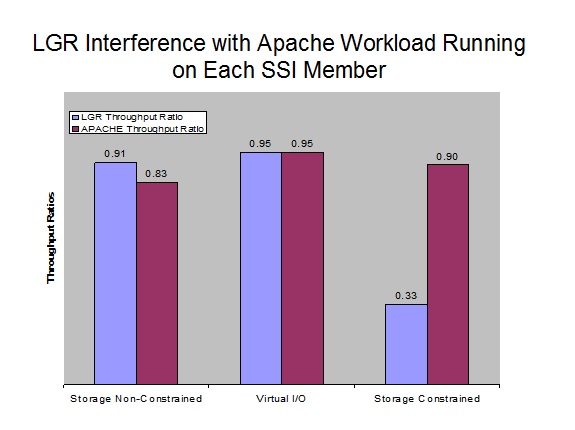
For the non-constrained storage environment with LGR and Apache webserving, LGR has the ability to use all of the processor cycles that it desires. This results in the Apache workload being limited by the remaining available processor cycles. With this workload, Apache achieved only 83% of its base rate while LGR achieved 91% of its base rate.
For the non-constrained storage environment with LGR and virtual-I/O-intensive Apache webserving, neither the LGR workload nor the Apache workload was able to use all of the processor cycles and storage available, so the impact to each workload is expected to be minimal and uniform. Both the LGR workload and the Apache workload achieved 95% of their base rate.
For the storage-constrained environment with LGR and Apache webserving, LGR has throttling mechanisms that reduce interference with existing workloads. Because of this, LGR is expected to encounter more interference in this environment than the Apache workload. The LGR workload achieved only 33% of its base rate while the Apache workload achieved 90% of its base rate.
Summary and Conclusions
A number of factors affect live guest relocation quiesce time and relocation time. These factors include:
- The virtual machine size of the Linux guest being relocated;
- Existing work on the source system and/or destination system;
- Resource use characteristics of the applications and the running environment of the relocating guest;
- System constraints on the source system and/or destination system;
- Serial versus concurrent relocations;
- The ISFC logical link configuration between the source and destination systems.
Serial relocations provide the best overall results. This is the recommended method when using LGR.
Doing relocations concurrently can significantly increase quiesce times and relocation times.
If minimizing quiesce time is not a priority for the guest being relocated, using the IMMEDIATE option provides the most efficient relocation.
Live guest relocations in CPU-constrained environments generally will not limit LGR since it runs under SYSTEMMP. This gives LGR the highest priority for obtaining processor cycles.
In storage-constrained environments, existing work on the source and destination systems will take priority over live guest relocations. As a result, when storage constraints are present, LGR quiesce time and relocation time will typically be longer.
Back to Table of Contents.
Workload and Resource Distribution
Abstract
In z/VM 6.2, up to four z/VM systems can be connected together into a cluster called a z/VM Single System Image cluster (SSI cluster). An SSI cluster is a multisystem environment in which the z/VM member systems can be managed as a single resource pool. System resources and workloads can be distributed across the members of an SSI cluster to improve resource efficiency, to achieve workload balancing, and to prepare for Live Guest Relocation (LGR). This multisystem environment can also be used to let a workload consume resources beyond what a single z/VM system can supply.
Distributing system resources and workloads across an SSI cluster provided benefit by improving processor efficiency in a CPU-constrained environment. A virtual-I/O-constrained environment running in an SSI cluster benefitted by increasing exposures to the shared DASD packs. A memory-constrained environment running in an SSI cluster benefitted by improving processor efficiency and reducing the memory overcommitment ratio.
A workload designed to use 1 TB of real memory across a four-member SSI cluster scaled linearly and was not influenced by the SSI cluster environment running in the background.
SSI state transitions did not influence individual workloads in the SSI cluster.
Introduction
With z/VM 6.2 up to four z/VM images can be connected together to form an SSI cluster. The new support allows for resource and workload balance, preliminary system configuration for LGR, and resource growth beyond the current z/VM limitations for a defined workload.
This article evaluates the performance benefit when different workloads and the system resources are distributed across an SSI cluster. It also demonstrates that the z/VM image performance is not influenced by SSI transition states. Lastly, this article demonstrates how a workload and resources scale to 1 TB of real memory across a four-member SSI cluster.
Background
With one z/VM image, a workload can use up to 256 GB of real memory and 32 processors. The system administrator can divide an existing workload and system resources across an SSI cluster or the system administrator can build a workload to use resources beyond the current z/VM system limits, notably real memory and real processors.
Table 1 shows z/VM system limits for a workload distributed across an SSI.
| z/VM System Limits | 1-Member | 2-Member | 3-Member | 4-Member |
| Real Memory | 256 GB * | 512 GB * | 768 GB | 1 TB * |
| IFLs | 32 | 64 | 96 | 128 |
| Note: * System limits measured in this report | ||||
Members of an SSI cluster have states that describe the status of each member within the cluster. Valid states are Down, Joining, Joined, Leaving, Isolated, Suspended, and Unknown. A member that is shut down and then IPLed will transition through four of the seven states, namely, Leaving, Down, Joining, and Joined. Deactivating ISFC links transitions the member from a Joined state to a Suspended or Unknown state. Reactivating the ISFC links transitions the member back to a Joined state.
The current state of each member in an SSI cluster can be verified through a new CP command, QUERY SSI. The following is an example of an output for a QUERY SSI command:
In this SSI cluster, member SYSTEM01 is up and Joined. The remaining members of the SSI cluster are not IPL'd and Down.
In this article the words SSI cluster member or simply member describe a system that is a member of the SSI cluster.
Method
Workload Distribution Measurements
Three separate Apache workloads were used to evaluate the benefits of distributing workloads and system resources across an SSI cluster.
- The first base environment studied was a CPU-constrained environment in which the workload was using 100% of the IFLs.
- The second base environment studied was a virtual I/O environment in which the workload was bound by DASD I/O.
- The third base environment studied was a z/VM memory-constrained environment in which the workload was 1.2x memory overcommitted.
Table 2 contains the common configuration parameters for each of the three Apache workloads as the workloads are distributed across the SSI clusters. These choices keep the number of CPUs and amount of memory constant across the configurations.
Table 2. Common configuration parameters for workload distribution
| Resources Defined per member in SSI cluster | 1-member | 2-member | 4-member |
| Central storage | 43 GB | 22 GB | 11 GB |
| XSTOR | 8 GB | 8 GB (4 GB *) | 8 GB (2 GB *) |
| Processors | 12 | 6 | 3 |
|
Note: * XSTOR setting for the memory-constrained workload
System model: 2097-742 | |||
Table 2.1, Table 2.2, and Table 2.3 contain the specific configuration parameters for the CPU-constrained, virtual-I/O-constrained, and memory-constrained workloads respectively.
Table 2.1 Specific configuration parameters for CPU-constrained workload
| Resources Defined per SSI cluster member | 1-member | 2-member | 4-member |
| Server virtual machines | 16 | 8 | 4 |
| Client virtual machines | 8 | 4 | 2 |
| Sessions * | 32 | 16 | 8 |
|
Note: * based on Apache SSI-mode workload
Client connections per server = 1; Number of 1 MB HTML files = 1200; Server virtual memory = 1 GB; Client virtual memory = 1 GB; Server virtual processors = 1; Client virtual processors = 1 | |||
Table 2.2 Specific configuration parameters for virtual-I/O-constrained workload
| Resources Defined per SSI cluster member | 1-member | 2-member | 4-member |
| Server virtual machines | 16 | 8 | 4 |
| Client virtual machines | 4 | 2 | 1 |
| Sessions * | 32 | 16 | 8 |
|
Note: * based on Apache SSI-mode workload
Client connections per server = 1; Number of 1 MB HTML files = 3000; Server virtual memory = 256 MB; Client virtual memory = 1 GB; Server virtual processors = 1; Client virtual processors = 3; System MDC OFF so as to force virtual I/O | |||
Table 2.3 Specific configuration parameters for memory-constrained workload
| Resources Defined per SSI cluster member | 1-member | 2-member | 4-member |
| Server virtual machines | 48 | 24 | 12 |
| Client virtual machines | 8 | 4 | 2 |
| Sessions * | 480 | 240 | 120 |
|
Note: * based on Apache SSI-mode workload
Client connections per server = 5; Number of 1 MB HTML files = 1200; Server virtual memory = 1 GB; Client virtual memory = 1 GB; Server virtual processors = 1; Client virtual processors = 1 | |||
Scaling Measurements
Three Apache measurements were completed to evaluate the z/VM Control Program's ability to scale to 1 TB of real memory across a four-member SSI cluster. Each SSI cluster member was configured to use 256 GB of real memory, which is the maximum supported memory for a z/VM system. Table 3 contains the configuration parameters for each measurement.Table 3. SSI Apache configuration for 256 GB, 512 GB, and 1 TB measurements
| Parameters * | 1-member | 2-member | 4-member |
| Processor model | z10 | z10, z10 | z10, z10, z196, z196 |
| Central storage | 256 GB | 512 GB | 1 TB |
| XSTOR | 32 GB | 64 GB | 128 GB |
| Processors | 3 | 6 | 12 |
| Server virtual machines | 24 | 48 | 96 |
| Client virtual machines | 4 | 8 | 16 |
| Sessions | 24 | 96 | 384 |
|
Note: * Total for the SSI cluster
z10: 2097-742; z196: 2817-744 Client connections per server = 1; Number of 1 MB HTML files = 10K; Server virtual memory = 10 GB; Client virtual memory = 1 GB; Server virtual processors = 1; Client virtual processors = 1 | |||
State-Change Measurements
Two measurements were defined to demonstrate that the SSI state changes do not influence a workload running in any one of the members of the cluster.
- In the first measurement, as one member in a four-member SSI cluster was running an Apache workload, the other three members were changing their SSI state by constantly shutting down and reipl'ing the z/VM system.
- In the second measurement, as one member in the four-member SSI cluster was running an Apache workload, the same member was continuously deactivating and activating ISFC links.
Results and Discussion
Distributed Workload: CPU-constrained Apache
Table 4 compares a CPU-constrained environment in a one-, two-, and four-member SSI cluster.
Table 4. CPU-constrained workload distributed across an SSI cluster
| Number of SSI cluster Members | 1 | 2 | 4 |
| Run ID | A1NWA190 | A2NWA120 | A1NWA101 |
| Tx/sec (c) | 982.30 | 1160.93 | 1239.56 |
| Throughput ratio (c) | 1.00 | 1.18 | 1.26 |
| ITR (p) | 1020.47 | 1196.92 | 1306.85 |
| ITR ratio (c) | 1.00 | 1.17 | 1.28 |
| Real processors per SSI cluster member (p) | 12 | 6 | 3 |
| Total util/proc (p) | 99.3 | 99.7 | 98.2 |
| Cycles/instruction (h) | 5.07 | 4.28 | 4.15 |
| Instructions/tx (h) | 10587476 | 10573644 | 10544818 |
| Cache miss cycles/instruction (h) | 2.79 | 2.07 | 1.92 |
| Note: (p) = Data taken from Performance Toolkit; (c) = Data was calculated; (h) = Data taken from hardware instrumentation; Cycles/instruction = Processor cycles per instruction; Instructions/tx = Number of instructions issued per transaction; Cache miss cycles/instruction = Number of cycles an instruction stalled due to cache misses; | |||
Compared to the one-member SSI cluster the total throughput in the two-member and four-member SSI cluster increased by 18% and 26% respectively. The internal throughput increased by the same amount. While the total processor utilization remained nearly 100% busy and the number of instructions per transaction remained constant as the workload and resources were distributed across the SSI, the processor cycles/instruction decreased. The benefit is attributed to increased processor efficiency in small N-way configurations. According to the z/VM LSPR ITR Ratios for IBM Processors study, in a CPU-constrained environment, as the total number of processors decreases per z/VM system, the efficiency of each processor in a z/VM system increases.
Distributed Workload: Virtual-I/O-Constrained Apache
Table 5 compares a virtual-I/O-constrained environment in a one-, two- and four-member SSI cluster.
Table 5. Virtual-I/O-constrained workload distributed across an SSI cluster
| Number of Members | 1 | 2 | 4 |
| Run ID | A0VWA310 | A2VWA120 | A1VWA100 |
| Tx/sec (c) | 419.07 | 543.26 | 612.12 |
| Throughput ratio (c) | 1.00 | 1.30 | 1.46 |
| Total Virtual I/O Rate (p) | 2030 | 2683 | 2983 |
| Total Virtual I/O Rate Ratio (p) | 1.00 | 1.33 | 1.47 |
| Note: (p) = Data taken from Performance Toolkit; (c) = Data was calculated; | |||
In the one-member measurement, the workload is limited by virtual I/O.
Compared to the one-member SSI cluster, the throughput in the two-member and four-member SSI cluster increased by 33% and 46% respectively. As the workload and resources were distributed across a two-member and four-member SSI cluster, the total virtual I/O rate increased by 33% and 47%.
One of the volumes shared among the member of the SSI cluster is user volume LNX026. Table 5.1 compares real I/O for DASD pack LNX026 for a one-, two- and four-member SSI cluster.
Table 5.1 Real I/O for DASD Volume LNX026
| Number of Members | 1 | 2 | 4 |
| Run ID | A0VWA310 | A2VWA120 | A1VWA100 |
| Aggregate I/O rate (c) | 417 | 552 | 610 |
| Avg service time (c) | 1.9 | 2.1 | 2.5 |
| Volume %util (c) | 79 | 116 | 153 |
| Avg wait time (c) | 4.4 | 2.5 | 1.2 |
| Avg response time (c) | 6.3 | 4.6 | 3.7 |
| Note: (c) = Data was calculated; | |||
Distributing the I/O load for the shared volumes across four device numbers (one per member) lets the DASD subsystem overlap I/Os. As a result, I/O response time decreases and volume I/O rate increases. This is the same effect as PAV would have. By distributing the virtual I/O workload and resources across an SSI cluster, volume I/O rate increased, thus increasing the total throughput.
Distributed Workload: Memory-Constrained Apache
Table 6 compares a real-memory-constrained environment in a one-, two- and four-member SSI cluster.
Table 6. Memory-constrained workload distributed across an SSI cluster
| Number of Members | 1 | 2 | 4 |
| Run ID | A0SWB040 | A2SWA120 | A1SWA100 |
| Tx/sec (c) | 786.23 | 929.38 | 1037.24 |
| Throughput ratio (c) | 1.00 | 1.18 | 1.32 |
| Total util/proc (p) | 100.0 | 100.0 | 95.4 |
| ITR (p) | 800.0 | 968.2 | 1100.6 |
| ITR ratio (c) | 1.00 | 1.21 | 1.38 |
| Real processors per SSI cluster member (p) | 12 | 6 | 3 |
| Cycles/instruction (h) | 6.19 | 5.09 | 4.41 |
| Instructions/tx (h) | 10851821 | 10810178 | 11108661 |
| Cache miss cycles/instruction (h) | 3.97 | 2.93 | 2.26 |
| Resident pages <2 GB (p) | 0 | 520335 | 520304 |
| Avlst <2G AvailFrms (p) | 520000 | 320 | 570 |
| Avlst >2G AvailFrms (p) | 2011 | 2372 | 2048 |
| LXA_SERV DASD Paging (p) | 92.9 | 36.1 | 29.7 |
| Note: (p) = Data taken from Performance Toolkit; (c) = Data was calculated; (h) = Data taken from hardware instrumentation; Cycles/instruction = Processor cycles per instruction; Instructions/tx = Number of instructions issued per transaction; Cache miss cycles/instruction = Number of cycles an instruction stalled due to cache misses; Resident Pages <2 GB = the total number of user pages below 2 GB; Avlst <2G AvailFrms = Number of free frames available below 2 GB; Avlst <2G AvailFrms = Number of free frames available above 2 GB; LXA_SERV DASD Paging = Average number of user pages paged to paging space | |||
In the one-member SSI cluster measurement, the workload is limited by real memory.
Compared to the one-member SSI cluster, the throughput for the two-member and four-member SSI cluster increased by 18% and 32% respectively. The internal throughput increased by nearly the same amount. While the total processor utilization remained nearly 100% busy and the number of instructions per transaction remained nearly constant as the workload and resources were distributed across the SSI, the processor cycles/instruction decreased. The benefit is attributed to increased processor efficiency in small N-way configurations. The majority of the improvement was due to the LSPR ITR Ratios for IBM Processors as noted in the CPU-constrained Apache workload.
Part of the improvement is due to the two-member and four-member measurements using frames below 2 GB, thus the Linux servers were paging less in the two-member and four-member SSI cluster environments. With z/VM 6.2.0, a new memory managment algorithm was introduced to exclude the use of frames below 2 GB in certain memory configurations when it would be advantageous to do so. This was added to eliminate storage management searches for frames below 2 GB that severely impacted system performance. For more information on the storage management improvements, see Storage Management Improvements.
In the one-member SSI cluster measurement, resident frames below 2 GB is zero, while the available pages below 2 GB is 520000 pages. This is an indication CP is not and will not be using the frames below 2 GB. This factor should be taken into consideration when calculating memory over-commitment ratios.
Scaling a 1 TB Apache Workload Across a Four-Member SSI Cluster
Table 7 compares a 1 TB workload spread across a four-member SSI cluster.
Table 7. 1 TB Apache workload distributed across a four-member SSI cluster
| Number of Members | 1 | 2 | 4 |
| Run ID | A0T6A240 | A3T6A250 | A3T6A260 |
| Tx/sec (c) | 219.37 | 417.61 | 980.15 |
| Throughput ratio (c) | 1.00 | 1.90 | 4.47 |
| Total central storage | 256 GB | 512 GB | 1 TB |
| MDC XSTOR pages (p) | 0 | 905542 | 0 |
| Total Number of Processors | 3 | 6 | 12 |
| Total util/proc (p) | 100.0 | 100.0 | 99.6 |
| Note: (p) = Data taken from Performance Toolkit; (c) = Data was calculated; | |||
Compared to the one-member SSI cluster measurement, the throughput in the two-member measurement was 1.9 times higher. This was slightly lower than the expected 2.0 times due to XSTOR pages used for MDC in the two-member SSI cluster measurement. In the four-member SSI cluster measurement the throughput was more than 4.0 times higher than the one-member SSI cluster measurement. The benefit can be attributed to using a z196 for two of the four members.
Table 7.1 compares the throughput in each member of the 1 TB workload spread across a four-member SSI cluster.
Table 8. Throughput for 1 TB Apache workload distributed across a four-member SSI cluster
| Processor Model | z10 | z10 | z196 | z196 |
| Throughput ratio (c) | 1.00 | 1.00 | 1.34 | 1.33 |
| Note: (p) = Data has been calculated; | ||||
Previous performance measurements demonstrated a z10 to a z196 performance ratio varied from 1.36 to 1.89. Overall, the one-, two-, and four-member SSI cluster measurements scaled linearly up to 1 TB, as expected.
Effect of SSI State Changes
Table 8 studies SSI state changes Joined, Leaving, Down, and Joining.
Table 9. CPU-constrained Apache workload during SSI state transitions
| SSI state transitions | no | yes | |
| Run ID | A1NWA190 | A1NWA191 | |
| Tx/sec (c) | 982.30 | 980.90 | |
| Number of processors | 12 | 12 | |
| Total util/proc (p) | 99.3 | 100.0 | |
|
Note: Member 1: Running Apache Workload
Members 2, 3, and 4: Continuous SSI State Transitions: Joined, Leaving, Down, and Joining | |||
The base case is running a CPU-constrained workload on one member of a four-member SSI cluster. The other three members of the cluster are initially in a Joined state and idle. Thoughout the measurement, the three idle members were continuously shut down and re-IPLed. Compared to the base case, the throughput in the new measurement did not change. All twelve processors continued to run 100% busy. In our experiment, a workload running on one member is not influenced by the state transitions occurring in the other members of the cluster.
Table 9 studies SSI state changes Joined and Suspend/Unknown.
Table 10. CPU-constrained Apache workload during SSI state transitions
| SSI state transitions | no | yes | |
| Run ID | A1NWA190 | A0NWB080 | |
| Tx/sec (c) | 982.30 | 1021.79 | |
| Number of Processors | 12 | 12 | |
| Total util/proc (p) | 99.3 | 100.0 | |
|
Note: Member 1: Running Apache Workload
Member 1: Continuous SSI State Transitions: Joined and Unknown or Suspended | |||
The base case is running a CPU-constrained workload on one member of a four-member SSI cluster. The other three members of the cluster are in a Joined state and idle throughout the measurement. Compared to the base case, the throughput in the new measurement did not change significantly. All 12 processors continued to run 100% busy. Therefore, a workload running on one member is not influenced by the state transitions occurring in that member.
Summary and Conclusions
Overall, distributing resources and workloads across an SSI cluster does not influence workload performance.
Distributing a CPU-constrained workload across an SSI cluster improved the processor efficiency of the individual processors in each z/VM image. This allowed for more real work to get done.
In the virtual-I/O-constrained environment, compared to the one-member SSI cluster measurement, the two-member and four-member SSI cluster measurements increased the number of device exposures available to the workload. This increased the total virtual I/O rate, thus increasing the total workload throughput.
In the memory-constrained environment, a majority of the improvement was attained by improving individual processor efficency as the workload and resources were distributed across the members. Additionally, a new memory management algorithm caused CP not to use frames below 2 GB in the one-member SSI cluster measurement. The two-member and four-member SSI cluster measurements used frames below 2 GB and this provided a small advantage.
In the set of measurements that scaled up to 1 TB in an SSI environment, as workload and resources were added by member, the workload throughput increased linearly.
SSI state transitions do not influence workload performance running on individual members.
Back to Table of Contents.
ISFC Improvements
Abstract
In z/VM 6.2 IBM shipped improvements to the Inter-System Facility for Communication (ISFC). These improvements prepared ISFC to serve as the data conveyance for relocations of running guests.
Measurements of ISFC's capabilities for guest relocation traffic studied its ability to fill a FICON chpid's fiber with data and its ability to ramp up as the hardware configuration of the logical link expanded. These measurements generally showed that ISFC uses FICON chpids fully and scales correctly with increasing logical link capacity.
Because ISFC is also the data conveyance for APPC/VM, IBM also studied z/VM 6.2's handling of APPC/VM traffic compared back to z/VM 6.1, on logical link configurations z/VM 6.1 can support. This regression study showed that z/VM 6.2 experiences data rate changes in the range of -6% to +78%, with most cases showing substantial improvement. CPU utilization per message moved changed little.
Though IBM did little in z/VM 6.2 to let APPC/VM traffic exploit multi-CTC logical links, APPC/VM workloads did show modest gains in such configurations.
Introduction
In z/VM 6.2 IBM extended the Inter-System Facility for Communication (ISFC) so that it would have the data carrying capacity needed to support guest relocations. The most visible enhancement is that a logical link can now be composed of multiple CTCs. IBM also made many internal improvements to ISFC, to let it scale to the capacities required by guest relocations.
Though performing and measuring actual guest relocations is the ultimate test, we found it appropriate also to devise experiments to measure ISFC alone. Such experiments would let us assess certain basic ISFC success criteria, such as whether ISFC could fully use a maximally configured logical link, without wondering whether execution traits of guest relocations were partially responsible for the results observed. A second and more practical concern was that devising means to measure ISFC alone let us run experiments more flexibly, more simply, and with more precise control than we could have if we had had only guest relocations at our disposal as a measurement tool.
Because ISFC was so heavily revised, we also found it appropriate to run measurements to check performance for APPC/VM workloads. Our main experiment for APPC/VM was to check that a one-CTC logical link could carry as much traffic as the previous z/VM release. Our second experiment was to study the scaling behavior of APPC/VM traffic as we added hardware to the logical link. Because we made very few changes in the APPC/VM-specific portions of ISFC, and because we had no requirement to improve APPC/VM performance in z/VM 6.2, we ran this second experiment mostly out of curiosity.
This report chapter describes the findings of all of these measurements. The chapter also offers some insight into the inner workings of ISFC and provides some guidance on ISFC logical link capacity estimation.
Background
Early in the development of z/VM 6.2, IBM did some very simple measurements to help us to understand the characteristics of FICON CTC devices. These experiments' results guided the ISFC design and taught us about the configuring and capacity of multi-CTC ISFC logical links. This section does not cite these simple measurements' specific results. Rather, it merely summarizes their teachings.
Placement of CTCs onto FICON Chpids
When we think about the relationship between FICON CTC devices and FICON CTC chpids, we realize there are several different ways we could place a set of CTCs onto a set of chpids. For example, we could place sixteen CTCs onto sixteen chpids, one CTC on each chpid. Or, we could place sixteen CTCs all onto one chpid.
In very early measurements of multi-CTC ISFC logical links, IBM tried various experiments to determine how many CTCs to put onto a chpid before performance on that chpid no longer improved, for data exchange patterns that imitated what tended to happen during guest relocations. Generally we found that for the FICON Express2 and FICON Express4 chpids we tried, putting more than four to five CTC devices onto a FICON chpid did not result in any more data moving through the logical link. In fact, with high numbers of CTCs on a chpid, performance rolled off.
Though we do not cite the measurement data here, our recommendation is that customers generally run no more than four CTCs on each chpid. This provides good utilization of the fiber capacity and stays well away from problematic configurations.
For this reason, for our own measurements we used no more than four CTCs per FICON chpid.
Traffic Scheduling and Collision Avoidance
A CTC device is a point-to-point communication link connecting two systems. Data can move in either direction, but in only one direction at a time: either side A writes and side B then hears an attention interrupt and reads, or vice-versa. A write collision is what happens when two systems both try to write into a CTC device at the same instant. Neither side's write succeeds. Both sides must recover from the I/O error and try again to write the transmission package. These collisions degrade logical link performance.
When the logical link consists of more than one CTC, ISFC uses a write scheduling algorithm designed to push data over the logical link in a fashion that balances the need to use as many CTCs as possible with the need to stay out of the way of a partner who is trying to accomplish the very same thing.
To achieve this, the two systems agree on a common enumeration scheme for the CTCs comprising the link. The agreed-upon scheme is for both sides to number the CTCs according to the real device numbers that are in use on the system whose name comes first in the alphabet. For example, if systems ALPHA and BETA are connected by three CTCs, the two systems would agree to use ALPHA's device numbers to place the CTCs into an order on which they agree, because ALPHA comes before BETA in the alphabet.
The write scheduling scheme uses the agreed-upon ordering to avoid collisions. When ALPHA needs a CTC for writing, it scans the logical link's device list lowest to highest, looking for one on which an I/O is not in progress. System BETA does similarly, but it scans highest to lowest. When there are enough CTCs to handle the traffic, this scheme will generally avoid collisions. Further, when traffic is asymmetric, this scheme allows the heavily transmitting partner to take control of the majority of the CTCs.
The write scheduling technique also contains provision for one side never to take complete control of all of the CTCs. Rather, the scan always stops short of using the whole device list, as follows:
| Number of CTCs in Logical Link | Write Scheduling Stop-Short Behavior |
|---|---|
| 1-8 CTCs | Scan stops 1 short |
| 9-16 CTCs | Scan stops 2 short |
The stop-short provision guarantees each side that the first one or two devices in its scan will never incur a write collision.
The figure below illustrates the write scheduling scheme for the case of two systems named ATLANTA and BOSTON connected by eight CTCs. The device numbers for ATLANTA are the relevant ones, because ATLANTA alphabetizes ahead of BOSTON. The ATLANTA side scans lowest to highest, while the BOSTON side scans highest to lowest. Each side stops one short.
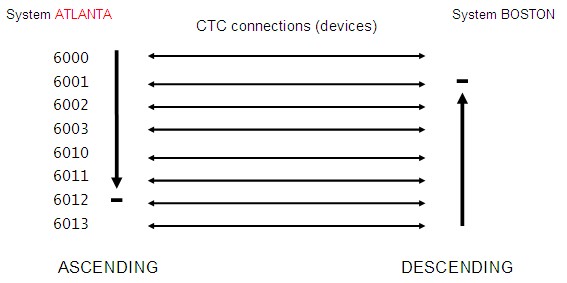
|
Understanding the write scheduling scheme is important to understanding CTC device utilization statistics. For example, in a heavily asymmetric workload running over a sixteen-CTC link, we would expect to see only fourteen of the devices really busy, because the last two aren't scanned. Further, in going from eight to ten RDEVs, each side's scan gains only one in depth, because for 10 RDEVs we stop two short instead of one.
Understanding the write scheduling scheme is also important if one must build up a logical link out of an assortment of FICON chpid speeds. Generally, customers will want the logical link to exhibit symmetric performance, that is, the link works as well relocating guests from ALPHA to BETA as it does from BETA to ALPHA. Achieving this means paying close attention to how the CTC device numbers are placed onto chpids on the ALPHA side. When there are a number of fast chpids and one or two slow ones, placing the faster chpids on the extremes of ALPHA's list and the slower chpids in the middle of ALPHA's list will give best results. This arrangement gives both ALPHA and BETA a chance to use fast chpids first and then resort to the slower chpids only when the fast CTCs are all busy. For similar reasons, if there is only one fast chpid and the rest are slow ones, put the fast chpid into the middle of ALPHA's device number sequence.
Because understanding the write scheduling scheme is so important, and because the write scheduling scheme is intimately related to device numbers, the QUERY ISLINK command shows the device numbers in use on both the issuer's side and on the partner's side. Here is an example; notice that for each CTC, the Remote link device clause tells what the device number is on the other end of the link:
Once again, remember that the only device numbers that are important in understanding write scheduling are the device numbers in use on the system whose name comes first in the alphabet.
Estimating the Capacity of an ISFC Logical Link
When we do capacity planning for an ISFC logical link, we usually think about wanting to estimate how well the link will do in servicing guest relocations. Guest relocation workloads' data exchange habits are very asymmetric, that is, they heavily stream data from source system to destination system and have a very light acknowledgement stream flowing in the other direction. Thus it makes sense to talk about estimating the one-way capacity of the logical link.
Roughly speaking, our early experiments revealed that a good rule of thumb for estimating the maximum one-way data rate achievable on a FICON ExpressN CTC chpid at the size of messages tended to be exchanged in a guest relocation is roughly to take the chpid fiber speed in megabits (Mb) per second, divide by 10, and then multiply by about 0.85. The resultant number is in units of megabytes per second, or MB/s. For example, a FICON Express4 chpid's fiber runs at 4 gigabits per second, or 4 Gb/s. The chpid's estimated maximal data carrying capacity in one direction in MB/s will tend to be about (4096 / 10 * 0.85) or about 350 MB/sec. Using this rough estimating technique, we can build the following table:
| FICON Adapter Generation | Rough Estimate of One-Way Capacity in Guest Relocation Workloads |
|---|---|
| FICON Express | 87 MB/sec |
| FICON Express2 | 175 MB/sec |
| FICON Express4 | 350 MB/sec |
| FICON Express8 | 700 MB/sec |
To estimate the maximum one-way capacity of an ISFC logical link, we just add up the capacities of the chpids, prorating downward for chpids using fewer than four CTCs.
As we form our estimate of the link's one-way capacity, we must also keep in mind the stop-short property of the write scheduling algorithm. For example, a logical link composed of twelve CTC devices spread evenly over three equal-speed chpids will really have only ten CTCs or about 2-1/2 chpids' worth of capacity available to it for streaming a relocation to the other side. Estimates of logical link capacity must take this into account.
For our particular measurement configuration, this basic approach to logical link capacity estimation gives us the following table for the estimated one-way capacity of this measurement suite's particular ISFC logical link hardware:
| Our CTC RDEVs | Total Number of CTCs | Max Number of CTCs Used in Streaming | Distribution over Chpids | Estimated One-Way Capacity (MB/sec) |
|---|---|---|---|---|
| 6000 | 1 | Less than 1 | Less than 1/4 of an Express2 | 20 |
| 6000-6003 | 4 | 3 | 3/4 of an Express2 | 131 |
| 6000-6003, 6020-6023 |
8 | 7 | 7/4 of an Express2 | 306 |
| 6000-6003, 6020-6023, 6040-6041 |
10 | 8 | 8/4 of an Express2 | 350 |
| 6000-6003, 6020-6023, 6040-6043 |
12 | 10 | 8/4 of an Express2 2/4 of an Express4 |
525 |
| 6000-6003, 6020-6023, 6040-6043, 6060-6061 |
14 | 12 | 8/4 of an Express2 4/4 of an Express4 |
700 |
| 6000-6003, 6020-6023, 6040-6043, 6060-6063 |
16 | 14 | 8/4 of an Express2 6/4 of an Express4 |
875 |
Customers using other logical link configurations will be able to use this basic technique to build their own estimation tables.
It was our experience that our actual measurements tended to do better than these estimates.
Of course, a set of FICON CTCs acting together will be able to service workloads moving appreciable data in both directions. However, because LGR workloads are not particularly symmetric, we did not comprehensively study the behavior of an ISFC logical link when each of the two systems tries to put appreciable transmit load onto the link. We did run one set of workloads that evaluated a moderate intensity, symmetric data exchange scenario. We did this mostly to check that the two systems could exchange data without significantly interfering with one another.
Method
To measure ISFC's behavior, we used the ISFC workloads described in the appendix of this report. The appendix describes the CECs used, the partition configurations, and the FICON chpids used to connect the partitions. This basic hardware setup remained constant through all measurements.
The appendix also describes the choices we made for the numbers of concurrent connections, the sizes of messages exchanged, and the numbers of CTCs comprising the logical link. We varied these choices through their respective spectra as described in the appendix.
A given measurement consisted of a selected number of connections, exchanging messages of a selected size, using an ISFC logical link of a selected configuration. For example, an APPC/VM measurement might consist of 50 client-server pairs running the CDU/CDR tool, using server reply size of 5000 bytes, running over an ISFC logical link that used only the first four CTC devices of our configuration.
We ran each experiment for five minutes, with CP Monitor set to one-minute sample intervals. We collected MONWRITE data on each side.
When all measurements were complete, we reduced the MONWRITE data with a combination of Performance Toolkit for VM and some homegrown Rexx execs that analyzed Monitor records directly.
Metrics of primary interest were data rate, CPU time per unit of data moved, and CTC device-busy percentage.
For multi-CTC logical links, we were also interested in whether ISFC succeeded in avoiding simultaneous writes into the two ends of a given CTC device. This phenomenon, called a write collision, can debilitate the logical link. ISFC contains logic to schedule CTC writes in such a way that the two systems will avoid these collisions almost all of the time. We looked at measurements' collision data to make sure the write scheduling logic worked properly.
Results and Discussion
ISFC Transport Traffic
For convenience of presentation, we organized the result tables by message size, one table per message size. The set of runs done for a specific message size is called a suite. Each suite's table presents its results. The row indices are the number of CTCs in the logical link. The column indices are the number of concurrent conversations.
Within a given suite we expected, and generally found, the following traits:
- With a given number of client-server pairs, adding CTCs would generally increase data rate until it peaked, and beyond that, adding even more CTCs would not appreciably harm the workload in data rate nor in CPU utilization per message.
- With a given number of CTCs, adding client-server pairs would generally increase the data rate until a peak, and beyond that, adding even more client-server pairs would not increase data rate.
- High write-collision rates for the one-CTC cases.
- Reduced write-collision rates for the multi-CTC cases.
We also expected to see that the larger the messages, the better ISFC would do at filling the pipe. We expected this because we knew that in making its ISFC design choices, IBM tended to use schemes, algorithms, and data structures that would favor high-volume traffic consisting of fairly large messages.
For the largest messages, we expected and generally found that ISFC would keep the write CTCs nearly 100% busy and would fill the logical link to fiber capacity.
Small Messages
| HS 512/8192, 20%, 2048 |
2011-10-14 | Pairs | ||||||||||||||||||||||||||||||||||
| RDEVs | Metrics | 1 | 5 | 10 | 50 | 100 | ||||||||||||||||||||||||||||||
| 1 |
|
|
|
|
|
|
||||||||||||||||||||||||||||||
| 4 |
|
|
|
|
|
|
||||||||||||||||||||||||||||||
| 8 |
|
|
|
|
|
|
||||||||||||||||||||||||||||||
| 10 |
|
|
|
|
|
|
||||||||||||||||||||||||||||||
| 12 |
|
|
|
|
|
|
||||||||||||||||||||||||||||||
| 14 |
|
|
|
|
|
|
||||||||||||||||||||||||||||||
| 16 |
|
|
|
|
|
|
||||||||||||||||||||||||||||||
| Notes: z10, 2097-E56, mci 754, two dedicated partitions, client 3-way, server 12-way, both 43G/2G. Mixed FICON: 6000-6003 2 Gb/s, 6020-6023 2 Gb/s, 6040-6043 4 Gb/s, 6060-6063 4 Gb/s. LGC/LGS workload driver. W0A13 of 2011-10-13, stand-in for W0GOLDEN. Data rate includes traffic in both directions. | ||||||||||||||||||||||||||||||||||||
Medium Messages
| HM 8192/32768, 20%, 4096 |
2011-10-14 | Pairs | ||||||||||||||||||||||||||||||||||
| RDEVs | Metrics | 1 | 5 | 10 | 50 | 100 | ||||||||||||||||||||||||||||||
| 1 |
|
|
|
|
|
|
||||||||||||||||||||||||||||||
| 4 |
|
|
|
|
|
|
||||||||||||||||||||||||||||||
| 8 |
|
|
|
|
|
|
||||||||||||||||||||||||||||||
| 10 |
|
|
|
|
|
|
||||||||||||||||||||||||||||||
| 12 |
|
|
|
|
|
|
||||||||||||||||||||||||||||||
| 14 |
|
|
|
|
|
|
||||||||||||||||||||||||||||||
| 16 |
|
|
|
|
|
|
||||||||||||||||||||||||||||||
| Notes: z10, 2097-E56, mci 754, two dedicated partitions, client 3-way, server 12-way, both 43G/2G. Mixed FICON: 6000-6003 2 Gb/s, 6020-6023 2 Gb/s, 6040-6043 4 Gb/s, 6060-6063 4 Gb/s. LGC/LGS workload driver. W0A13 of 2011-10-13, stand-in for W0GOLDEN. Data rate includes traffic in both directions. | ||||||||||||||||||||||||||||||||||||
Large (LGR-sized) Messages
| HL 98304/122880, 20%, 8192 |
2011-10-14 | Pairs | ||||||||||||||||||||||||||||||||||
| RDEVs | Metrics | 1 | 5 | 10 | 50 | 100 | ||||||||||||||||||||||||||||||
| 1 |
|
|
|
|
|
|
||||||||||||||||||||||||||||||
| 4 |
|
|
|
|
|
|
||||||||||||||||||||||||||||||
| 8 |
|
|
|
|
|
|
||||||||||||||||||||||||||||||
| 10 |
|
|
|
|
|
|
||||||||||||||||||||||||||||||
| 12 |
|
|
|
|
|
|
||||||||||||||||||||||||||||||
| 14 |
|
|
|
|
|
|
||||||||||||||||||||||||||||||
| 16 |
|
|
|
|
|
|
||||||||||||||||||||||||||||||
| Notes: z10, 2097-E56, mci 754, two dedicated partitions, client 3-way, server 12-way, both 43G/2G. Mixed FICON: 6000-6003 2 Gb/s, 6020-6023 2 Gb/s, 6040-6043 4 Gb/s, 6060-6063 4 Gb/s. LGC/LGS workload driver. W0A13 of 2011-10-13, stand-in for W0GOLDEN. Data rate includes traffic in both directions. | ||||||||||||||||||||||||||||||||||||
Symmetric 32 KB Traffic
| HY 32768/32768, 20%, 32768 |
2011-10-14 | Pairs | ||||||||||||||||||||||||||||||||||
| RDEVs | Metrics | 1 | 5 | 10 | 50 | 100 | ||||||||||||||||||||||||||||||
| 1 |
|
|
|
|
|
|
||||||||||||||||||||||||||||||
| 4 |
|
|
|
|
|
|
||||||||||||||||||||||||||||||
| 8 |
|
|
|
|
|
|
||||||||||||||||||||||||||||||
| 10 |
|
|
|
|
|
|
||||||||||||||||||||||||||||||
| 12 |
|
|
|
|
|
|
||||||||||||||||||||||||||||||
| 14 |
|
|
|
|
|
|
||||||||||||||||||||||||||||||
| 16 |
|
|
|
|
|
|
||||||||||||||||||||||||||||||
| Notes: z10, 2097-E56, mci 754, two dedicated partitions, client 3-way, server 12-way, both 43G/2G. Mixed FICON: 6000-6003 2 Gb/s, 6020-6023 2 Gb/s, 6040-6043 4 Gb/s, 6060-6063 4 Gb/s. LGC/LGS workload driver. W0A13 of 2011-10-13, stand-in for W0GOLDEN. Data rate includes traffic in both directions. | ||||||||||||||||||||||||||||||||||||
One Measurement In Detail
So as to illustrate what really happens on an ISFC logical link, let's take a look at one experiment in more detail.
The experiment we will choose is H001709C. This is a large-message experiment using 50 concurrent conversations and 12 CTCs in the logical link. Devices 6000-6003 and 6020-6023 are FICON Express2. Devices 6040-6043 are FICON Express4. Devices 6060-6063 are in the IOCDS but are unused in this particular experiment.
Here's a massaged excerpt from the Performance Toolkit FCX108 DEVICE report, showing the device utilization on the client side. It's evident that the client is keeping ten CTCs busy in pushing the traffic to the server. This is consistent with the CTC write scheduling algorithm. It's also evident that devices 6040-6043 are on a faster chpid. Finally, we see that the server is using device 6043 to send the comparatively light acknowledgement traffic back to the client. Device 6042 is very seldom used, and from our knowledge of the write scheduling algorithm, we know it carries only acknowledgement traffic.
A homegrown tool predating Performance Toolkit for VM's ISFLACT report shows us a good view of the logical link performance from the client side. The tool uses the D9 R4 MRISFNOD logical link activity records to report on logical link statistics. The tool output excerpt below shows all of the following:
- The client's transmission-pending queue is not severely deep.
- No write collisions are happening.
- The link is carrying about 660 MB/sec to the server.
- Each client-to-server link package, written with one SSCH, carries about seven API messages totalling about 829,000 bytes.
- The link is carrying about 46 MB/sec to the client.
- Each server-to-client link package, also written with one SSCH, carries about 25 API messages totalling about 205,000 bytes.
APPC/VM Regression
For these measurements our objective was to compare z/VM 6.2 to z/VM 6.1, using an ISFC logical link of one CTC, with a variety of message sizes and client-server pairs. We measured server replies per second and CPU utilization per reply. The tables below show the results.
Generally z/VM 6.2 showed substantial improvements in server replies per second. A few anomalies were observed. Generally z/VM 6.2 showed small percentage gains in CPU consumption per message moved. These gains are not alarming because the CDU/CDR suite spends almost no CPU time in the guests. In customer environments, guest CPU time will be substantial and so small changes in CP CPU time will likely be negligible.
Runs 60* are z/VM 6.1 driver 61TOP908, which is z/VM 6.1 plus all corrective service as of September 8, 2010.
Runs W0* are z/VM 6.2 driver W0A13, which is z/VM 6.2 as of October 13, 2011.
| Reply size 1 | |||
| Pairs | Run name | Msgs/sec | %CPU/Msg |
| 1 | 6000899S | 1113.84 | 0.0040 |
| 1 | W000934S | 1421.68 | 0.0039 |
| - | Delta | 307.84 | -0.0001 |
| - | PctDelta | 27.64 | -2.50 |
| 5 | 6000906S | 2347.28 | 0.0029 |
| 5 | W000941S | 3342.56 | 0.0031 |
| - | Delta | 995.28 | 0.0002 |
| - | PctDelta | 42.40 | 6.90 |
| 10 | 6000913S | 4305.60 | 0.0026 |
| 10 | W000948S | 6066.32 | 0.0027 |
| - | Delta | 1760.72 | 0.0001 |
| - | PctDelta | 40.89 | 3.85 |
| 50 | 6000920S | 8557.12 | 0.0024 |
| 50 | W000955S | 11596.0 | 0.0025 |
| - | Delta | 3038.88 | 0.0001 |
| - | PctDelta | 35.51 | 4.17 |
| 100 | 6000927S | 8344.96 | 0.0024 |
| 100 | W000962S | 12771.2 | 0.0025 |
| - | Delta | 4426.24 | 0.0001 |
| - | PctDelta | 53.04 | 4.17 |
| Notes: z10, 2097-E56, mci 754, two partitions, one 3-way and one 12-way, both 43G/2G. One FICON CTC on a 2 Gb/s chpid. CDR/CDU workload driver. 61TOP908 of 2010-09-08. W0A13 of 2011-10-13, stand-in for W0GOLDEN. Message rate is replies sent from server to client. Statistics collected on server side. | |||
| Reply size 1000 | |||
| Pairs | Run name | Msgs/sec | %CPU/Msg |
| 1 | 6000900S | 1110.72 | 0.0040 |
| 1 | W000935S | 1398.80 | 0.0040 |
| - | Delta | 288.08 | 0 |
| - | PctDelta | 25.94 | 0.00 |
| 5 | 6000907S | 2322.32 | 0.0029 |
| 5 | W000942S | 3149.12 | 0.0032 |
| - | Delta | 826.80 | 0.0003 |
| - | PctDelta | 35.60 | 10.34 |
| 10 | 6000914S | 4308.72 | 0.0026 |
| 10 | W000949S | 5676.32 | 0.0028 |
| - | Delta | 1367.60 | 0.0002 |
| - | PctDelta | 31.74 | 7.69 |
| 50 | 6000921S | 8426.08 | 0.0024 |
| 50 | W000956S | 8410.48 | 0.0026 |
| - | Delta | -15.60 | 0.0002 |
| - | PctDelta | -0.19 | 8.33 |
| 100 | 6000928S | 8309.60 | 0.0024 |
| 100 | W000963S | 8712.08 | 0.0026 |
| - | Delta | 402.48 | 0.0002 |
| - | PctDelta | 4.84 | 8.33 |
| Notes: z10, 2097-E56, mci 754, two partitions, one 3-way and one 12-way, both 43G/2G. One FICON CTC on a 2 Gb/s chpid. CDR/CDU workload driver. 61TOP908 of 2010-09-08. W0A13 of 2011-10-13, stand-in for W0GOLDEN. Message rate is replies sent from server to client. Statistics collected on server side. | |||
| Reply size 5000 | |||
| Pairs | Run name | Msgs/sec | %CPU/Msg |
| 1 | 6000901S | 1025.232 | 0.0043 |
| 1 | W000936S | 1294.80 | 0.0043 |
| - | Delta | 269.568 | 0 |
| - | PctDelta | 26.29 | 0.00 |
| 5 | 6000908S | 2110.16 | 0.0032 |
| 5 | W000943S | 2422.16 | 0.0035 |
| - | Delta | 312.00 | 0.0003 |
| - | PctDelta | 14.79 | 9.38 |
| 10 | 6000915S | 3546.40 | 0.0029 |
| 10 | W000950S | 4291.04 | 0.0031 |
| - | Delta | 744.64 | 0.0002 |
| - | PctDelta | 21.00 | 6.90 |
| 50 | 6000922S | 5315.44 | 0.0028 |
| 50 | W000957S | 6494.80 | 0.0029 |
| - | Delta | 1179.36 | 0.0001 |
| - | PctDelta | 22.19 | 3.57 |
| 100 | 6000929S | 5441.28 | 0.0028 |
| 100 | W000964S | 5150.08 | 0.0032 |
| - | Delta | -291.20 | 0.0004 |
| - | PctDelta | -5.35 | 14.29 |
| Notes: z10, 2097-E56, mci 754, two partitions, one 3-way and one 12-way, both 43G/2G. One FICON CTC on a 2 Gb/s chpid. CDR/CDU workload driver. 61TOP908 of 2010-09-08. W0A13 of 2011-10-13, stand-in for W0GOLDEN. Statistics collected on server side. | |||
| Reply size 10000 | |||
| Pairs | Run name | Msgs/sec | %CPU/Msg |
| 1 | 6000902S | 973.128 | 0.0045 |
| 1 | W000937S | 1214.72 | 0.0049 |
| - | Delta | 241.592 | 0.0004 |
| - | PctDelta | 24.83 | 8.89 |
| 5 | 6000909S | 1901.12 | 0.0036 |
| 5 | W000944S | 2280.72 | 0.0039 |
| - | Delta | 379.60 | 0.0003 |
| - | PctDelta | 19.97 | 8.33 |
| 10 | 6000916S | 3176.16 | 0.0033 |
| 10 | W000951S | 3895.84 | 0.0033 |
| - | Delta | 719.68 | 0 |
| - | PctDelta | 22.66 | 0.00 |
| 50 | 6000923S | 2714.40 | 0.0034 |
| 50 | W000958S | 3255.20 | 0.0034 |
| - | Delta | 540.80 | 0 |
| - | PctDelta | 19.92 | 0.00 |
| 100 | 6000930S | 3548.48 | 0.0042 |
| 100 | W000965S | 3947.84 | 0.0042 |
| - | Delta | 399.36 | 0 |
| - | PctDelta | 11.25 | 0.00 |
| Notes: z10, 2097-E56, mci 754, two partitions, one 3-way and one 12-way, both 43G/2G. One FICON CTC on a 2 Gb/s chpid. CDR/CDU workload driver. 61TOP908 of 2010-09-08. W0A13 of 2011-10-13, stand-in for W0GOLDEN. Message rate is replies sent from server to client. Statistics collected on server side. | |||
| Reply size 50000 | |||
| Pairs | Run name | Msgs/sec | %CPU/Msg |
| 1 | 6000903S | 559.936 | 0.0086 |
| 1 | W000938S | 524.576 | 0.0092 |
| - | Delta | -35.360 | 0.0006 |
| - | PctDelta | -6.32 | 6.98 |
| 5 | 6000910S | 843.232 | 0.0076 |
| 5 | W000945S | 1023.464 | 0.0070 |
| - | Delta | 180.232 | -0.0006 |
| - | PctDelta | 21.37 | -7.89 |
| 10 | 6000917S | 996.216 | 0.0072 |
| 10 | W000952S | 1491.36 | 0.0064 |
| - | Delta | 495.144 | -0.0008 |
| - | PctDelta | 49.70 | -11.11 |
| 50 | 6000924S | 694.304 | 0.0127 |
| 50 | W000959S | 1219.92 | 0.0125 |
| - | Delta | 525.616 | -0.0002 |
| - | PctDelta | 75.70 | -1.57 |
| 100 | 6000931S | 908.856 | 0.0141 |
| 100 | W000966S | 1536.08 | 0.0133 |
| - | Delta | 627.224 | -0.0008 |
| - | PctDelta | 69.01 | -5.67 |
| Notes: z10, 2097-E56, mci 754, two partitions, one 3-way and one 12-way, both 43G/2G. One FICON CTC on a 2 Gb/s chpid. CDR/CDU workload driver. W0A13 of 2011-10-13, stand-in for W0GOLDEN. Message rate is replies sent from server to client. Statistics collected on server side. | |||
| Reply size 100000 | |||
| Pairs | Run name | Msgs/sec | %CPU/Msg |
| 1 | 6000904S | 343.408 | 0.0140 |
| 1 | W000939S | 342.784 | 0.0140 |
| - | Delta | -0.624 | 0 |
| - | PctDelta | -0.18 | 0.00 |
| 5 | 6000911S | 495.768 | 0.0121 |
| 5 | W000946S | 674.336 | 0.0113 |
| - | Delta | 178.568 | -0.0008 |
| - | PctDelta | 36.02 | -6.61 |
| 10 | 6000918S | 308.880 | 0.0142 |
| 10 | W000953S | 386.360 | 0.0145 |
| - | Delta | 77.480 | 0.0003 |
| - | PctDelta | 25.08 | 2.11 |
| 50 | 6000925S | 402.480 | 0.0239 |
| 50 | W000960S | 678.184 | 0.0230 |
| - | Delta | 275.704 | -0.0009 |
| - | PctDelta | 68.50 | -3.77 |
| 100 | 6000932S | 497.328 | 0.0265 |
| 100 | W000967S | 862.056 | 0.0251 |
| - | Delta | 364.728 | -0.0014 |
| - | PctDelta | 73.34 | -5.28 |
| Notes: z10, 2097-E56, mci 754, two partitions, one 3-way and one 12-way, both 43G/2G. One FICON CTC on a 2 Gb/s chpid. CDR/CDU workload driver. 61TOP908 of 2010-09-08. W0A13 of 2011-10-13, stand-in for W0GOLDEN. Message rate is replies sent from server to client. Statistics collected on server side. | |||
| Reply size 1000000 | |||
| Pairs | Run name | Msgs/sec | %CPU/Msg |
| 1 | 6000905S | 39.936 | 0.1202 |
| 1 | W000940S | 40.248 | 0.1193 |
| - | Delta | 0.312 | -0.0009 |
| - | PctDelta | 0.78 | -0.75 |
| 5 | 6000912S | 55.328 | 0.1084 |
| 5 | W000947S | 84.344 | 0.0948 |
| - | Delta | 29.016 | -0.0136 |
| - | PctDelta | 52.44 | -12.55 |
| 10 | 6000919S | 28.184 | 0.1703 |
| 10 | W000954S | 42.848 | 0.1494 |
| - | Delta | 14.664 | -0.0209 |
| - | PctDelta | 52.03 | -12.27 |
| 50 | 6000926S | 46.904 | 0.2558 |
| 50 | W000961S | 77.584 | 0.2526 |
| - | Delta | 30.680 | -0.0032 |
| - | PctDelta | 65.41 | -1.25 |
| 100 | 6000933S | 55.744 | 0.2727 |
| 100 | W000968S | 99.216 | 0.2661 |
| - | Delta | 43.472 | -0.0066 |
| - | PctDelta | 77.99 | -2.42 |
| Notes: z10, 2097-E56, mci 754, two partitions, one 3-way and one 12-way, both 43G/2G. One FICON CTC on a 2 Gb/s chpid. CDR/CDU workload driver. 61TOP908 of 2010-09-08. W0A13 of 2011-10-13, stand-in for W0GOLDEN. Message rate is replies sent from server to client. Statistics collected on server side. | |||
APPC/VM Scaling
When IBM improved ISFC for z/VM 6.2, its objective was to create a data transport service suitable for use in relocating guests. Low-level ISFC drivers were rewritten to pack messages well, to use multiple CTCs, and the like. Further, new higher layers of ISFC were created so as to offer a new data exchange API to other parts of the Control Program.
As part of the ISFC effort, IBM made little to no effort to improve APPC/VM performance per se. For example, locking and serialization limits known to exist in the APPC/VM-specific portions of ISFC were not relieved.
Because of this, IBM expected some APPC/VM scaling for multi-CTC logical links, but the behavior was expected to be modest at best. Mostly out of curiosity, we ran the CDU/CDR workloads on a variety of multi-CTC logical links, to see what would happen.
We found APPC/VM traffic did scale, but not as well as ISFC Transport traffic did. For example, the largest-configuration APPC/VM measurement, W001054C, achieved [ (1000000 * 199.78) / 1024 / 1024 ] = 190 MB/sec in reply messages from server to client over our sixteen-RDEV setup. By contrast, the largest-configuration ISFC Transport measurement, H001750C, achieved 964 MB/sec client-to-server (not tabulated) on the very same logical link.
The tables below capture the results.
| Reply size 1 | Pairs | |||
| RDEVs | Metrics | 1 | 50 | 100 |
| 1 | Run Msgs/sec %CPU/msg RDEV util |
W000995C 1414.0 0.0040 60.00 |
W000999C 11356.2 0.0021 48.00 |
W001003C 12615.2 0.0022 46.00 |
| 4 | Run Msgs/sec %CPU/msg RDEV util |
W001007C 1412.0 0.0037 60.00 |
W001011C 28890.0 0.0019 127.00 |
W001015C 45905.6 0.0019 158.00 |
| 8 | Run Msgs/sec %CPU/msg RDEV util |
W001019C 1413.0 0.0037 45.00 |
W001023C 29160.0 0.0019 114.00 |
W001027C 45697.6 0.0019 122.00 |
| 12 | Run Msgs/sec %CPU/msg RDEV util |
W001031C 1458.5 0.0038 46.00 |
W001035C 30655.8 0.0019 120.00 |
W001039C 42130.4 0.0019 121.00 |
| 16 | Run Msgs/sec %CPU/msg RDEV util |
W001043C 1435.0 0.0045 45.00 |
W001047C 30078.0 0.0021 118.00 |
W001051C 41787.2 0.0019 119.00 |
| Notes: z10, 2097-E56, mci 754, two partitions, one 3-way and one 12-way, both 43G/2G. FICON CTCs as in appendix. CDR/CDU workload driver. W0A13 of 2011-10-13, stand-in for W0GOLDEN. Message rate is replies sent from server to client. Statistics from client side. | ||||
| Reply size 10000 | Pairs | |||
| RDEVs | Metrics | 1 | 50 | 100 |
| 1 | Run Msgs/sec %CPU/msg RDEV util |
W000998C 40.485 0.1383 47.00 |
W001002C 74.790 0.1872 46.00 |
W001006C 97.760 0.1800 55.00 |
| 4 | Run Msgs/sec %CPU/msg RDEV util |
W001010C 40.285 0.1390 66.00 |
W001014C 92.178 0.2300 109.00 |
W001018C 156.416 0.2276 204.00 |
| 8 | Run Msgs/sec %CPU/msg RDEV util |
W001022C 40.985 0.1464 67.00 |
W001026C 91.638 0.2357 120.00 |
W001030C 162.968 0.2454 216.00 |
| 12 | Run Msgs/sec %CPU/msg RDEV util |
W001034C 46.185 0.1386 54.00 |
W001038C 119.286 0.2247 84.00 |
W001042C 195.000 0.2338 156.00 |
| 16 | Run Msgs/sec %CPU/msg RDEV util |
W001046C 45.565 0.1492 54.00 |
W001050C 121.608 0.2270 83.00 |
W001054C 199.784 0.2483 160.00 |
| Notes: z10, 2097-E56, mci 754, two partitions, one 3-way and one 12-way, both 43G/2G. FICON CTCs as in appendix. CDR/CDU workload driver. W0A13 of 2011-10-13, stand-in for W0GOLDEN. Message rate is replies sent from server to client. Statistics from client side. | ||||
| Reply size 100000 | Pairs | |||
| RDEVs | Metrics | 1 | 50 | 100 |
| 1 | Run Msgs/sec %CPU/msg RDEV util |
W000997C 342.70 0.0163 49.00 |
W001001C 698.76 0.0166 47.00 |
W001005C 860.184 0.0167 62.00 |
| 4 | Run Msgs/sec %CPU/msg RDEV util |
W001009C 342.75 0.0163 66.00 |
W001013C 957.42 0.0188 108.00 |
W001017C 1466.40 0.0199 195.00 |
| 8 | Run Msgs/sec %CPU/msg RDEV util |
W001021C 348.50 0.0161 50.00 |
W001025C 971.46 0.0202 122.00 |
W001029C 1607.84 0.0214 219.00 |
| 12 | Run Msgs/sec %CPU/msg RDEV util |
W001033C 386.80 0.0165 54.00 |
W001037C 1084.32 0.0196 77.00 |
W001041C 1806.48 0.0210 146.00 |
| 16 | Run Msgs/sec %CPU/msg RDEV util |
W001045C 379.65 0.0179 54.00 |
W001049C 1085.94 0.0195 76.00 |
W001053C 1799.20 0.0205 142.00 |
| Notes: z10, 2097-E56, mci 754, two partitions, one 3-way and one 12-way, both 43G/2G. FICON CTCs as in appendix. CDR/CDU workload driver. W0A13 of 2011-10-13, stand-in for W0GOLDEN. Message rate is replies sent from server to client. Statistics from client side. | ||||
| Reply size 1000000 | Pairs | |||
| RDEVs | Metrics | 1 | 50 | 100 |
| 1 | Run Msgs/sec %CPU/msg RDEV util |
W000998C 40.485 0.1383 47.00 |
W001002C 74.790 0.1872 46.00 |
W001006C 97.760 0.1800 55.00 |
| 4 | Run Msgs/sec %CPU/msg RDEV util |
W001010C 40.285 0.1390 66.00 |
W001014C 92.178 0.2300 109.00 |
W001018C 156.416 0.2276 204.00 |
| 8 | Run Msgs/sec %CPU/msg RDEV util |
W001022C 40.985 0.1464 67.00 |
W001026C 91.638 0.2357 120.00 |
W001030C 162.968 0.2454 216.00 |
| 12 | Run Msgs/sec %CPU/msg RDEV util |
W001034C 46.185 0.1386 54.00 |
W001038C 119.286 0.2247 84.00 |
W001042C 195.000 0.2338 156.00 |
| 16 | Run Msgs/sec %CPU/msg RDEV util |
W001046C 45.565 0.1492 54.00 |
W001050C 121.608 0.2270 83.00 |
W001054C 199.784 0.2483 160.00 |
| Notes: z10, 2097-E56, mci 754, two partitions, one 3-way and one 12-way, both 43G/2G. FICON CTCs as in appendix. CDR/CDU workload driver. W0A13 of 2011-10-13, stand-in for W0GOLDEN. Message rate is replies sent from server to client. Statistics from client side. | ||||
Why APPC/VM Traffic Doesn't Scale
The reason APPC/VM traffic achieves only modest gains on a multi-CTC logical link is fairly easy to see if we look at an FCX108 DEVICE excerpt from the server side. Run W001054C was the largest APPC/VM scaling measurement we tried: server replies 1000000 bytes long, 100 client-server pairs, and a sixteen-CTC logical link. Here is the FCX108 DEVICE excerpt from the server's MONWRITE data. The server, the sender of the large messages in this experiment, is later in the alphabet, so it starts its CTC scan from the bottom of the list and works upward.
The server is making use of more than one CTC, but it is not nearly making use of all of the CTCs. This is not much of a surprise. The APPC/VM protocol layer of ISFC is known to be heavily serialized.
Contrast the APPC/VM device utilization picture with the one from large ISFC Transport workload H001750C. Remember that in the ISFC Transport workload, the client, the sender of the large messages, is earlier in the alphabet, so it starts its scan from the top and works downward.
This comparison clearly shows the payoff in having built the ISFC Transport API not to serialize. The client side is doing a good job of keeping its fourteen transmit CTCs significantly busy.
Summary and Conclusions
For traffic using the new ISFC Transport API with message sizes approximating those used in relocations, ISFC fully uses FICON fiber capacity and scales correctly as FICON chpids are added to the logical link.
For APPC/VM regression traffic, z/VM 6.2 offers improvement in data rate compared to z/VM 6.1. Message rate increases of as high as 78% were observed.
APPC/VM traffic can flow over a multi-CTC logical link, but rates compared to a single-CTC link are only modestly better.
Back to Table of Contents.
Storage Management Improvements
Abstract
z/VM 6.2 provides several storage management serialization and search enhancements. Some of these enhancements are available through the service stream on previous releases.
These enhancements help only those workloads that were adversely affected by the particular search or serialization. Therefore, they do not provide uniform benefit to all workloads. However, none of the enhancements cause any significant regression to any measured workload.
Of all the enhancements, VM64774 SET/QUERY REORDER is the only one that introduces any new or changed externals. Our tips article Reorder Processing contains a description and guidelines for using the new SET REORDER and QUERY REORDER commands.
Introduction
This article addresses several serialization issues within the z/VM storage management subsystem that can result in long delays for an application or excessive use of processor cycles by the z/VM Control Program. These serializations generally involve spinning while waiting on a lock or searching a long list for a rare item. They all can cause long application delays or apparent system hangs.
VM64715 changed page release serialization to reduce exclusive lock holding time. This reduces long delays during page release. Applications most affected by this generally involved address space creations and deletions.
VM64795 and VM65032 changed the page release function to combine all contiguous frames as pages are released. This reduces long delays while the system is searching for contiguous frames.
z/VM 6.2 eliminates elective use of below-2-GB storage in certain configurations or environments when doing so would not harm the workload. This reduces long delays incurred while the system is searching for a below-2-GB frame.
VM64774 introduced the command CP SET REORDER OFF to suppress the page reorder function. This lets the system administrator reduce long delays during reorders of guests having large numbers of resident pages.
Monitor records D0 R3 MRSYTRSG Real Storage Data (Global) and D3 R1 MRSTORSG Real Storage Management (Global) have been updated. For more information see our data areas and control blocks page.
Background
Identifying Potential Search Conditions
Performance Toolkit for VM can be used to identify certain conditions that might cause an application delay due to long searches.
Here is an example (run ALSWA041) of the Performance Toolkit MDCSTOR screen showing 412 MDC pages below 2GB, 1066000 MDC pages above 2GB, and a non-zero steal rate. This illustrates a system that is exposed to long searches in trying to recover below-2-GB frames from MDC.
FCX178   MDCSTOR
         Minidisk Cache Storage Usage, by Time
________________________________________

           <---------- Main Storage Frames
 Interval   <--Actual--->     Steal
 End Time     <2GB   >2GB  Invokd/s
 >>Mean>>      412  1066k     3.353
Here is an example (run ST6E9086) of the Performance Toolkit UPAGE screen showing a user with 38719 pages below 2 GB, 3146000 pages above 2 GB, and a non-zero steal rate. This illustrates a system that is exposed to long searches in trying to recover below-2-GB frames from a user.
FCX113  Run 2011/10/17 13:49:50         UPAGE
                                        User Paging Activity
_____________________________________________________________

             Page     <-Resident-> <--Locked-->
 Userid    Steals     R<2GB  R>2GB L<2GB  L>2GB  XSTOR   DASD
 CMS00007    3253     38719  3146k     0      0      0  1257k
Here is an example (run ST6E9086) of the Performance Toolkit PROCLOG screen showing percent system time of 36.3%. High system utilization is another indicator of system serialization or searching.
FCX144  PROCLOG
        Processor Activity, by Time

                  <------ Percent Busy -->
           C
 Interval  P
 End Time  U Type Total  User  Syst  Emul

   Mean    . CP    40.1   3.7  36.3   1.6
Method
The VM64715 page release serialization change to reduce exclusive lock holding time was evaluated using a specialized workload to create and destroy address spaces.
The VM64795 and VM65032 function to combine all contiguous frames as pages are released was evaluated using a specialized storage-fragmenting workload.
The z/VM 6.2 change to eliminate elective use of below-2-GB storage in some situations was evaluated using Virtual Storage Exerciser Tool and Apache to create specialized workloads that would exercise known serialization and search conditions.
Table 1 contains the configuration parameters for the Virtual Storage Exerciser Tool.
Table 1. Configuration parameters for the Virtual Storage Exerciser Tool
| Characteristic | Value |
| Real memory | 120 GB |
| Xstor | 0 GB |
| Processors | 4 |
| Guests | 8 |
| Guest virtual memory | 128 GB |
| Guest virtual processors | 3 |
Table 2 contains the configuration parameters for the Apache workload.
Table 2. Configuration parameters for non-paging Apache workload
| Characteristic | Value |
| Real memory | 64 GB |
| Xstor | 2 GB |
| Processors | 3 |
| Number of clients / virtual processors | 3 / 1 |
| Number of servers / virtual processors | 6 / 1 |
| Number of HTML files | 10,000 |
|
Note: * Includes clients and servers
Pre-measurement setup included prereading so as to place the static HTML files into the server Linux file cache | |
Results and Discussion
Page Serialization Enhancements
The specialized workload to evaluate the page serialization enhancements does not have any specific throughput metrics. Its only measure of success is less wait time and higher utilization for the application.
Contiguous Frame Coalesce
The specialized workload to evaluate contiguous frame coalesce at page release does not have any specific throughput metrics. However, system utilization decreased more than 50% and virtual utilization increased more than 300%.
No MDC Pages Below 2GB
Table 3 contains results for an Apache workload. Eliminating below-2-GB usage for MDC reduced system utilization 91% and provided an 18% improvement in throughput.
| Metric | ALSWA041 | ALSWA040 | Delta | Pct |
| CP level (p) | 6.1 | 6.2 | ||
| Tx/sec (c) | 215.73 | 255.53 | 39.80 | 18.4 |
| System util/proc (p) | 9.9 | 0.8 | -9.1 | -91.9 |
| MDC < 2GB real pages (p) | 412 | 0 | -412 | -100.0 |
| Resident pages < 2G (p) | 517686 | 52 | -517634 | -100.0 |
| Emul util/proc (p) | 60.8 | 69.3 | 8.5 | 14.0 |
| Total util/proc (p) | 99.7 | 100.0 | 0.3 | 0.3 |
|
Note: (p) = Data taken from Performance Toolkit; (c) = Data has been calculated; System Util/Proc = System utilization per processor; MDC < 2GB Real Pages = Number of MDC pages below 2 GB; Resident pages < 2GB = Number of resident pages below 2 GB; Emul Util/Proc = Guest utilization per processor; Total Util/Proc= Total utilization per processor | ||||
Here is an example (run ALSWA040) of the Performance Toolkit MDCSTOR screen showing 0 MDC pages below 2GB, 450436 MDC pages above 2GB, and a non-zero steal rate.
FCX178  MDCSTOR
        Minidisk Cache Storage Usage, by Time

           <Main Storage Frames >
 Interval   <--Actual--->      Steal
 End Time     <2GB   >2GB   Invokd/s
 >>Mean>>        0 450436      1.078
Here is an example (run ALSWA040) of the Performance Toolkit PROCLOG screen showing percent system time of 0.7%. Low system utilization is another indicator of elimination of serialization or searching. Not using pages below 2 GB reduced system utilization 91% for this workload.
FCX144  PROCLOG
        Processor Activity, by Time

             <------ Percent Busy ------->
           C
 Interval  P
 End Time  U Type Total  User  Syst  Emul
 >>Mean>>  . CP    99.9  99.2    .7  69.3
No User Pages Below 2 GB
Table 4 contains results for a Virtual Storage Exerciser Tool measurement. Eliminating below-2-GB usage for user pages reduced system utilization 81% and provided a 117% improvement in throughput.
| Metric | ST6E9086 | STWEA033 | Delta | Pct |
| CP level (p) | 6.1 | 6.2 | ||
| STTHRU1 million page rate | 0.2362 | 0.5130 | 0.2768 | 117.2 |
| Resident pages < 2GB (p) | 516000 | 48 | -515952 | -100.0 |
| System util/proc (p) | 36.4 | 6.6 | -29.8 | -81.9 |
| Emul util/proc (p) | 1.6 | 2.8 | 1.2 | 75.0 |
| Total util/proc (p) | 40.2 | 12.3 | -27.9 | -69.4 |
|
Note: (p) = Data taken from Performance Toolkit; STTHRU1 Million Page Rate = Rate pages are accessed by the virtual store application; Resident pages <2GB = Number of resident pages below 2 GB; System Util/Proc = System utilization per processor; Emul Util/Proc = Guest utilization per processor; Total Util/Proc= Total utilization per processor | ||||
Here is an example (run STWEA033) of the Performance Toolkit UPAGE screen showing no users have any pages below 2 GB despite having more than 100000 pages on DASD. Not using pages below 2 GB reduced system utilization 81% for this workload.
FCX113  UPAGE
        User Paging Activity and Storage Utilization

                     <--- Number of Pages ----------------->
             Page    <-Resident-> <--Locked-->
 Userid    Steals    R<2GB  R>2GB L<2GB  L>2GB  XSTOR   DASD
 CMS00001    1330        0  3785k     0      0      0 947591
 CMS00002    2100        0  3765k     0      0      0  1536k
 CMS00003    3180        0  3295k     0      0      0  2116k
 CMS00004    1632        0  4142k     0      0      0 186615
 CMS00005    4454        0  2818k     0      0      0  1653k
 CMS00006    1558        0  3922k     0      0      0  1240k
 CMS00007    3228        0  2776k     0      0      0  2617k
 CMS00008    1173        0  4113k     0      0      0 619279
SET REORDER OFF
Reorder Processing contains results for using the SET REORDER OFF command.
Summary and Conclusions
These enhancements provided a large improvement for specific situations but do not provide a general benefit to all workloads and configurations.
The page release serialization change reduced application long delays for specialized workloads that involved address space creates and destroys.
The function to combine all contiguous frames as pages are released reduced long delays in specialized storage fragmenting workloads.
Eliminating elective usage of below-2-GB storage when doing so would not harm the workload reduced application long delays for a variety of workloads.
The SET REORDER command lets a user bypass application long delays caused by reorder processing.
The most visible change to users will be that in some situations the system will no longer use below-2-GB frames to hold pageable data.
Back to Table of Contents.
High Performance FICON
Abstract
The IBM System z platform introduced High Performance FICON (zHPF) which uses a new I/O channel program format referred to as transport-mode I/O. Transport-mode I/O requires less overhead between the channel subsystem and the FICON adapter than traditional command-mode I/O requires. As a result of lower overhead, transport-mode I/Os complete faster than command-mode I/Os do, resulting in higher I/O rates and less CPU overhead.In our experiments transport-mode I/Os averaged a 35% increase in I/O rate, an 18% decrease in service time per I/O, and a 45% to 75% decrease in %CP-CPU per I/O. %CP-CPU per I/O changed based on I/O size and did not vary a lot. We believe service time per I/O and I/O rate vary a lot due to the external interference induced by our shared environment.
Introduction
zHPF was introduced to improve the execution performance of FICON channel programs. zHPF achieves a performance improvement using a new channel program format that reduces the handshake overhead (fetching and decoding commands) between the channel subsystem and the FICON adapter. This is particularly beneficial for small block transfers.
z/VM 6.2 plus VM65041 lets a guest operating system use transport-mode I/O provided the channel and control unit support it. For more information about the z/VM support, see our z/VM 6.2 recent enhancements page.
To evaluate the benefit of transport-mode I/O we ran a variety of I/O-bound workloads, varying read-write mix, volume concurrency, and I/O size, running each combination with command-mode I/O and again with transport-mode I/O. To illustrate the benefit, we collected and tabulated key I/O performance metrics.
Method
IO3390 Workload
Our exerciser IO3390 is a CMS application that uses Start Subchannel (SSCH) to perform random I/Os to a partial-pack minidisk, full-pack minidisk, or dedicated disk formatted at 4 KB block size. The random block numbers are drawn from a uniform distribution [0..size_of_disk-1]. For more information about IO3390, refer to its appendix.For partial-pack minidisks and full-pack minidisks we organized the IO3390 machines' disks onto real volumes so that as we logged on additional virtual machines, we added load to the real volumes equally. For example, with eight virtual machines running, we had one IO3390 instance assigned to each real volume. With sixteen virtual machines we had two IO3390s per real volume. Using this scheme, we ran 1, 3, 5, 7, and 10 IO3390s per volume with 83-cylinder partial-pack and full-pack minidisks. For dedicated disk we ran 1 IO3390 per volume.
For each combination of number of IO3390s, we tried four different I/O mixes: 0% reads, 33% reads, 67% reads, and 100% reads.
For each I/O mix we varied the number of records per I/O: 1 record per I/O, 4 records per I/O, 16 records per I/O, 32 records per I/O, and 64 records per I/O.
We ran each configuration with command-mode I/O and again with transport-mode I/O.
The IO3390 agents are CMS virtual uniprocessor machines with 24 MB of storage.
System Configuration
Processor: 2097-E64, model-capacity indicator 742, 30G central, 2G XSTORE, four dedicated processors. Thirty-four 3390-3 paging volumes.
IBM TotalStorage DS8800 (2421-931) DASD: 6 GB cache, four 8 Gb FICON chpids leading to a FICON switch, then four 8 Gb FICON chpids from the switch to the DS8800. Twenty-four 3390-3 volumes in a single LSS, eight for partial-pack minidisk, eight for full-pack minidisks, and eight for dedicated disks.
We ran all measurements with z/VM 6.2.0 plus APAR VM65041, with CP SET MDCACHE SYSTEM OFF in effect.
Metrics
For each experiment, we measured I/O rate, I/O service time, percent busy per volume, and %CP-CPU per I/O.I/O rate is the rate at which I/Os are completing at a volume. As long as the size of the I/Os remains constant, using a different type of I/O to achieve a higher I/O rate for a volume is a performance improvement, because we move more data each second.
I/O service time is the amount of time it takes for the DASD subsystem to perform the requested operation, once the host system starts the I/O. Factors influencing I/O service time include channel speed, load on the DASD subsystem, amount of data being moved in the I/O, whether the I/O is a read or a write, and the presence or availability of cache memory in the controller, just to name a few.
Volume percent busy is the percentage of time during which the device was busy. It is calculated by taking the count of I/Os in a time interval times the average service time per I/O divided by the time period times 100.
Percent CP-CPU per I/O is CP CPU utilization divided by I/O rate.
We ran each configuration for five minutes, with CP Monitor set to emit sample records at one-minute intervals.
Results and Discussion
For our measurements, when we removed the outliers we believe were caused by our shared environment, transport-mode I/O averaged a 35% increase in I/O rate, an 18% decrease in service time per I/O, and a 45% to 75% decrease in %CP-CPU per I/O. %CP-CPU per I/O changed based on I/O size and did not vary a lot when I/O size was held constant. Service time per I/O and I/O rate varied a lot. We believe this is due to external interference induced by our shared environment.
In doing our analysis we discovered that some small amount of time is apparently missing from the service time accumulators for command-mode I/O. This causes service time per I/O to report as smaller than it really is and thereby prevents the percent-busy calculation from ever reaching 100%.
As records per I/O increased the %CP-CPU used per I/O delta between command-mode and transport-mode increased. Transport-mode I/O scaled more efficiently as I/O sizes got larger.
I/O device type did not have an influence on results.
Introducing transport-mode I/O support did not cause any regression to the performance of command-mode I/O.
In the following table we show a comparison of command-mode I/O to transport-mode I/O. This measurement was done with dedicated disks and 1 4 KB record per I/O. We varied the percent of I/Os that were reads. These results show the benefit that we received from using transport-mode I/O.
| Transport-mode I/O vs. command-mode I/O, 0% reads, 1 record per I/O | |||||
| Guests/vol | Run Name | I/Os/vol/sec | Serv/I/O (msec) | %Busy/vol | %CP-CPU/I/O |
|
1 |
JB001218 (c) JB001219 (t) Delta %Delta |
3373.4 4499.1 1125.7 33.37 |
0.2525 0.2038 -0.0487 -19.29 |
85.1740 91.6766 6.5026 7.63 |
0.00156 0.00090 -0.00067 -42.74 |
| Notes: (c) denotes command-mode I/O. (t) denotes transport-mode I/O. | |||||
| Transport-mode I/O vs. command-mode I/O, 33% reads, 1 record per I/O | |||||
| Guests/vol | Run Name | I/Os/vol/sec | Serv/I/O (msec) | %Busy/vol | %CP-CPU/I/O |
|
1 |
JB001228 (c) JB001229 (t) Delta %Delta |
3455.8 4663.8 1208.0 34.96 |
0.2447 0.1962 -0.0485 -19.82 |
84.5469 91.4839 6.9370 8.20 |
0.00156 0.00089 -0.00066 -42.61 |
| Notes: (c) denotes command-mode I/O. (t) denotes transport-mode I/O. | |||||
| Transport-mode I/O vs. command-mode I/O, 67% reads, 1 record per I/O | |||||
| Guests/vol | Run Name | I/Os/vol/sec | Serv/I/O (msec) | %Busy/vol | %CP-CPU/I/O |
|
1 |
JB001238 (c) JB001239 (t) Delta %Delta |
3605.1 4914.6 1309.5 36.32 |
0.2326 0.1855 -0.0471 -20.25 |
83.8508 91.1570 7.3062 8.71 |
0.00156 0.00090 -0.00066 -42.33 |
| Notes: (c) denotes command-mode I/O. (t) denotes transport-mode I/O. | |||||
| Transport-mode I/O vs. command-mode I/O, 100% reads, 1 record per I/O | |||||
| Guests/vol | Run Name | I/Os/vol/sec | Serv/I/O (msec) | %Busy/vol | %CP-CPU/I/O |
|
1 |
JB001248 (c) JB001249 (t) Delta %Delta |
3728.1 5225.0 1496.9 40.15 |
0.2240 0.1739 -0.0501 -22.37 |
83.5212 90.8752 7.3540 8.80 |
0.00157 0.00091 -0.00066 -42.23 |
| Notes: (c) denotes command-mode I/O. (t) denotes transport-mode I/O. | |||||
As we increased I/O size we saw the delta between command-mode I/O and transport-mode I/O increase for %CP-CPU per I/O. Transport-mode was more beneficial for workloads with larger I/Os than it was for workloads with smaller I/Os. The following table shows a larger delta in %CP-CPU per I/O, demonstrating the benefit that large I/Os got from transport-mode I/O.
| Transport-mode I/O vs. command-mode I/O, 0% reads, 64 records per I/O | |||||
| Guests/vol | Run Name | I/Os/vol/sec | Serv/I/O (msec) | %Busy/vol | %CP-CPU/I/O |
|
1 |
JB001226 (c) JB001227 (t) Delta %Delta |
310.1 428.0 117.9 38.02 |
3.0893 2.2957 -0.7936 -25.69 |
95.8157 98.2642 2.4485 2.56 |
0.00975 0.00246 -0.00729 -74.76 |
| Notes: (c) denotes command-mode I/O. (t) denotes transport-mode I/O. | |||||
| Transport-mode I/O vs. command-mode I/O, 33% reads, 64 records per I/O | |||||
| Guests/vol | Run Name | I/Os/vol/sec | Serv/I/O (msec) | %Busy/vol | %CP-CPU/I/O |
|
1 |
JB001236 (c) JB001237 (t) Delta %Delta |
328.2 463.5 135.3 41.22 |
2.9120 2.1183 -0.7937 -27.26 |
95.5772 98.1808 2.6036 2.72 |
0.00972 0.00243 -0.00729 -74.96 |
| Notes: (c) denotes command-mode I/O. (t) denotes transport-mode I/O. | |||||
| Transport-mode I/O vs. command-mode I/O, 67% reads, 64 records per I/O | |||||
| Guests/vol | Run Name | I/Os/vol/sec | Serv/I/O (msec) | %Busy/vol | %CP-CPU/I/O |
|
1 |
JB001246 (c) JB001247 (t) Delta %Delta |
359.4 554.4 195.0 54.26 |
2.6454 1.7660 -0.8794 -33.24 |
95.0844 97.9029 2.8185 2.96 |
0.00976 0.00242 -0.00734 -75.17 |
| Notes: (c) denotes command-mode I/O. (t) denotes transport-mode I/O. | |||||
| Transport-mode I/O vs. command-mode I/O, 100% reads, 64 records per I/O | |||||
| Guests/vol | Run Name | I/Os/vol/sec | Serv/I/O (msec) | %Busy/vol | %CP-CPU/I/O |
|
1 |
JB001256 (c) JB001257 (t) Delta %Delta |
388.8 700.1 311.3 80.07 |
2.4330 1.3924 -1.0406 -42.77 |
94.6053 97.4776 2.8723 3.04 |
0.00988 0.00241 -0.00747 -75.65 |
| Notes: (c) denotes command-mode I/O. (t) denotes transport-mode I/O. | |||||
Summary and Conclusions
For our workloads transport-mode I/Os averaged a 35% increase in I/O rate, an 18% decrease in service time per I/O, and a 45% to 75% decrease in %CP-CPU per I/O. This is because transport-mode I/O is less complex than command-mode I/O.Workloads that do large I/Os benefit the most from transport-mode I/O.
Back to Table of Contents.
z/VM Version 5 Release 4
The following sections discuss the performance characteristics of z/VM 5.4 and the results of the z/VM 5.4 performance evaluation.
Back to Table of Contents.
Summary of Key Findings
This section summarizes key z/VM 5.4 performance items and contains links that take the reader to more detailed information about each one.
Further, our performance improvements article gives information about other performance enhancements in z/VM 5.4.
For descriptions of other performance-related changes, see the performance considerations and performance management sections.
To compare performance of z/VM 5.4 to z/VM 5.3, IBM ran a variety of workloads on the two systems. For the base case, IBM used z/VM 5.3 plus all Control Program (CP) PTFs available as of November 1, 2007. This was the first CP that had a fully functional CMMA. For the comparison case, IBM used z/VM 5.4 plus the GA (aka first) RSU.
Regression measurements comparing these two z/VM levels showed nearly identical results for most workloads. Variation was less than 5% even for workloads that may have received some benefit from z/VM 5.4 performance improvements.
Some workloads with MDC active experience a reduction in transaction rate and increased system time caused by excessive attempts to steal MDC page frames. The reader can find more information in our MDC discussion.
Key Performance Improvements
z/VM 5.4 contains the following enhancements that offer significant performance improvements compared to previous z/VM releases:
Dynamic Memory Upgrade: z/VM 5.4 allows real storage to be increased dynamically by bringing designated amounts of standby storage online. Further, guests supporting the dynamic storage reconfiguration architecture can increase or decrease their storage sizes without taking a guest IPL. On system configurations with identical storage sizes, workload behaviors are nearly identical whether the storage was all available at IPL or was achieved by bringing storage online dynamically. When storage is added to a VM system that is paging, transitions in the paging subsystem are apparent in the CP monitor data and Performance Toolkit data and match the expected workload characteristics.
Specialty Engine Enhancements: z/VM 5.4 provides support for the new z/VM-mode logical partition available on the z10 processor. A partition of this mode can include zAAPs (IBM System z10 Application Assist Processors), zIIPs (IBM System z10 Integrated Information Processors), IFLs (Integrated Facility for Linux processors), and ICFs (Internal Coupling Facility processors), in addition to general purpose CPs (central processors). Guests can be correspondingly configured. On system configurations where the CPs and specialty engines are the same speed, performance results are similar whether virtual specialty engines are dispatched on real specialty engines or simulated on CPs. On system configurations where the specialty engines are faster than CPs, performance results are better when using the faster specialty engines and scale correctly based on the relative processor speed.
DCSS Above 2 GB: In z/VM 5.4, the utility of Discontiguous Saved Segments (DCSSs) is improved. DCSSs can now be defined in storage up to 512 GB, and so more DCSSs can be mapped into each guest. New Linux support takes advantage of this to build a large block device out of several contiguously-defined DCSSs. Compared to sharing read-only files via DASD or via Minidisk Cache (MDC), sharing such files via XIP in DCSS offers reductions in storage and CPU utilization. In the workloads measured for this report, reductions of up to 67% in storage consumption and 11% in CPU utilization were observed.
TCP/IP Layer 2 Exploitation: In z/VM 5.4, the TCP/IP stack can operate an OSA-Express adapter in Ethernet mode (data link layer, aka layer 2, of the OSI model). Data is transported and delivered in Ethernet frames, providing the ability to handle protocol-independent traffic. Measurements comparing Ethernet-mode operation to the corresponding IP-mode setup show an increase in throughput from 0% to 13%, a decrease in CPU time from 0% to 7% for a low-utilization OSA card, and a decrease from 0% to 3% in a fully utilized OSA card.
Other Functional Enhancements
z/VM 5.4 contains these additional enhancements which, though not developed specifically for performance reasons, IBM felt it appropriate to evaluate for this report.
Telnet IPv6: In z/VM 5.4, the TCP/IP stack provides a Telnet server and client capable of operating over an Internet Protocol Version 6 (IPv6) connection. This support includes new versions of the Pascal application programming interfaces (APIs) that let Telnet establish IPv6 connections. Regression measurements showed that compared to z/VM 5.3 IPv4 Telnet, z/VM 5.4 IPv4 Telnet showed -8% to +3% changes in throughput and 3% to 4% increases in CPU utilization. New-function measurements showed that compared to z/VM 5.4 IPv4 Telnet, z/VM 5.4 IPv6 Telnet showed increases from 12% to 23% in throughput and decreases in CPU utilization from 3% to 13%.
CMS-Based SSL Server: In z/VM 5.4 IBM rewrote the SSL server so that the server runs in a CMS machine instead of in a Linux machine. Regression measurements showed that compared to the Linux implementation, the CMS implementation costs more CPU to create a new connection and to send data on a connection, especially as the number of concurrent connections grows large. Measurements of new function showed that the cost to create a new connection increases with key length. Said measurements also showed that high cipher mode is more efficient than medium cipher mode, because in high cipher mode the server exploits the CP Assist for Cryptographic Function (CPACF).
Back to Table of Contents.
Changes That Affect Performance
This chapter contains descriptions of various changes in z/VM 5.4 that affect performance. It is divided into three sections -- Performance Improvements, Performance Considerations, and Performance Management.
Back to Table of Contents.
Performance Improvements
In Summary of Key Findings, this report gives capsule summaries of the major performance items Dynamic Memory Upgrade, Specialty Engine Enhancements, DCSS Above 2 GB, and TCP/IP Ethernet Mode. The reader can refer to the key findings chapter or to the individual enhancements' chapters for more information on these major items.
z/VM 5.4 also contains several additional enhancements meant to help performance. The remainder of this article describes these additional items.
Additional Performance Items
Guest DAT tables: In z/VM 5.4, DAT segment and region tables that map guest address spaces, known collectively as upper DAT tables, can now reside either above or below the 2 GB real bar. This work was done to relieve constraints encountered in looking for real frames to hold such tables. The constraints come from the idea that each of these tables can be several pages long. The System z hardware requires each such table to be placed on contiguous real storage frames. Finding contiguous free frames below the 2 GB bar can be difficult compared to finding contiguous frames anywhere in central storage, especially in some workloads. Though IBM made no specific measurements to quantitate the performance improvements attributable to this enhancement, we feel mentioning the work in this report is appropriate.
CMM-VMRM safety net: VM Resource Manager (VMRM) tracks the z/VM system's storage contention situation and uses the Cooperative Memory Management (CMM) API into Linux as needed, to ask the Linux guests to give up storage when constraints surface. In our VMRM-CMM and CMMA article, we illustrated the throughput improvements certain workloads achieve when VMRM manages storage in this way.
As originally shipped, VMRM had no lower bound beyond which it would refrain from asking Linux guests to give up memory. In some workloads, Linux guests that had already given up all the storage they could give used excessive CPU time trying to find even more storage to give up, leaving little CPU time available for useful work. In z/VM 5.4, VMRM has been changed so that it will not ask a Linux guest to shrink below 64 MB. This was the minimum recommended virtual machine size for SuSE and RedHat at the time the work was done. This VMRM change is in the base of z/VM 5.4 and is orderable for z/VM 5.2 and z/VM 5.3 via APAR VM64439.
In a short epilogue to our VMRM-CMM article, we discuss the effect of the safety net on one workload of continuing interest.
Virtual CPU share redistribution: In z/VM 5.3 and earlier, CPU share setting was always divided equally among all of the nondedicated virtual processors of a guest, even if some of those nondedicated virtual CPUs were in stopped state. In z/VM 5.4, this is changed. As VCPUs start and stop, the Control Program redistributes share, so that stopped VCPUs do not "take their share with them", so to speak. Another way to say this is that a guest's share is now divided equally among all of its nondedicated, nonstopped virtual CPUs. CP Monitor emits records when this happens, so that reduction programs or real-time monitoring programs can learn of the changes.
Linux on System z provides a daemon (cpuplugd) that automatically starts and stops virtual processors based on virtual processor utilization and workload characteristics, thereby exploiting z/VM V5.4 share redistribution. The cpuplugd daemon is available with SUSE Linux Enterprise Server (SLES) 10 SP2. IBM is working with its Linux distributor partners to provide this function in other Linux on System z distributions.
Large MDC environments: In z/VM 5.3 and earlier, if MDC is permitted to grow to its maximum of 8 GB, it stops doing MDC inserts. Over time, the cached data can become stale, thereby decreasing MDC effectiveness. z/VM 5.4 repairs this.
Push-through stack: Students of the z/VM Control Program are aware that a primary means for moving work through the system is to enqueue and dequeue work descriptors, called CP Task Execution Blocks (CPEBKs), on VMDBKs. Work of system-wide importance is often accomplished by enqueueing and dequeueing CPEBKs on two special system-owned VMDBKs called SYSTEM and SYSTEMMP.
In studies of z/VM 5.3 and earlier releases, IBM found that in environments requiring intense CPEBK queueing on SYSTEM and SYSTEMMP, the dequeue pass was too complex and was inducing unnecessary CP overhead. In z/VM 5.4 IBM changed the algorithm so as to reduce the overhead needed to select the correct block to dequeue. IBM did make measurements of purpose-built, pathological workloads designed to put large stress on SYSTEM and SYSTEMMP, so as to validate that the new technique held up where the old one failed. We are aware of no customer workloads that approach these pathological loads' characteristics. However, customers who run heavy paging, large multiprocessor configurations might notice some slight reduction in T/V ratio.
Virtual CTC: On z/VM 5.3, VCTC-intensive workloads with buffer transfer sizes greater than 32 KB could experience performance degradation under some conditions. On workloads where we evaluated the fix, we saw throughput improvements of 7% to 9%.
VSWITCH improvements: z/VM now dispatches certain VSWITCH interrupt work on the SYSTEMMP VMDBK rather than on SYSTEM. This helps reduce serialization for heavily-loaded VSWITCHes. Further, the Control Program now suppresses certain VSWITCH load balance computations for underutilized link aggregation port groups. This reduces VSWITCH management overhead for cases where link aggregation calculations need not be performed. Also, z/VM 5.4 increases certain packet queueing limits, to reduce the likelihood of packet loss on heavily loaded VSWITCHes. Finally, CP's error recovery for stalled VSWITCH QDIO queues is now more aggressive and thus more thorough.
Contiguous available list management: In certain storage-constrained workloads, the internal constants that set the low-threshold and high-threshold values for the contiguous-frame available lists were found to be too far apart, causing excessive PGMBK stealing and guest page thrashing. The constants were moved closer together, in accordance with performance improvements seen on certain experimental storage-constrained Linux workloads.
Back to Table of Contents.
Performance Considerations
Depending on environment or workload, some customers may wish to give special consideration to these items. Some of them have potential for negative performance impact.
Specialty Engines: Getting It Right
With the z10 processor and z/VM 5.4, customers can now combine many different engine types into a single partition. Further, customers can create virtual configurations that mimic the hardware's flexibility. Our Specialty Engines Enhancements article describes the performance attributes of this new support.
Depending on the environment, customers will want to keep in mind certain traits of the new mixed-engine capabilities. In this brief discussion we attempt to lay out some of the fine points.
One consideration is that virtual CPU type and the setting of SET CPUAFFINITY can make a big difference in performance and utilization of the system. Consider a partition with CPs and IFLs, with Linux guests defined with virtual IFLs. If SET CPUAFFINITY is off, the Control Program will not dispatch those virtual IFLs on those real IFLs. The real IFLs will remain idle and thus some processing capacity of the partition will be lost. Similarly, if SET CPUAFFINITY is on, those virtual IFLs will be dispatched only on those real IFLs. If enough real IFLs are not present to handle the virtual IFL computational load, wait queues will form, even though the partition's real CPs might be underutilized.
Consider also the case of the customer having combined two partitions, one all-IFL and one all-CP, into one partition. The all-IFL partition was hosting Linux work, while the all-CP partition was hosting z/OS guests. In the merged configuration, if the customer fails to change the Linux guests' virtual CPU types to IFL, z/VM will not dispatch those guests' virtual engines on the real IFLs in the new partition. Here again, attention to detail is required to make sure the partition performs according to expectation.
CP share is another area where attention is required. Share setting is per-virtual-CPU type. A guest with mixed virtual engines will have a share setting for each type. In tinkering with guests' shares, customers must be careful to adjust the share for the intended VCPU type.
Finally, on certain machines, real specialty engines are faster than real general-purpose CPs. Incorrectly setting CPUAFFINITY or incorrectly defining guest virtual CPUs could result in decreased throughput, even if the real engines in use are not overcommitted.
The new z10 and z/VM mixed-engine support gives customers opportunity to run diverse workloads in a single z10 partition. To use the partition well, though, the customer must pay careful attention to the configuration he creates, to ensure his virtual environment is well matched to the partition's hardware.
Virtual CPU Share Redistribution
In z/VM 5.4, the Control Program redistributes share for stopped virtual CPUs to still-running ones. For example, if a virtual four-way guest with relative share 200 is operating with two stopped virtual CPUs, the two remaining running ones will compete for real CPU as if they each had relative share 100.
IBM is aware that some customers do occasionally stop their guests' virtual CPUs and compensate for the stopped engines by issuing CP SET SHARE. Some customers even have automation that does this. In migrating to z/VM 5.4, such customers will want to revisit their automation and make adjustments as appropriate.
IBM has changed CP Monitor so that several records now include records of the share changes CP makes automatically for stopped virtual CPUs. Our performance management article describes the changed records.
Linux Install from HMC
When running on a z10, z/VM 5.4 can offer the HMC DVD drive as the source volume for a Linux installation. Both SUSE and RedHat distributions support installing from the HMC DVD.
IBM built this support so that customers could install Linux into a z/VM guest without having to acquire and set up an external LAN server to contain the Linux distribution DVD.
Customers need to be aware that though this support is functional, it does not perform as well as mounting the DVD on a conventional LAN server. In informal measurements, and depending on which distribution is being installed, IBM found the installation can be 11 to 12 times slower when using the HMC DVD, compared to mounting the DVD in an external LAN server. Installation times as long as three hours were observed.
Customers wanting to use this function will want to apply the PTF for APAR PK69228 before proceeding. This PTF, available on the GA RSU, does help performance somewhat, especially for RedHat installations.
Crypto Changes
APAR VM64440 to z/VM 5.2 and z/VM 5.3 changes z/VM's polling interval for cryptographic hardware to be in line with the speeds of modern cryptographic coprocessors. This change is in the base for z/VM 5.4.
MDC Changes
APAR VM64082 to z/VM 5.2 and 5.3 changes the behavior of the MDC storage arbiter. Recall the arbiter's job is to determine how to proportion storage between guest frames and MDC. This APAR, rolled into the z/VM 5.4 base, is not on any z/VM 5.2 or 5.3 RSU.
In some environments, notably large storage environments, the change helps prevent the arbiter from affording too much favor to MDC. Another way to say this is that the change helps keep the arbiter from over-biasing toward MDC.
In other environments, this change can cause the arbiter to bias against MDC too heavily, in other words, not afford MDC enough storage.
A customer can determine whether MDC is biased correctly by examining the FCX103 STORAGE report and looking at the system's MDC hit rate. Another way to examine hit rate is to look at the FCX108 DEVICE report and check the "Avoid" I/O rate for volumes holding minidisks of interest. To see how much storage MDC is using, the customer can check FCX138 MDCACHE or FCX178 MDCSTOR. If MDC hit rates seem insufficient or if MDC seems otherwise unbalanced, the customer can use the SET MDC command to establish manual settings for MDC's lower storage bound, upper storage bound, or bias value.
Absent VM64082, z/VM 5.2 and z/VM 5.3 also tended to retain excess frames in MDC even though the system was short on storage. As well as changing the arbiter, VM64082 changed MDC steal processing, to help MDC give up storage when the available lists were low. On z/VM 5.2, the VM64082 steal changes work correctly. However, on z/VM 5.3 and z/VM 5.4, the VM64082 change fails to assess the available frame lists correctly. Consequently, MDC, incorrectly believing free storage is heavily depleted, routinely dumps its frames back onto the available lists, even though there's plenty of storage available. This increases system CPU time, diminishes MDC effectiveness, and ultimately reduces application transaction rate. The problem is exacerbated in systems that tend to have large numbers of contiguous free storage frames, while systems that page heavily are less likely to be affected by the defect. A solution to this, for both z/VM 5.3 and z/VM 5.4, is available in APAR VM64510.
DMU Monitor Records
The Dynamic Memory Upgrade enhancement produces CP Monitor records that describe memory configuration changes. In particular, CP is supposed to emit the Memory Configuration Change record (MRMTRMCC, D1 R21) whenever it notices that standby or reserved storage has changed. Several different stimuli can cause CP to emit MRMTRMCC. However, because of a defect, CP fails to emit MRMTRMCC when an issued CP SET STORAGE command changes the standby or reserved values. APAR VM64483 corrects this.
VMRM Limitations
VM Resource Manager (VMRM) attempts to manage CPU access according to CPU velocity goals for groups of virtual machines. It does so by manipulating guests' CP SHARE settings according to actual usage reported by CP Monitor.
Ever since the introduction of mixed-engine support in z/VM 5.3, VMRM has been subject to incorrect operation in certain mixed-engine environments. In particular, VMRM has the following limitations which can cause problems depending on the system configuration:
- VMRM adds up share values for all virtual processors in the virtual machine, instead of adding the shares into buckets according to virtual CPU type.
- VMRM does not account for CPU affinity as established by the CP SET CPUAFFINITY command.
- VMRM does not account for stopped virtual CPUs.
Because of these limitations, IBM believes VMRM will work correctly only if the following configuration constraints are observed:
- The z/VM partition must consist either entirely of real CPs or real IFLs, and also,
- Each guest's virtual processors must either be all virtual CPs or all virtual IFLs, and also,
- None of a guest's virtual CPUs can be stopped.
IBM understands the importance of VMRM in mixed-engine environments such as those offered by the z10 and z/VM 5.4. Work continues in this area.
Performance APARs
Since z/VM 5.3 GA, IBM has made available several PTFs to improve z/VM's performance. Remember to keep abreast of performance APARs to see if any apply to your environment.
Large VM Systems
This was first listed as a consideration for z/VM 5.2 and is repeated here. Because of the CP storage management improvements in z/VM 5.2 and z/VM 5.3, it becomes practical to configure VM systems that use large amounts of real storage. When that is done, however, we recommend a gradual, staged approach with careful monitoring of system performance to guard against the possibility of the system encountering other limiting factors.
With the exception of the potential PGMBK constraint, all of the specific considerations listed for z/VM 5.2 continue to apply.
Back to Table of Contents.
Performance Management
These changes affect the performance management of z/VM:
- Monitor Changes
- Command and Output Changes
- Effects on Accounting and Performance Data
- Performance Toolkit for VM Changes
Monitor Changes
Several z/VM 5.4 enhancements affect CP monitor data. There are four new monitor records and several changed records. The detailed monitor record layouts are found on our control blocks page.
z/VM 5.4 supports the z10 processor's z/VM-mode partition. (Read our specialty engines update for more information.) To accomodate the new processor types, the share settings for each type of processor, and the LPAR mode, this support updated the following monitor records:
| Monitor Record | Record Name |
|---|---|
| Domain 0 Record 1 | System Data (per processor) |
| Domain 0 Record 2 | Processor Data (per processor) |
| Domain 0 Record 4 | Real Storage Data (per processor) |
| Domain 0 Record 5 | Expanded Storage Data (per processor) |
| Domain 0 Record 11 | Processor Communication Activities (per processor) |
| Domain 0 Record 12 | User Wait States |
| Domain 0 Record 13 | Scheduler Activity (per processor) |
| Domain 0 Record 15 | Logical CPU Utilization Data (global) |
| Domain 0 Record 22 | System Execution Space (per processor) |
| Domain 0 Record 24 | Scheduler Activity (per processor type) |
| Domain 1 Record 4 | System Configuration Data |
| Domain 1 Record 5 | Processor Configuration (per processor) |
| Domain 1 Record 15 | Logged on Users |
| Domain 2 Record 4 | Add User to Dispatch List |
| Domain 2 Record 5 | Drop User from Dispatch List |
| Domain 2 Record 6 | Add User to Eligible List |
| Domain 2 Record 9 | SET SHARE Changes |
| Domain 3 Record 2 | Real Storage Activity (per processor) |
| Domain 3 Record 20 | System Execution Space (per processor) |
| Domain 4 Record 1 | User Logon Data |
| Domain 4 Record 2 | User Logoff Data |
| Domain 4 Record 3 | User Activity Data |
| Domain 4 Record 4 | User Interaction Data |
| Domain 4 Record 5 | DEFINE CPU |
| Domain 4 Record 6 | DETACH CPU |
| Domain 4 Record 7 | DEFINE CPU n AS |
| Domain 4 Record 8 | User Transaction End |
| Domain 4 Record 9 | User Activity Data at Transaction End |
| Domain 4 Record 10 | User Interaction Data at Transaction End |
| Domain 5 Record 1 | Vary On Processor |
| Domain 5 Record 3 | Processor Data (per processor) |
In z/VM 5.4, virtual CPU share redistribution support was added to ensure share is redistributed among the virtual processors whenever a virtual processor is started or stopped. To indicate whether a virtual processor is stopped and to report on the number of times it has started or stopped, this support updated the following monitor records:
| Monitor Record | Record Name |
|---|---|
| Domain 1 Record 15 | Logged-On Users |
| Domain 4 Record 3 | User Activity Data |
| Domain 4 Record 4 | User Interaction Data |
| Domain 4 Record 9 | User Activity Data at Transaction End |
z/VM 5.4 provides the capability to increase the size of z/VM's memory (online real storage) by bringing designated amounts of standby storage online. No system re-IPL is required. To report on the amounts of central, standby, and reserved storage, and to report on when these amounts change, this support added or changed the following monitor records:
| Monitor Record | Record Name |
|---|---|
| Domain 1 Record 21 (new) | Memory Configuration Change |
| Domain 3 Record 21 (new) | Add Central Storage |
| Domain 1 Record 7 | User Interaction Data |
z/VM 5.4 exploits the multiple ports available in the OSA-Express 3 network adapters. To report on the OSA-Express port number, this support changed the following monitor records:
| Monitor Record | Record Name |
|---|---|
| Domain 6 Record 21 | Virtual Switch Activity |
| Domain 6 Record 22 | Virtual Switch Failover |
| Domain 6 Record 23 | Virtual Switch Recovery |
To provide additional debug information for system and performance problems, z/VM 5.4 added or changed these monitor records:
| Monitor Record | Record Name |
|---|---|
| Domain 2 Record 13 (new) | Add VMDBK to the Limit List |
| Domain 2 Record 14 (new) | Drop VMDBK from the Limit List |
| Domain 0 Record 10 | Scheduler Activity (Global) |
| Domain 0 Record 14 | Expanded Storage Data (Global) |
| Domain 0 Record 19 | System Data (Global) |
| Domain 0 Record 20 | Extended Channel Measurement Data (Per Channel) |
| Domain 3 Record 9 | Expanded Storage Data |
| Domain 8 Record 1 | Virtual NIC Session Activity |
The z/VM TCP/IP APPLDATA record TCP/IP Link Definition Record - Type X'08' - Configuration Data was updated with the transport type.
With the PTF for APAR PK65850, z/VM 5.4 provides an SSL server that operates in a CMS environment, rather than requiring a Linux distribution. SSL Server APPLDATA Monitor Records were added for this support. See Appendix H, "SSL Server Monitor Records" in z/VM Performance (SC24-6109-05).
Command and Output Changes
This section cites new or changed commands or command outputs that are relevant to the task of performance management. The section does not give syntax diagrams, sample command outputs, or the like. Current copies of z/VM publications can be found in our online library.
The Dynamic Memory Upgrade enhancement
introduces or
changes these commands or their outputs:
SET STORAGE
DEFINE STORAGE STANDBY
DEFINE STORAGE RESERVED
QUERY STORAGE
QUERY VIRTUAL STORAGE
The Specialty Engine Enhancements
work
introduces or
changes these commands or their outputs:
DEFINE CPU
SET SHARE
SET VCONFIG
QUERY VCONFIG
QUERY VIRTUAL CPUS
INDICATE USER
INDICATE LOAD
QUERY SHARE
QUERY PROCESSORS
The DCSS Above 2G enhancement
introduces or
changes these commands or their outputs:
DEFSYS
DEFSEG
QUERY NSS
Effects on Accounting Data
The Specialty Engine Enhancements work changed the accounting record for virtual machine resource usage (record type 1). Additional codes are now valid for the real and virtual CPU type fields.
See chapter 8 in CP Planning and Administration for further information on the accounting record changes and chapter 3 in CMS Commands and Utilities Reference for further information on the ACCOUNT utility.
Performance Toolkit for VM Changes
Performance Toolkit for VM has been enhanced in z/VM 5.4 to include changes to the following reports:
Performance Toolkit for VM: Changed Reports
| Name | Number | Title | Changes |
| CPU | FCX100 | CPU |
|
| SYSTEM | FCX102 | System Counters |
|
| STORAGE | FCX103 | Storage Utilization |
|
| PRIVOPS | FCX104 | Privileged Operations |
|
| DEVICE | FCX108 | Devices |
|
| USER | FCX112 | User counters |
|
| SYSCONF | FCX180 | System Configuration |
|
| UCONF | FCX226 | User Configuration |
|
| IOPROCLG | FCX232 | I/O Processor Log |
|
| AVAILLOG | FCX254 | Storage Availability Log |
|
| EVNIC | FCX270 | Extended Virtual Network Device Activity |
|
Performance Toolkit for VM now provides the ability for a customer to tailor an optional web banner to be displayed for 5 seconds before the logon screen.
Omegamon XE has added several new workspaces so as to expand and enrich its ability to comment on z/VM system performance. In particular, Omegamon XE now offers these additional workspaces:
- Linux normalization
- Mixed Engines
- Minidisk Cache
- Control Unit Data
- Channel Data
- Channel Cache
- DASD Cache
- Spin Lock
- Vdisk
To support these Omegamon XE endeavors, Performance Toolkit for VM now puts the relevant CP Monitor data into the PERFOUT DCSS.
IBM continually improves Performance Toolkit for VM in response to customer-reported and IBM-reported defects or suggestions. In Function Level 540, the following improvements or repairs are notable:
- The file FCONX REPORTS has been updated to add many report names that were heretofore missing.
- On FCX108 DEVICE, for a disk volume that is PAV'd (either via classic PAV or via HyperPAV), the "response time" field for the base device number only now reports the volume response time instead of the response time for only the base device. This is made possible by the aggregate-alias MRIODDEV fields added in z/VM 5.3 and described in our PAV tuning discussion. Knowing volume response time greatly aids in volume tuning activities.
- PERFKIT BATCH reductions of MONWRITE data sometimes failed if the sample interval was small and the number of devices in the system was large. The repair lifts the constraint.
- On FCX162 USERLOG, the mean TCPU and VCPU values were being calculated incorrectly. This is repaired.
- The FC USRLIMIT facility, which sets thresholds and response actions for users whose resource consumptions exceed certain limits, was incorrectly calculating user I/O activity and thereby raising I/O alerts too late. The calculation was corrected.
- On systems with more than 13 engines, the CPSALL, CPSTOVM, CPSTOCP, and CPSFAILS reports omitted the "means" row. This has been corrected.
- FCX180 SYSCONF was repaired to give correct reports for all-IFL partitions.
Back to Table of Contents.
New Functions
This section contains performance evaluation results for the following new functions:
- Dynamic Memory Upgrade
- Mixed Engine Support
- DCSS Above 2 GB
- TCP/IP Layer 2 Support
- Telnet IPv6 Support
- SSL Rehost
Back to Table of Contents.
Dynamic Memory Upgrade
Abstract
z/VM 5.4 lets real storage be increased without an IPL by bringing designated amounts of standby storage online. Further, guests supporting the dynamic storage reconfiguration architecture can increase or decrease their real storage sizes without taking a guest IPL.
On system configurations with identical storage sizes, workload behaviors are nearly identical whether the storage was all available at IPL or was achieved by bringing storage online dynamically. When storage is added to a z/VM system that is paging, transitions in the paging subsystem are apparent in the CP monitor data and Performance Toolkit data and match the expected workload characteristics.
Introduction
This article provides general observations about performance results achieved when storage (aka memory) is brought online dynamically. The primary result is that on system configurations with identical storage sizes, results are nearly identical whether the storage was all available at IPL or was brought online by CP commands. Further, when storage is added to a paging workload, transitions in the paging subsystem are apparent in the CP monitor data and Performance Toolkit data and match the workload characteristics.
The SET STORAGE command allows a designated amount of standby storage to be added to the configuration. Storage to be dynamically added must be reserved during LPAR activation but does not need to exist at activation time. Storage added by the SET STORAGE command will be initialized only when storage is needed to satisfy demand or the system enters a wait state.
The QUERY STORAGE command now shows the amounts of standby and reserved storage. Reserved storage that exists will be shown as standby storage while reserved storage that does not exist will be shown as reserved. Values for standby and reserved can change when real storage is added, LPARs are activated or deactivated, and storage is dynamically added by operating systems running in other LPARs.
The DEFINE STORAGE command was enhanced to include STANDBY and RESERVED values for virtual machines and the values will be shown in the output of the QUERY VIRTUAL STORAGE command.
The maximum values for MDCACHE and VDISK do not get updated automatically when storage is dynamically increased. After increasing real storage, the system administrator might want to evaluate and increase any storage settings established for SET SRM STORBUF, SET RESERVED, SET MDCACHE STORAGE, or the SET VDISK system limit.
CP monitor data and Performance Toolkit for VM provide information relative to the standby and reserved storage. The new monitor data is described in z/VM 5.4 Performance Management. Storage added by the SET STORAGE command will not be reflected in CP monitor data and Performance Toolkit for VM counters until the storage has been initialized.
Method
Dynamic memory upgrade was evaluated using transition workloads and steady state workloads. Transition workloads were used to ensure that workload characteristics change as a result of dynamically adding storage. Steady state workloads were used to ensure performance results are similar whether the storage was all available at IPL or was achieved by a series of SET STORAGE commands.
Virtual Storage Exerciser was used to create the transition and steady state workloads used for this evaluation.
Here are the workload parameters for the two separate workloads that were used in this evaluation.
VIRSTOEX Users and Workload Parameters
| Workload | 2G | 16G |
|---|---|---|
| Users | 8 | 8 |
| End Addr | 4GB | 18GB |
| Increment | 56 | 32 |
| Requested Time | 720 | 720 |
| CPUs | 3 | 3 |
| Requested Loops | 0 | 0 |
| Fixedwait | 0 | 0 |
| Randomwait | 0 | 0 |
For transition evaluations, the workload was started in a storage size that would require z/VM to page. Storage was then dynamically added, in an amount that should eliminate z/VM paging and allow the workload to achieve 100% processor utilization. After that, additional storage was added to show that dynamically added storage is not initialized until it is needed or until the system enters a wait condition.
For steady state evaluation, a workload was measured in a specific storage configuration that was available at IPL. The measurement was repeated in a storage configuration that was IPLed with only a portion of the desired storage and the remainder dynamically added with SET STORAGE commands.
Guest support was evaluated by using z/VM 5.4 as a guest of z/VM 5.4, using the same workloads used for a first-level z/VM.
Results and Discussion
2G Transition Workload
The system was IPLed with 1G of storage and a workload started that required about 2G. This workload starts with heavy paging and less than 100% processor utilization.
Three minutes into the run, 1G of storage was added via the SET STORAGE command. This new storage was immediately initialized, paging was eliminated, processor utilization increased to 100%, and the monitor counters correctly reported the new storage values (DPA, SXS, available list). SXS will be extended when storage is dynamically increased until it reaches its maximum value of 2G which corresponds to real storage just slightly over 2G.
Six minutes into the run, another 1G of storage was added via the SET STORAGE command. Because processor utilization was 100% and no paging was in progress, as expected this storage remained uninitialized for the next six minutes of steady-state workload.
Twelve minutes into the run, the workload ended, causing processor utilization to drop below 100%, the storage to be initialized, and counters updated (DPA, available list).
All of the aforementioned results and observations match expectations.
Here is an example (run ST630E01) containing excerpts from four separate Performance Toolkit screens showing values changing by the expected amount at the expected time. Specific data is extracted from these screens:
- Performance Toolkit SYSSUMLG screen (FCX225)
- Performance Toolkit PAGELOG screen (FCX143)
- Performance Toolkit AVAILLOG screen (FCX254)
- Performance Toolkit SXSUTIL screen (FCX264)
------------------------------------------------
          FCX225   FCX143        FCX254   FCX264
------------------------------------------------
                      DPA                    SXS
 Interval    Pct  Pagable   <Available>    Total
 End Time   Busy   Frames    <2GB  >2GB    Pages
------------------------------------------------  Start with 1G
 10:50:25   29.2   251481     875     0   258176
 10:50:55   24.3   251482    1183     0   258176
 10:51:25   34.9   251482     404     0   258176  Workload paging
 10:51:55   25.9   251482    1105     0   258176  <100% cpu
 10:52:25   30.4   251483      51     0   258176
------------------------------------------------  1G to 2G
 10:52:55   55.5   504575    176k     0   515840
 10:53:25  100.0   504575    170k     0   515840
 10:53:55  100.0   504575    170k     0   515840  No workload paging
 10:54:25  100.0   504575    170k     0   515840  100% cpu
 10:54:55  100.0   504575    170k     0   515840
 10:55:25  100.0   504577    170k     0   515840
------------------------------------------------  2G to 3G
 10:55:55  100.0   503755    169k     0   524287
 10:56:25  100.0   499240    165k     0   524287
 10:56:55  100.0   498475    164k     0   524287
 10:57:25  100.0   499252    164k     0   524287  Storage not being
 10:57:55  100.0   498483    164k     0   524287  initialized due to
 10:58:25  100.0   499253    164k     0   524287  100% cpu
 10:58:55  100.0   498476    164k     0   524287
 10:59:25  100.0   499249    164k     0   524287
 10:59:55  100.0   498446    164k     0   524287
 11:00:25  100.0   499255    164k     0   524287
 11:00:55  100.0   499252    164k     0   524287
 11:01:25  100.0   499253    164k     0   524287
------------------------------------------------  Workload end, init starts
 11:01:55   15.4   763566    169k  260k   524287
 11:02:25    2.6   765402    170k  260k   524287
 -----------------------------------------------  Initialization completes
2G Steady State Workload
Results for steady state measurements of the 2G workload in 3G of real storage were nearly identical whether the storage configuration was available at IPL or the storage configuration was dynamically created with SET STORAGE commands. Because they were nearly identical, no specific results are included here.
16G Transition Workload
The system was IPLed with 12G of storage and a workload started that required about 16G, so the workload starts with heavy paging and less than 100% processor utilization.
Three minutes into the run, 18G of storage was added via the SET STORAGE command. Enough of this new storage was immediately initialized to eliminate paging and to allow processor utilization to reach 100%. The remainder of the storage was not initialized until the workload ended and processor utilization dropped below 100%. The monitor counters then correctly reported the new storage (DPA, available list).
All of the aforementioned results and observations match expectations.
Here is an example (run ST630E04) containing excerpts from four separate Performance Toolkit screens showing values changing by the expected amount at the expected time. Specific data is extracted from these screens:
- Performance Toolkit SYSSUMLG screen (FCX225)
- Performance Toolkit PAGELOG screen (FCX143)
- Performance Toolkit AVAILLOG screen (FCX254)
- Performance Toolkit SXSUTIL screen (FCX264)
-------------------------------------------------
          FCX225    FCX143       FCX254    FCX264
-------------------------------------------------
                       DPA                    SXS
Interval    Pct    Pagable  <Available>     Total
End Time   Busy     Frames   <2GB  >2GB     Pages
------------------------------------------------- Start with 12G
12:35:04   54.9    3107978    780  1451    524287 Workload paging
12:35:34   73.8    3107980    299   139    524287 <100% cpu
12:36:03   81.6    3107981    425  2860    524287
12:36:34   79.6    3107985     97  1073    524287
12:37:03   79.0    3107986     29    28    524287
12:37:34   75.9    3107986    390   163    524287
12:38:03   78.7    3107990    191    50    524287
------------------------------------------------- Add 18G
12:38:33   93.2    6933542     66 2476k    524287 Immediate
12:39:03  100.1    6933542     73 2475k    524287 Initialization
12:39:33   99.9    6933542     76 2474k    524287 satisfies the
12:40:03   99.9    6933542     88 2474k    524287 workload need
12:40:33   99.9    6933542     96 2474k    524287
12:41:03   99.9    6933542     99 2474k    524287
12:41:33   99.9    6933542    100 2474k    524287
12:42:03   99.9    6933542    100 2474k    524287
12:42:33   99.9    6933542    100 2474k    524287
12:43:03   99.9    6933542    100 2474k    524287
12:43:33   99.9    6933542    101 2474k    524287
12:44:03   99.9    6933541    100 2474k    524287
12:44:33   99.9    6933541    109 2474k    524287
12:45:03   99.9    6933541    109 2474k    524287
12:45:33   99.9    6933541    109 2474k    524287
12:46:03   99.9    6933541    109 2474k    524287
------------------------------------------------- Workload End
12:46:33   17.0    7789646    109 3330k    524287 Init resumes
12:47:03     .0    7789646    109 3330k    524287
 -----------------------------------------------  Init completes
16G Steady State Workload
Results for steady state measurements of the 16G workload in 30G of real storage were nearly identical whether the storage configuration was available at IPL or the storage configuration was dynamically created with SET STORAGE commands. Because they were nearly identical, no specific results are included here.
z/VM 5.4 Guest Evaluation
The four separate z/VM 5.4 guest evaluations produced results consistent with the results described for z/VM 5.4 in an LPAR, so no specific results are included here.
Elapsed Time Needed to Process a SET STORAGE Command
Although no formal data was collected, the time to execute a SET STORAGE command is affected by the amount of standby storage and the percentage of standby storage that is being added. The largest amount of time generally occurs on the first SET STORAGE command when there is a large amount of standby storage and a small percentage of the standby storage is added.
Summary and Conclusions
On system configurations with identical storage sizes, results are nearly identical whether the storage was all available at IPL or was achieved by a series of SET STORAGE commands.
When storage is added to a paging workload, paging subsystem transitions matched the expectation of the workload characteristics and the updated storage configuration.
CP monitor data and Performance Toolkit for VM provide the expected information relative to the standby and reserved storage transitions.
The QUERY command provided the expected information relative to standby and reserved storage.
Storage added by the SET STORAGE command will be initialized only when storage is needed to satisfy demand or the system enters a wait state.
A z/VM 5.4 guest of z/VM 5.4 reacted as expected with dynamic memory changes.
Back to Table of Contents.
Specialty Engine Enhancements
Abstract
z/VM 5.4 provides support for the new z/VM-mode logical partition available on the z10 processor. A partition of this mode can include zAAPs (IBM System z10 Application Assist Processors), zIIPs (IBM System z10 Integrated Information Processors), IFLs (Integrated Facility for Linux processors), and ICFs (Internal Coupling Facility processors), in addition to general purpose CPs (central processors).
A virtual configuration can now include virtual IFLs, virtual ICFs, virtual zAAPs, and virtual zIIPs in addition to virtual general purpose CPs. These types of virtual processors can be defined by issuing the DEFINE CPU command or by placing the DEFINE CPU command in the directory.
According to settings established by the SET CPUAFFINITY command for the given virtual machine, z/VM either dispatches virtual specialty engines on real CPUs that match their types (if available) or simulates them on real CPs.
A new SET VCONFIG MODE command lets a user set a virtual machine's mode to one appropriate for the guest operating system. The SET SHARE command now allows settings by CPU type.
On system configurations where the CPs and specialty engines are the same speed, performance results are similar whether virtual specialty engines are dispatched on real specialty engines or simulated on CPs. On system configurations where the specialty engines are faster than CPs, performance results are better when using the faster specialty engines and scale correctly based on the relative processor speed.
CP monitor data and Performance Toolkit for VM provide information relative to the specialty engines.
Introduction
This article provides general observations about performance results when using the zAAP, zIIP, IFL, and ICF engines. The central result of our study is that performance results were always consistent with the speed and number of engines provided to the application. However, without proper balance between the LPAR, z/VM, and guest settings, a system can have a large queue for one processor type while other processor types remain idle. Accordingly, this article illustrates the performance information available for effective use of specialty engines.
The purpose of the z/VM-mode partition is to allow a single z/VM image to support a broad mixture of workloads. This is the only LPAR mode that allows IFL and ICF processors to be defined in the same partition as zIIP and zAAP processors. Different virtual configuration modes are necessary to enable the desired processor combinations for individual virtual machines. The SET VCONFIG MODE command was introduced to establish these virtual machine configurations. Once a configuration has been established the CP DEFINE CPU can be used to create the desired combination of virtual processors. Valid combinations of processors types and VCONFIG MODE settings are defined in z/VM: Running Guest Operating Systems. Other LPAR setting and zVM setting can affect the actual performance characteristics of these virtual machines. Details of these affects are include in the Results section.
Because z/VM virtualizes the z10's z/VM-mode partition, a guest can be defined with a VM mode on a z9 and affinity will be suppressed for any specialty engines not supported by the real LPAR.
On some System z models, the specialty engines are faster than the primary engines. Specialty Engine Support describes how to identify the relative speeds.
This article contains examples of both Performance Toolkit data and z/OS RMF data. Terminology for processor type has varied in both and includes: CP for Central Processors; IFA, AAP, and ZAAP for zAAP; IIP, and ZIIP for zIIP; and ICF and CF for ICF.
New z/VM monitor data available with the specialty engine support is described in z/VM 5.4 Performance Management.
The specialty engine support that existed prior to z/VM 5.4 is described in Specialty Engine Support. Because that writeup is still valid for non-z/VM-mode logical partitions, this new article will deal mostly with the new z/VM-mode logical partition, in which all specialty processors (zIIP, zAAP, IFL, and ICF) can coexist with standard (CP) processors.
Method
The specialty engine support was evaluated using z/OS guest virtual machines with four separate workloads plus a Linux guest virtual machine with one workload.A z/OS JAVA workload described in z/OS JAVA Encryption Performance Workload provided use of zAAP processors. Workload parameters were chosen to maximize the amount of zAAP-eligible processing and the specific values are not relevant to the discussion. This workload will run a processor at 100% utilization and is mostly eligible for a zAAP.
A z/OS IPSec workload described in z/OS IP Security Performance Workload provided use of zIIP processors. Workload parameters were chosen to maximize the amount of zIIP-eligible processing and the specific values are not relevant to the discussion. It is capable of using about 100% of a zIIP processor.
A z/OS zFS workload described in z/OS File System Performance Tool was used in a sysplex configuration to provide use of ICF processors. Workload parameters were chosen to maximize the amount of ICF-eligible processing and the specific values are not relevant to the discussion. Three separate guests were used in the configuration for this workload. One z/OS guest was used for the application, another z/OS guest contained the zFS files that were being requested by the application, and a coupling facility was active to connect the two z/OS systems. This workload configuration is capable of using about 60% of an ICF processor.
A z/OS SSL Performance Workload described in z/OS Secure Sockets Layer (System SSL) Performance Workload provided utilization of the CP processors. Workload parameters were chosen to maximize the amount of CP-eligible processing and the specific values are not relevant to the discussion. It is capable of using all the available CP processors.
A Linux OpenSSL workload described in Linux OpenSSL Exerciser provided use of IFL processors. Workload parameters were chosen to maximize the amount of IFL-eligible processing and the specific values are not relevant to the discussion. This workload is capable of using all available IFL processors.
The workloads were measured independently and together in many different configurations. The workloads were measured with and without specialty engines in the real configuration. The workloads were measured with and without specialty engines in the virtual configuration. The workloads were measured with all available SET CPUAFFINITY values (ON, OFF, and Suppressed). The workloads were measured with all available SET VCONFIG MODE settings. The workloads were also measured with z/OS and Linux running directly in an LPAR. Measurements of individual workloads were used to verify quantitative performance results. Measurements involving multiple workloads were used to evaluate the various controlling parameters and to demonstrate the available performance information but not for quantitative results.
This article will deal mostly with the controlling parameters and the available performance information rather than the quantitative results.
Results and Discussion
Effectively using a z/VM-mode LPAR requires attention to LPAR settings such as weight, sharing, and capping. It also requires attention to z/VM settings, such as SET VCONFIG MODE, SET SHARE, and SET CPUAFFINITY. Finally, it requires attention to guest definition, namely, in selecting guest virtual processor types. In these results we illustrate how LPAR, z/VM, and guest settings interact and show examples of performance data relevant to each.
Specialty Engines from a LPAR Perspective
A z10 z/VM-mode LPAR can have a mixture of central processors and all types of specialty processors. Processors can be dedicated to the LPAR or they can be shared with other LPARs. The LPAR cannot contain a mixture of dedicated and shared processors. For LPARs with shared processors, the LPAR weight is used to determine the capacity factor for each processor type in the z/VM-mode LPAR. The weight can be different for each processor type. Shared processors can be capped or non-capped. Capping can be selected by processor type. Capped processors cannot exceed their defined capacity factor but non-capped processors can use excess capacity from other LPARs.
Quantitative results can be affected by how the processors are defined for the z/VM-mode LPAR. With dedicated processors, the LPAR gets full utilization of the processors. With shared processors, the LPAR's capacity factor is determined by the LPAR weight, the total weights for each processor type, and the total number of each processor type. If capping is specified, the LPAR cannot exceed its calculated capacity factor. If capping is not specified, the LPAR competes with other LPARs for unused cycles by processor type.
Here is an example (run E8430VM1) excerpt of the Performance Toolkit LPAR screen for the EPRF1 z/VM-mode LPAR with dedicated CP, zAAP, zIIP, IFL, and ICF processors. It shows 100% utilization regardless of how much is actually being used by z/VM because it is a dedicated partition. The actual workload used nearly 100% of the zAAP and IFL processors, about half of the CP and ICF processors, but almost none of the zIIP processor.
 Partition #Proc Weight Wait-C Cap %Load CPU %Busy  Type
 EPRF1        11    DED    YES  NO  19.6   0 100.0  CP
                    DED         NO         1 100.0  CP
                    DED         NO         2 100.0  CP
                    DED         NO         3 100.0  CP
                    DED         NO         4 100.0  ZAAP
                    DED         NO         5 100.0  ZIIP
                    DED         NO         6 100.0  ICF
                    DED         NO         7 100.0  IFL
                    DED         NO         8 100.0  IFL
                    DED         NO         9 100.0  IFL
                    DED         NO        10 100.0  IFL
Here is an example (run E8415CF1) excerpt of the Performance Toolkit LPAR screen showing a shared capped z/VM-mode LPAR with CP, zAAP, zIIP, IFL, and ICF processors. The capped weight is the same for all engine types. However, because the total weight and number of processors varies by processor type, the actual capacity is not the same for all processor types. The actual workload in this example could not exceed the allocated capacity for any engine type so the workload was not limited by the capping.
 Partition  #Proc Weight Wait-C Cap %Load CPU %Busy  Type
 EPRF1          8     80     NO YES   5.9   0  65.0  CP
                      80        YES         1  65.0  CP
                      80        YES         2  65.0  CP
                      80        YES         3  64.8  CP
                      80        YES         4    .0  ZAAP
                      80        YES         5    .0  ZIIP
                      80        YES         6  70.3  ICF
                      80        YES         7    .0  IFL

 Summary of physical processors:
 Type  Number  Weight  Dedicated
 CP        34     170          0
 ZAAP       2     120          0
 IFL       16     120          0
 ICF        2     110          0
 ZIIP       2     120          0
Here is an example (run E8730BS1) excerpt of the Performance Toolkit LPAR screen showing a shared capped z/VM-mode LPAR with CP, zAAP, zIIP, IFL, and ICF processors. The capped weight is the same for all engine types. However, because the total weight and number of processors varies by processor type, the actual capacity is not the same for all processor types. The actual workload in this example is limited by the capped capacity of the zIIP processor. The capped capacity for zIIP processors is 27% (3 processors times a weight of 5 divided by the total weight of 55).
FCX126  Run 2008/07/30 15:05:40         LPAR
                                        Logical Partition Activity

 Partition #Proc Weight Wait-C Cap %Load CPU %Busy  Type
 EPRF1         8      5     NO YES   1.8   0  18.1  CP
                      5        YES         1  17.1  CP
                      5        YES         2  16.4  CP
                      5        YES         3  15.8  CP
                      5        YES         4    .7  ZAAP
                      5        YES         5  28.4  ZIIP
                      5        YES         6   1.1  ICF
                      5        YES         7    .8  IFL


 Summary of physical processors:
 Type  Number  Weight  Dedicated
 CP        34     105          0
 ZAAP       2      45          0
 IFL       16     105          0
 ICF        1       5          0
 ZIIP       3      55          0
Specialty Engines from a z/VM Perspective
The CPUAFFINITY value is used to determine whether simulation or virtualization is desired for a guest's specialty engines. With CPUAFFINITY ON, z/VM will dispatch a user's specialty CPUs on real CPUs that match their types. If no matching CPUs exist in the z/VM-mode LPAR, z/VM will suppress this CPUAFFINITY and simulate these specialty engines on CPs. With CPUAFFINITY OFF, z/VM will simulate specialty engines on CPs regardless of the existence of matching specialty engines. Although IFLs can be the primary processor in some modes of LPARs, they are always treated as specialty processors in a z/VM-mode LPAR.
z/VM's only use of specialty engines is to dispatch guest virtual specialty processors. Without any guest virtual specialty processors, z/VM's real specialty processors will appear nearly idle in both the z/VM monitor data and the LPAR data. Interrupts are enabled, though, so their usage will not be absolute zero.
The Performance Toolkit SYSCONF screen was updated to provide information about the processor types and capacity factor by processor type.
Here is an example (run E8415CF1) excerpt of the Performance Toolkit SYSCONF screen showing a shared capped z/VM-mode LPAR with CP, zAAP, zIIP, IFL, and ICF processors. The capped weight is the same for all engine types. However, because the total weight and number of processors varies by processor type, the capacity factor is not identical for all processor types and the LPAR will not allow the capacity of any processor type to exceed its capped capacity.
FCX180  Run 2008/04/15 18:51:44   SYSCONF
                                  System Configuration, Initial and Changed
___________________________________________________________________________

 Log. CP  : CAF   117, Total  4, Conf  4, Stby  0, Resvd  0, Ded  0, Shrd  4
 Log. ZAAP: CAF   666, Total  1, Conf  1, Stby  0, Resvd  0, Ded  0, Shrd  0
 Log. IFL : CAF   117, Total  4, Conf  4, Stby  0, Resvd  0, Ded  0, Shrd  4
 Log. ICF : CAF   727, Total  1, Conf  1, Stby  0, Resvd  0, Ded  0, Shrd  0
 Log. ZIIP: CAF   666, Total  1, Conf  1, Stby  0, Resvd  0, Ded  0, Shrd  0
The Performance Toolkit PROCLOG screen was updated to provide the processor type for each individual processor and to include averages by processor type.
Here is an example (run E8430VM1) excerpt of the Performance Toolkit PROCLOG screen showing the utilization of the individual processors and the average utilization by processor type. This data is consistent with the LPAR-reported utilization for this measurement which is shown as an example in Performance Toolkit data. The actual workload in this example included a Linux guest to use the IFL processors, z/OS SYSPLEX guests (two z/OS guests and a Coupling Facility guest) to use the ICF and CP processors, and a z/OS guest to use the zAAP processors. There is no guest with a virtual zIIP so the only zIIP usage is z/VM interrupt handling. CPUAFFINITY is ON for all of these guest machines. The actual workload used nearly 100% of the zAAP and IFL processors, about half of the CP and ICF processors but almost none of the zIIP processor. These values are consistent with the workload characteristics.
FCX144  Run 2008/04/30 21:19:57         PROCLOG
                                        Processor Activity, by Time

                  <------ Percent Busy ----
           C
 Interval  P
 End Time  U Type Total  User  Syst  Emul
 >>Mean>>  0 CP    58.4  56.1   2.3  46.6
 >>Mean>>  1 CP    58.1  56.3   1.7  47.2
 >>Mean>>  2 CP    56.9  55.2   1.6  46.2
 >>Mean>>  3 CP    57.1  55.4   1.7  46.4
 >>Mean>>  4 ZAAP  97.5  96.1   1.4  95.7
 >>Mean>>  5 ZIIP   1.9    .0   1.9    .0
 >>Mean>>  6 ICF   60.2  57.9   2.3  11.7
 >>Mean>>  7 IFL   97.7  97.2    .4  88.1
 >>Mean>>  8 IFL   98.0  97.5    .5  88.4
 >>Mean>>  9 IFL   97.7  97.2    .5  87.9
 >>Mean>> 10 IFL   97.9  97.3    .6  87.5

 >>Mean>>  . CP    57.6  55.7   1.8  46.6
 >>Mean>>  . ZAAP  97.5  96.1   1.4  95.7
 >>Mean>>  . IFL   97.8  97.3    .5  87.9
 >>Mean>>  . ZIIP   1.9    .0   1.9    .0
 >>Mean>>  . ICF   60.2  57.9   2.3  11.7
Specialty Engines from a Guest Perspective
In a z/VM-mode LPAR, performance of an individual guest is controlled by the z/VM share setting, the CPUAFFINITY setting, the VCONFIG setting, and the virtual processor combinations.
The share setting for a z/VM guest determines the percentage of available processor resources for the individual guest. The share setting can be different for each virtual processor type or can be the same for each processor type. Shares are normalized to the sum of shares for virtual machines in the dispatcher list for each pool of processor type. Because the sum will not necessarily be the same for each processor type, an individual guest could get a different percentage of a real processor for each processor type. Although Performance Toolkit does not provide any information about the share setting by processor, it can be determined from the QUERY SHARE command or from z/VM monitor data Domain 4 Record 3. The total share setting for individual guests is shown in the Performance Toolkit UCONF screen.
Because some operating systems cannot run in a z/VM-mode partition, a new SET VCONFIG MODE command lets a user change a virtual machine's mode to one appropriate for the guest operating system. Valid modes are ESA390, LINUX, or VM. Use of an ICF in a z/VM-mode LPAR cannot be accomplished with the SET VCONFIG MODE; it requires OPTION CFVM in the directory. When OPTION CFVM is specified in the directory, the virtual configuration mode is automatically set to CF and cannot be changed by the SET VCONFIG MODE command.
The QUERY VCONFIG command can be used to display the virtual machine mode for all virtual machine types except CFVM. When a virtual machine becomes a CFVM, it no longer has the ability to issue a QUERY command, so even though CF is its virtual configuration mode, QUERY VCONFIG can never display the mode and thus product documentation does not list CF as a valid response. The INDICATE USER command will show the virtual machine as CF.
For a z/OS guest, the virtual configuration mode must be set to ESA390 with valid virtual processor types of CP, zAAP, and zIIP.
Coupling Facility guests require OPTION CFVM in the directory and the virtual configuration mode is automatically set to CF.
Linux guests are supported in all valid virtual configuration modes with all available processor types. However, not all processors available to the guest or to z/VM will be used. With a virtual configuration mode of ESA390, the guest will use only CP processors and thus be dispatched on only CP processors. With a virtual configuration mode of LINUX and virtual processor type of IFL, the guest will be dispatched on either CP or IFL processors depending on the CPUAFFINITY setting and the availability of real IFL processors. With a virtual configuration mode of LINUX and virtual processor type of CP, the guest will be dispatched on real CP processors. With a virtual configuration mode of VM, only virtual processors that match the primary processor will be used by Linux and they will be dispatched on real primary processors.
Because z/VM 5.4 virtualizes the z/VM-mode logical partition, a guest can be defined with a virtual configuration of VM when z/VM is running in a ESA/390-mode LPAR.
The overall processor usage for individual guests is shown in the Performance Toolkit USER screen but it does not show individual processor types.
Here is an example (run E8430VM1) excerpt of the Performance Toolkit USER screen showing the processor usage for the individual guests in the active workload. It shows the LINMAINT guest using nearly 4 processors but does not show that the processor type is IFL. It shows the ZOSCF1 and ZOSCF2 guests using slightly more than 1 processor but does not show that the processor type is CP. It shows the ZOS1 guest using slightly more than 1 processor but does not show that the processor type consists of 4 CPs and 1 zAAP. It shows the CFCC1 guest using 58% of a processor but does not show that the processor type is ICF.
FCX112  Run 2008/04/30 21:19:57         USER
                                        General User Resource Utilization
From 2008/04/30 21:00:03

           <----- CPU Load
                <-Seconds->
 Userid    %CPU  TCPU  VCPU  Share
 LINMAINT   389  4633  4187    100
 ZOSCF2     108  1283  1076    100
 ZOSCF1     107  1273  1045    100
 ZOS1       104  1242  1236    200
 CFCC1     57.9 689.0 139.3    100
The Performance Toolkit USER Resource Detail Screen (FCX115) has additional information for a virtual machine but it does not show processor type so no example is included.
For a z/OS guest, RMF data provides number and utilization of CP, zAAP, and zIIP virtual processors. The RMF reporting of data is not affected by the CPUAFFINITY setting but the actual values can be affected. Specialty Engine Support contains two examples to demonstrate the effect.
Although Performance Toolkit does not provide any information about the CPUAFFINITY setting, it can be determined from the QUERY CPUAFFINITY command or from a flag in z/VM monitor data Domain 4 Record 3.
Here is an example (run E8430VM1) excerpt of the RMF CPU Activity report showing the processor utilization by processor type for the ZOS1 userid with the JAVA workload active, a virtual configuration of 4 CPs, and 1 zAAP, and CPUAFFINITY ON.
The RMF-reported processor utilization for the zAAP processor type matches the z/VM-reported utilization because this is the only virtual zAAP in the active workload. The RMF-reported processor utilization for the CP processor type does not match the z/VM-reported utilization because other users in the active workload are using CP-type processors. The LPAR-reported utilization for this measurement is shown as an example in Performance Toolkit data, and the z/VM-reported utilization for this measurement is shown as an example in Performance Toolkit data.
                                       C P U  A C T I V I T Y

            z/OS V1R9                           DATE 04/30/2008
---CPU---    ---------------- TIME %-
NUM  TYPE    ONLINE     MVS BUSY
 0    CP     100.00      1.35
 1    CP     100.00      1.33
 2    CP     100.00      1.32
 3    CP     100.00      6.51
TOTAL/AVERAGE            2.63
 4    AAP    100.00     96.27
TOTAL/AVERAGE           96.27
Here is an example (run E8429FL2) excerpt of the Performance Toolkit PROCLOG screen showing the utilization of the individual processors and the average utilization by processor type. The active workload in this example is a Linux guest with a virtual configuration mode of LINUX, four virtual IFL processors, and CPUAFFINITY ON. The z/VM supporting this guest is running in a z/VM-mode LPAR with dedicated CP, zAAP, zIIP, IFL, and ICF processors. It shows nearly 100% utilization of the IFL processor and nearly zero on all the other processor types. This example shows the configuration that should be used for moving an existing LINUX only-mode IFL partition to a z/VM-mode partition and using real IFL processors.
FCX144  Run 2008/04/29 21:12:44         PROCLOG
                                        Processor Activity, by Time

                  <------ Percent Busy ----
           C
 Interval  P
 End Time  U Type Total  User  Syst  Emul
 >>Mean>>  0 CP     1.8    .0   1.8    .0
 >>Mean>>  1 CP     1.0    .0   1.0    .0
 >>Mean>>  2 CP     1.1    .0   1.1    .0
 >>Mean>>  3 CP     1.0    .0   1.0    .0
 >>Mean>>  4 ZAAP    .7    .0    .7    .0
 >>Mean>>  5 ZIIP    .8    .0    .8    .0
 >>Mean>>  6 ICF    1.6    .0   1.6    .0
 >>Mean>>  7 IFL   96.3  95.8    .4  86.6
 >>Mean>>  8 IFL   96.7  96.3    .4  87.2
 >>Mean>>  9 IFL   96.3  95.9    .4  86.7
 >>Mean>> 10 IFL   96.7  96.2    .4  86.9

 >>Mean>>  . CP     1.2    .0   1.2    .0
 >>Mean>>  . ZAAP    .7    .0    .7    .0
 >>Mean>>  . IFL   96.4  96.0    .4  86.8
 >>Mean>>  . ZIIP    .8    .0    .8    .0
 >>Mean>>  . ICF    1.6    .0   1.6    .0
Here is an example (run E8429FL3) excerpt of the Performance Toolkit PROCLOG screen showing the utilization of the individual processors and the average utilization by processor type. The active workload in this example is a Linux guest with a virtual configuration mode of LINUX, four virtual IFL processors and CPUAFFINITY ON (identical to the example in Performance Toolkit data). The z/VM supporting this guest is running in a z/VM-mode LPAR with dedicated CP, zAAP, zIIP, and ICF processors. Because there are no real IFLs, CPUAFFINITY will be suppressed and the virtual IFLs will be dispatched on CP processors. It shows nearly 100% utilization of the CP processors and nearly zero on all the other processor types. Nearly identical results would be expected in several other valid Linux scenarios, a LINUX IFL virtual configuration with CPUAFFINITY OFF, a LINUX CP virtual configuration, an ESA390 virtual configuration with a primary type of CP, a VM virtual configuration with a primary type of CP (this virtual configuration can include IFLs, but Linux will dispatch to only the primary CPU type).
FCX144  Run 2008/04/29 22:11:55         PROCLOG
                                        Processor Activity, by Time

                  <------ Percent Busy ----
           C
 Interval  P
 End Time  U Type Total  User  Syst  Emul
 >>Mean>>  0 CP    97.1  96.0   1.1  86.6
 >>Mean>>  1 CP    97.2  96.5    .7  87.0
 >>Mean>>  2 CP    97.0  96.4    .7  87.4
 >>Mean>>  3 CP    97.2  96.5    .7  87.3
 >>Mean>>  4 ZAAP   1.6    .0   1.6    .0
 >>Mean>>  5 ZIIP   1.5    .0   1.5    .0
 >>Mean>>  6 ICF    2.8    .0   2.8    .0

 >>Mean>>  . CP    97.1  96.3    .8  87.0
 >>Mean>>  . ZAAP   1.6    .0   1.6    .0
 >>Mean>>  . ZIIP   1.5    .0   1.5    .0
 >>Mean>>  . ICF    2.8    .0   2.8    .0
Summary and Conclusions
Results were always consistent with the speed and number of engines provided to the application. Balancing of the LPAR, z/VM, and guest processor configurations is the key to optimal performance. Merging multiple independent existing partitions with unique processor types into a single z/VM-mode partition requires careful consideration of the available processor types, and the relative speed of the processor types to ensure the optimum virtual configuration and CPUAFFINITY setting.
Back to Table of Contents.
DCSS Above 2 GB
Abstract
In z/VM 5.4, the usability of Discontiguous Saved Segments (DCSSs) is improved. DCSSs can now be defined in storage up to 512 GB, and so more DCSSs can be mapped into each guest. A Linux enhancement takes advantage of this to build a large block device out of several contiguously-defined DCSSs. Because Linux can build an ext2 execute-in-place (XIP) file system on a DCSS block device, large XIP file systems are now possible.
Compared to sharing large read-only file systems via DASD or Minidisk Cache (MDC), ext2 XIP in DCSS offers reductions in storage and CPU utilization. In the workloads measured for this report, we saw reductions of up to 67% in storage consumption, up to 11% in CPU utilization, and elimination of nearly all virtual I/O and real I/O. Further, compared to achieving data-in-memory via large Linux file caches, XIP in DCSS offers savings in storage, CPU, and I/O.
Introduction
With z/VM 5.4 the restriction of having to define Discontiguous Saved Segments (DCSSs) below 2 GB is removed. The new support lets a DCSS be defined in storage up to the 512 GB line.Though the maximum size of a DCSS remains 2047 MB, new Linux support lets numerous DCSSs defined contiguously be used together as one large block device. We call such contiguous placement stacking and we call such DCSSs stacked DCSSs. The Linux support for this is available from the features branch of the git390 repository found at "git://git390.osdl.marist.edu/pub/scm/linux-2.6.git features". Customers should check with specific distributions' vendors for information about availability in future distributions.
This article evaluates the performance benefits when Linux virtual machines share read-only data in stacked DCSSs. This evaluation includes measurements that compare storing shared read-only data in a DCSS to storing shared read-only data on DASD, or in MDC, or in the individual servers' Linux file caches.
Background
Both z/VM and Linux have made recent improvements to enhance their DCSS support for larger Linux block devices, Linux filesystems, and Linux swap devices.
With z/VM 5.4, a DCSS can be defined in guest storage up to but not including 512 GB. For information on how to define a DCSS in CP, see Chapter 1 of z/VM: Saved Segments Planning and Administration.
Additionally, Linux has added support to exploit stacked DCSSs as one large block device. Although z/VM continues to restrict the size of a DCSS to 2047 MB, this support removes the 2047 MB size restriction from Linux. Note that for Linux to combine the DCSSs in this way, the DCSSs must be defined contiguously. Linux cannot combine discontiguous DCSSs into one large block device.
For Linux to use a DCSS, it must create tables large enough to map memory up to and including the highest DCSS it is using. Linux supports a mem=xxx kernel parameter to size these tables to span the DCSSs being used. For more information on how to extend the Linux address space, see Chapter 33, Selected Kernel Parameters, of Device Drivers, Features and Commands.
The Linux kernel requires 64 bytes of kernel memory for each page defined in the mem=xxx statement. For example, a Linux guest capable of mapping memory up to the 512 GB line will need 8 GB of kernel memory to construct the map. Defining the stacked DCSSs lower in guest storage will reduce the amount of kernel memory needed to map them.
DCSS Type: SN versus SR
There are two primary methods for defining a segment for Linux usage. They are SN (shared read/write access) and SR (shared read-only access). The following table lists a few trade offs for SN and SR.
| DCSS Attribute | SN: Shared R/W | SR: Shared R/O | |
| Initial elapsed time to populate the DCSS with the files to be shared | faster (no DASD I/O necessarily) | slower (DASD I/O required) | |
| File system loaded into DCSSs gets written to z/VM spool | no | yes | |
| Spool processing for DCSS can delay other spool activity | no | yes | |
| Note: A file system built in an SN segment does not survive a z/VM IPL. | |||
Method
Three separate Apache workloads were used to evaluate the system benefits experienced when Linux stacked-DCSS exploitation was applied to a Linux-file-I/O-intensive workload running in several different base case configurations.
The first base-case environment studied is a non-cached virtual I/O environment in which the files served by Apache reside on minidisk and, due to disabling of MDC and defining the virtual machine size small enough to disable its Linux file cache, the z/VM system is constrained by real I/O.
The second base-case environment studied is the MDC environment. We attempted to size MDC in such a way that the majority, if not all, of the served files would be found in MDC. The number of servers was chosen in such a way that paging I/O would not be a constraining factor.
The last base-case environment studied is a Linux file cache (LFC) environment. The Linux servers are sized sufficiently large so that the served files find their way into, and remain in, the Linux file cache. Central storage is sized sufficiently large to hold all user pages.
The following table contains the configuration parameters for the three base-case environments.
Apache workload parameters for
various base-case environments
| Attribute or parameter | Non-cached virtual I/O environment | MDC environment | LFC environment |
| Processors | 4 | 4 | 3 |
| Central Memory | 10 GB | 8 GB | 64 GB |
| XSTORE | OFF | 2 GB | 2 GB |
| PAGE slots | 10378K | 10378K | 10378K |
| MDC | OFF | 6 GB (capped) | ON (default) |
| Server virtual machines | 16 | 4 | 6 |
| Client virtual machines | 1 | 2 | 3 |
| Client connections per server | 1 | 1 | 1 |
| Number of 1 MB HTML files | 3000 (3 GB) | 5000 (5 GB) | 10000 (10 GB) |
| Files reside during measurement | Minidisk | MDC | Linux file cache |
| Server virtual memory | 512 MB | 512 MB | 10 GB |
| Client virtual memory | 1 GB | 1 GB | 1 GB |
| Server virtual processors | 1 | 1 | 1 |
| Client virtual processors | 3 | 1 | 1 |
|
Notes:
System Model: 2094-719 DASD subsystem: 2105-E8, 8 GB, 4 FICON chpids Linux device driver: SSCH Minidisk file system: 10 GB residing on five 2-GB minidisks, mounted ext3 ro, five mount points | |||
For each of the three base-case configurations above, to construct a corresponding DCSS comparison case, the 10 GB file system was copied from DASD to an XIP-in-DCSS file system and mem=25G was added to the Linux kernel parameter file to extend the Linux kernel address space.
To provide storage for the XIP-in-DCSS file system, six DCSSs, each 2047 MB (x'7FF00' pages) in size, were defined contiguously in storage to hold 10 GB worth of files to be served by Apache. The first segment starts at the 12 GB line and runs for 2047 MB. The next five segments are stacked contiguously above the first. This excerpt from QUERY NSS MAP ALL illustrates the segments used. The output is sorted in starting-address order, so the reader can see the contiguity.
For this report, all of the segments were defined as SN.
The DCSS file system was mounted as read-only ext2 with execute-in-place (XIP) technology. Using XIP lets Linux read the files without copying the file data from the DCSS to primary memory. As the report shows later, this offers opportunity for memory savings.
For most real customer workloads using shared read-only file systems, it is likely the workload will reference only some subset of all the files actually present in the shared file system. Therefore, for each DCSS measurement, we copied all 10,000 of our ballast files into the DCSS, even though each measurement actually touched only a subset of them.
Finally, for each run that used any kind of data-in-memory technique (MDC, LFC, DCSS), the run was primed before measurement data were collected. By priming we mean that the workload ran unmeasured for a while, so as to touch each file of interest and thereby load it into memory, so that once the measurement finally began, files being touched would already be in memory. For the DCSS runs, we expected that during priming, CP would page out the unreferenced portions of the DCSSs.
Results and Discussion
Non-Cached Virtual I/O versus DCSS
Table 1 compares the non-cached virtual I/O environment to its corresponding DCSS environment.
Table 1. Non-Cached Virtual I/O versus DCSS
| Apache HTTP files | Non-cached virtual I/O | DCSS | ||
| Run ID | DASDGR00 | DCSSGR00 | Delta | Pct |
| Tx/sec (p) | 84.7 | 106.9 | 22.2 | 26.2 |
| Total Util/Proc (p) | 63.8 | 87.8 | 24.0 | 37.6 |
| Virtual I/O Rate (p) | 436 | 14 | -404 | -96.7 |
| DASD Paging Rate* (p) | 0.0 | 1095.0 | 1095.0 | **** |
| DASD I/O Rate (p) | 465 | 434 | -31 | -6.7 |
| Apache server I/O Wait (p) | 78 | 0 | -78 | -100.0 |
| Resident Pages Total (p) | 2206116 | 409761 | -1796355 | -81.4 |
| Resident Pages DASD (p) | 33 | 1949178 | 1949145 | 99.9 |
| Resident Shared Frames (p) | 5379 | 2133241 | 2127862 | 396 |
| DASD service time** msec (p) | 7.1 | .4 | -6.7 | -94.4 |
| DASD response time** msec(p) | 31.2 | .4 | -30.8 | -98.7 |
| DASD wait queue (p) | 1.9 | 0 | -1.9 | -100.0 |
|
Notes: (p) = Data taken from Performance Toolkit;
Resident Pages Total = total number of user pages in central storage;
Resident Pages DASD = total number of pages on paging DASD;
Resident Shared Frames = total number of shared frames
in central storage.
* This is the paging rate. The paging DASD I/O rate is lower because it takes into account I/O chaining. ** Average for the 5 user volumes that contain the URL files Configuration: Processor Model 2094-719; Processors 4; Central Storage 10G; XSTORE OFF; MDC OFF; 16 servers (512M); 1 client (1G); Apache files 3000 | ||||
The base measurement was constrained by real I/O. The Apache servers were waiting on minidisk I/O 78% of the time. The DASD I/O rate is slightly higher than the virtual I/O rate because CP monitor is reading performance data. The average DASD response time is greater than the DASD service time. Additionally, the wait queue is not zero. This all demonstrates the workload is constrained by real I/O.
Switching to an XIP-in-DCSS file system increased the transaction rate by 26.2%. Several factors contributed to the increase. The virtual I/O rate decreased by 96.7% because the URL files resided in shared memory. This can be seen by the increase in resident shared pages to approximately 8 GB. Server I/O wait disappeared completely. The average DASD response time and average service time reduced by 98.7% and 94.4%, respectively. Additionally, the DASD queue length decreased by 100%. All of this illustrates the DASD I/O constraint is eliminated when the URL files reside in shared memory.
The servers used most of their 512 MB virtual memory to build the page and segment tables. Approximately 400 MB of kernel memory was needed to build the page and segment tables for 25 GB of virtual memory.
Paging DASD I/O increased in the DCSS environment. It was observed that as the measurement progressed, paging I/O was decreasing suggesting that CP was moving the unreferenced pages to paging DASD. Thus, the DCSS run became constrained by paging DASD I/O.
Total processor utilization increased from 63.8 to 87.8%. This was attributed to the reduction in virtual I/O and corresponding real I/O to user volumes. CPU time per transaction increased in the DCSS case because CP was managing an additional 10 GB of shared memory.
MDC versus DCSS
Table 2 compares the base-case MDC environment to its corresponding DCSS environment.
| Apache HTTP files | MDC | DCSS | ||
| Run ID | MDC0GR03 | DCSSGR07 | Delta | Pct |
| Tx/sec (p) | 188.8 | 229.8 | 41.0 | 21.7 |
| CP msec/Tx (p) | 6.5 | 5.8 | -0.7 | -10.8 |
| Emul msec/Tx (p) | 12.3 | 11.2 | -1.1 | -9.2 |
| Total Util/Proc (p) | 90.9 | 94.6 | 3.7 | 4.1 |
| Virtual I/O Rate (p) | 957 | 8 | -949 | -99.2 |
| DASD Avoid Rate (p) | 927 | .2 | -926.8 | -100.0 |
| DASD paging rate* (p) | 0.0 | 81.1 | 81.1 | **** |
| DASD I/O Rate (p) | 354 | 40.8 | -313.2 | -88.5 |
| Resident Pages Total (p) | 734998 | 148236 | -586762 | -79.8 |
| Resident Pages DASD (p) | 0 | 517022 | 517022 | **** |
| Resident Shared Frames (p) | 5379 | 1881079 | 1875700 | 34870.8 |
|
Notes: See footnotes in Table 1
for data definitions.
Configuration: Processor Model 2094-719; Processors 4; Central Storage 8G; XSTORE 2 GB; MDC 6G (capped); 4 servers (512M); 2 client (1G); Apache files 5000 | ||||
In the base measurement, unexpected DASD I/O caused by the MDC problem prevented the run from reaching 100% CPU utilization. This I/O was unexpected because we had configured the measurement so that CP had enough available pages to hold all of the referenced URL files in MDC. As a consequence, this base case measurement did not yield optimum throughput for its configuration.
The throughput increased by 21.7% in the DCSS environment. Several factors contributed to the benefit. The virtual I/O rate decreased by 99.1% because the URL files resided in shared memory. This can be seen by the increase in resident shared pages to approximately 7 GB. The other factor is the base measurement did not yield optimum results.
The DCSS run was nearly 100% CPU busy, but unexpected paging DASD I/Os prevented it from reaching an absolute 100%. CP was paging to move the unreferenced URL files out of storage.
Overall, by eliminating a majority of the virtual I/O, processor utilization increased by 4.1% and CP msec/tx and emulation msec/tx decreased by 10.8% and 9.2% respectively.
In the special studies section, two additional pairs of MDC-vs.-DCSS measurements were completed. In the first pair, we increased the number of servers from 4 to 12. In the second pair, we both increased the number of servers from 4 to 12 and decreased central storage from 8 GB to 6 GB.
LFC versus DCSS
Table 3 compares the Linux file cache environment to its corresponding DCSS environment.
Table 3. Linux File Cache versus DCSS
| Apache HTTP files | Linux File Cache | DCSS | ||
| Run ID | LXCACHE1 | DCSSLFC1 | Delta | Pct |
| Tx/sec (p) | 149.5 | 157.4 | 8.0 | 5.3 |
| CP msec/Tx (p) | 6.9 | 6.3 | -0.6 | -8.2 |
| Emul msec/Tx (p) | 14.2 | 13.3 | -0.9 | -6.2 |
| Total Util/Proc (p) | 98.7 | 98.6 | -0.1 | -0.1 |
| Resident Pages Total (p) | 15666025 | 4018575 | -11647450 | -74.3 |
| Resident Pages All (p) | 16067050 | 4018575 | -12048475 | -75.0 |
| Resident Shared Frames (p) | 696 | 2665862 | 2665166 | **** |
|
Notes: See footnotes in Table 1
for data definitions.
Configuration: Processor Model 2094-719; Processors 3; Central Storage 64G; XSTORE 2 GB; ON (default); 6 servers (10G); 3 client (1G); Apache files 10000 | ||||
In the base measurement, all of the URL files reside in the Linux file cache of each server. In the DCSS environment the URL files reside in the XIP-in-DCSS file system.
The throughput increased by 5.3% in the DCSS environment, but the significant benefit was the reduction in memory. In the DCSS environment the number of resident pages decreased by 75.0% or approximately 46 GB. This is because when a read-only file system is mounted with the option -xip, the referenced data is never inserted into the six Linux server file caches.
CP msec/tx and emulation msec/tx decreased slightly because both CP and Linux were managing less storage.
In the special studies section a pair of measurements was completed to isolate and study the effect of the -xip option when using DCSS file systems.
Special Studies
MDC versus DCSS, More Servers
Table 4 compares an adjusted MDC run to its corresponding DCSS case. The MDC run is like the MDC standard configuration described above, with the number of servers increased from 4 to 12. We added servers to try to drive up CPU utilization for the MDC case.
Table 4. MDC versus DCSS with 12 servers
| Apache HTTP files | MDC | DCSS | ||
| Run ID | MDC0GR05 | DCSSGR05 | Delta | Pct |
| Tx/sec (p) | 181.6 | 221.4 | 39.9 | 22.0 |
| CP msec/Tx (p) | 6.6 | 6.2 | -0.4 | -5.9 |
| Emul msec/Tx (p) | 14.0 | 12.2 | -1.8 | -13.1 |
| Total Util/Proc (p) | 89.4 | 95.7 | 6.3 | 7.0 |
| Virtual I/O Rate (p) | 874 | 13 | -861 | -98.5 |
| DASD paging rate* (p) | 1.2 | 668.0 | 667.0 | **** |
| Resident Pages Total (p) | 1732962 | 229648 | -1503314 | -86.7 |
| Resident Shared Frames (p) | 1070 | 1791124 | 1790054 | **** |
|
Notes: See footnotes in Table 1
for data definitions.
Configuration: Processor Model 2094-719; Processors 4; Central Storage 8G; XSTORE 2 GB; MDC 6G (capped); 12 servers (512M); 2 client (1G); Apache files 5000 | ||||
In the base case, the unexpected DASD I/O caused by the MDC problem prevented the workload from reaching 100% CPU utilization.
The throughput increased by 22.0% in the DCSS environment. Several factors contributed to the benefit. The virtual I/O rate decreased by 98.5% because the URL files resided in shared memory. This can be seen by the increase in resident shared pages to approximately 7 GB. On average CP was paging approximately 667 pages/sec to paging DASD and it ran nearly 100% CPU utilization at steady state but the DASD I/O prevented it from reaching absolute 100%. Overall, eliminating virtual I/O and reducing the amount of memory management in both CP and Linux provided benefit in the DCSS environment.
Comparing this back to Table 2, we expected that as we added servers both measurements would reach 100% CPU busy. But again, in the base case the unexpected DASD I/O caused by the MDC problem prevented it from reaching 100% CPU busy. The DCSS run was nearly 100% CPU busy, but unexpected paging DASD I/Os prevented it from reaching an absolute 100%.
MDC versus DCSS, More Servers and Constrained Storage
Table 5 has a comparison of selected values for the MDC standard configuration except the number of servers was increased from 4 to 12 and central storage was reduced from 8 GB to 6 GB.
Table 5. MDC versus DCSS, 12 Servers, 6 GB Central Storage
| Apache HTTP files | MDC | DCSS | ||
| Run ID | MDCGR6G0 | DCSGR6G3 | Delta | Pct |
| Tx/sec (p) | 192.3 | 218.7 | 26.4 | 13.7 |
| CP msec/Tx (p) | 6.6 | 6.2 | -0.4 | -5.9 |
| Emul msec/Tx (p) | 13.8 | 12.2 | -1.7 | -11.9 |
| Total Util/Proc (p) | 92.9 | 94.5 | 1.6 | 1.7 |
| Virtual I/O Rate (p) | 916 | 14 | -902 | -98.5 |
| DASD paging rate* (p) | 246.7 | 969.2 | 722.5 | 292.9 |
| Resident Pages Total (p) | 1525860 | 241830 | -1284030 | -84.2 |
| Resident Shared Frames (p) | 55 | 1261542 | 1261487 | **** |
|
Notes: See footnotes in Table 1
for data definitions.
Configuration: Processor Model 2094-719; Processors 4; Central Storage 6G; XSTORE 2 GB; MDC 6G (capped); 12 servers (512M); 2 client (1G); Apache files 5000 | ||||
In the base case, the unexpected DASD I/O caused by the MDC problem prevented it from reaching the expected storage over commitment.
The throughput increased by 13.7% in the DCSS environment. Virtual I/O decreased by 98.5% because the URL files resided in shared memory. Resident pages decreased by approximately 5 GB while shared pages increased by approximately 5 GB. Paging DASD I/O increased because CP was managing an extra 10 GB of shared memory. The DCSS run was nearly 100% CPU busy at steady state. Paging I/O was preventing the system from reaching 100% CPU utilization.
Serving pages in the DCSS environment cost less than in the MDC environment. Emulation msec/tx decreased by 11.9%, because Linux memory management activity decreased, because DCSS XIP made it unnecessary to read the files into the Linux file cache. CP msec/tx decreased by 5.9% because CP handled less virtual I/O.
Comparing this back to Table 4, the throughput for the MDC case increased as memory reduced. Again, this is the MDC problem. The system is less affected by the MDC problem when memory contention increases. The throughput for the DCSS case decreased because paging DASD I/O increased.
DCSS non-xip versus DCSS xip
Table 6 has a comparison of selected values for DCSS without XIP versus DCSS with XIP, using the LFC configuration.
Table 6. DCSS without -xip option versus DCSS with -xip option
| Apache HTTP files mounted | non-xip | xip | ||
| Run ID | DCSSNXG4 | DCSSNXG2 | Delta | Pct |
| Tx/sec (p) | 150.0 | 156.1 | 10.1 | 6.9 |
| CP msec/Tx (p) | 6.7 | 6.4 | -0.4 | -5.5 |
| Emul msec/Tx (p) | 14.2 | 13.3 | -0.8 | -6.0 |
| Total Util/Proc (p) | 97.0 | 98.5 | 1.5 | 1.5 |
| DASD paging rate* (p) | 748.8 | 0.0 | -748.8 | -100.0 |
| Avail List >2 GB (p) | 4241 | 7836000 | 7831759 | **** |
| Avail List <2 GB (p) | 165 | 275000 | 274835 | **** |
| Resident Pages Total (p) | 15707550 | 4098300 | -11609250 | -73.9 |
| Resident Shared Frames (p) | 542928 | 2665817 | 2211889 | 391.0 |
|
Notes: See footnotes in Table 1
for data definitions.
Configuration: Processor Model 2094-719; Processors 3; Central Storage 64G; XSTORE 2 GB; ON (default); 6 servers (10G); 3 client (1G); Apache files 10000 | ||||
In the base case, CP was managing seven copies of the 10,000 URL files. In the DCSS XIP case, CP was managing one copy of the 10,000 URL files.
The throughput increased by 6.9%. This was attributed to the reduction in memory requirements that eliminated DASD paging. We estimated the memory savings to be about 47 GB, based on the available list having grown by 31 GB, plus 9 GB of Linux file cache space that one guest used at the beginning of the run to load the XIP file system and never released, plus 7 GB that MDC used during the XIP load and never released. The "Resident Pages Total" row of the table shows a decrease of 44 GB in resident pages, which roughly corroborates the 47 GB estimate. Because the partition was sized at 64 GB central plus 2 GB XSTORE, we roughly estimate the percent memory savings to be at least (44 GB / 66 GB) or 67%.
Again, CP msec/tx and emulation msec/tx were reduced because both CP and Linux were managing less memory.
Summary and Conclusions
Overall, sharing read-only data in a DCSS reduced system resource requirements.
Compared to the non-cached virtual I/O base case, the corresponding DCSS environment reduced the number of virtual I/Os and real I/Os. Paging DASD I/O increased but this was to be expected because CP was managing more memory.
In the MDC configurations, the corresponding DCSS environments reduced the number of virtual I/Os. Paging DASD I/O increased in all three configurations but this did not override the benefit.
In the Linux file cache configuration, where the Linux file cache was large enough to hold the URL files, the DCSS environment reduced the memory requirement.
Compared to not using XIP, the Linux mount option -xip eliminated the need to move the read-only shared data from the DCSS into the individual Linux server file caches. This reduced the memory requirement and memory management overhead.
It should be stressed that the mount option -xip was an important factor in all of our DCSS measurement results.
Back to Table of Contents.
z/VM TCP/IP Ethernet Mode
Abstract
In z/VM 5.4, the TCP/IP stack can operate an OSA-Express adapter in Ethernet mode (data link layer, aka layer 2, of the OSI model). When operating in Ethernet mode, the device is referenced by its Media Access Control (MAC) address instead of by its Internet Protocol (IP) address. Data is transported and delivered in Ethernet frames, providing the ability to handle protocol-independent traffic.
With this new function, the z/VM TCP/IP stack can operate a real dedicated OSA-Express adapter in Ethernet mode. More important, the new function also lets the z/VM TCP/IP stack use a virtual OSA NIC in Ethernet mode, coupled either to an Ethernet-mode guest LAN or to an Ethernet-mode VSWITCH.
We set up a z/VM TCP/IP stack with a virtual OSA NIC operating in Ethernet mode and coupled that virtual NIC to a VSWITCH running in Ethernet mode. Measurements comparing this configuration to the corresponding IP-mode setup show an increase in throughput from 0% to 13%, a decrease in CPU time from 0% to 7% for a low-utilization OSA card, and a decrease from 0% to 3% in a fully utilized OSA card.
Introduction
The new z/VM TCP/IP Ethernet mode support lets z/VM TCP/IP connect to an Ethernet-mode guest LAN or to an IPv4 or IPv6 Ethernet-mode virtual switch. Letting a z/VM TCP/IP stack connect to an Ethernet-mode virtual switch lets the stack participate in link aggregation configurations, thereby providing increased bandwidth and continuous network connectivity for the stack.
In z/VM 5.3 and earlier, z/VM TCP/IP operated an OSA-Express in only IP mode (except the virtual switch controller which already provided Ethernet mode). The new support lets a z/VM TCP/IP stack operate an OSA-Express in Ethernet mode, thereby letting z/VM TCP/IP connect to a physical LAN segment in Ethernet mode.
For more information on configuring the z/VM TCP/IP stack to communicate in Ethernet mode, see z/VM Connectivity.
Method
The measurements were performed using a TCP/IP stack connected to a virtual switch (client) on one LPAR communicating with a similar TCP/IP stack connected to a virtual switch (server) on another LPAR. The following figure shows the environment for the measurements referred to in this section.
Figure 1. z/VM TCP/IP Measurement Environment
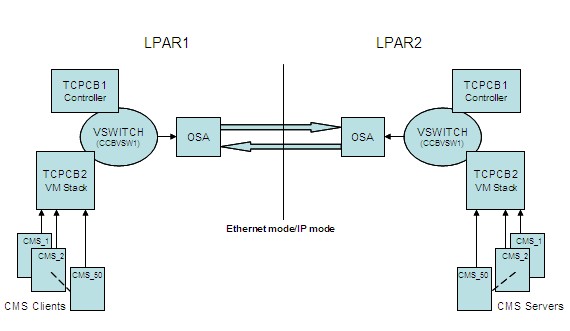
|
A complete set of CMS Application Workload Modeler (AWM) runs were done for request-response (RR) with a maximum transmission unit (MTU) size of 1492 and streaming (STR) with MTU sizes of 1492 and 8992.
For each MTU and workload combination above, runs were done simulating 1, 10 and 50 client/server connections between the client and server across LPARs.
For each configuration, a base case run was done with both virtual switches (client and server) operating in IP mode. A comparison case run was then done with both virtual switches operating in Ethernet mode.
All measurements were done on a 2094-733 with four dedicated processors in each of the two LPARs using OSA-Express2 1 Gigabit Ethernet (GbE) cards. CP Monitor data was captured and reduced using Performance Toolkit for VM. The results shown are from the LPAR on the client side.
Results and Discussion
The following tables display the results of the measurements. Within each table the data is shown first for the z/VM TCP/IP stack communicating in IP mode followed by the data for the z/VM TCP/IP stack communicating in Ethernet mode. The bottom section of each table shows the percent difference between the IP-mode and Ethernet-mode results.
| Client/Server connections | 01 | 10 | 50 |
| (run ID) | (vvsn0102) | (vvsn1002) | (vvsn5002) |
| 5.4 IP mode | |||
| MB/sec | 62.5 | 63.6 | 60.5 |
| Total CPU msec/MB | 6.86 | 10.02 | 14.61 |
| Emul CPU msec/MB | 2.70 | 4.29 | 7.09 |
| CP CPU msec/MB | 4.16 | 5.72 | 7.52 |
| Approx. OSA card utilization | 53% | 54% | 51% |
| 5.4 Ethernet mode | |||
| MB/sec | 67.1 | 71.7 | 67.0 |
| Total CPU msec/MB | 6.78 | 9.79 | 14.55 |
| Emul CPU msec/MB | 2.71 | 4.35 | 7.18 |
| CP CPU msec/MB | 4.07 | 5.44 | 7.37 |
| Approx. OSA card utilization | 57% | 60% | 57% |
| % diff | |||
| MB/sec | 7% | 13% | 11% |
| Total CPU msec/MB | -1% | -2% | 0% |
| Emul CPU msec/MB | 0% | 1% | 1% |
| CP CPU msec/MB | -2% | -5% | -2% |
| 2094-733; z/VM 5.4 | |||
As seen in Table 1, running in Ethernet mode shows a modest improvement in throughput and a slight decrease in CPU time in the case where the OSA card is not fully utilized.
| Client/Server connections | 01 | 10 | 50 |
| (run ID) | (vvsj0102) | (vvsj1002) | (vvsj5002) |
| 5.4 IP mode | |||
| MB/sec | 116.4 | 118 | 117.8 |
| Total CPU msec/MB | 5.58 | 6.50 | 6.84 |
| Emul CPU msec/MB | 2.23 | 2.75 | 2.87 |
| CP CPU msec/MB | 3.35 | 3.75 | 3.97 |
| Approx. OSA card utilization | 99% | 100% | 100% |
| 5.4 Ethernet mode | |||
| MB/sec | 116.4 | 117.9 | 117.8 |
| Total CPU msec/MB | 5.58 | 6.29 | 6.62 |
| Emul CPU msec/MB | 2.35 | 2.76 | 2.87 |
| CP CPU msec/MB | 3.24 | 3.53 | 3.75 |
| Approx. OSA card utilization | 99% | 100% | 100% |
| % diff | |||
| MB/sec | 0% | 0% | 0% |
| Total CPU msec/MB | 0% | -3% | -3% |
| Emul CPU msec/MB | 5% | 0% | 0% |
| CP CPU msec/MB | -3% | -6% | -6% |
| 2094-733; z/VM 5.4 | |||
Table 2 shows throughput is the same because the OSA cards are fully utilized in both cases, however, when running in Ethernet mode there is a slight decrease in CPU time.
| Client/Server connections | 01 | 10 | 50 |
| (run ID) | (vvrn0102) | (vvrn1002) | (vvrn5002) |
| 5.4 IP mode | |||
| Tx/sec | 1511.7 | 4286.8 | 6356.4 |
| Total CPU msec/Tx | .22 | .19 | .21 |
| Emul CPU msec/Tx | .10 | .11 | .12 |
| CP CPU msec/Tx | .12 | .09 | .09 |
| 5.4 Ethernet mode | |||
| Tx/sec | 1552.8 | 4368.5 | 6481.4 |
| Total CPU msec/Tx | .23 | .19 | .19 |
| Emul CPU msec/Tx | .10 | .10 | .11 |
| CP CPU msec/Tx | .13 | .08 | .08 |
| % diff | |||
| Tx/sec | 3% | 2% | 2% |
| Total CPU msec/Tx | 1% | -4% | -7% |
| Emul CPU msec/Tx | -3% | -2% | -6% |
| CP CPU msec/Tx | 4% | -6% | -8% |
| 2094-733; z/VM 5.4 | |||
The RR runs in Table 3 show a small improvement in throughput along with a decrease in CPU time when using Ethernet mode.
Performance Toolkit for VM
Performance Toolkit for VM can be used to determine whether a virtual switch is communicating in Ethernet mode.
Here is an example of the Performance Toolkit VNIC screen (FCX269) which shows a virtual switch in Ethernet mode. Ethernet mode is sometimes referred to as 'Layer 2' while IP mode is referred to as 'Layer 3'. In the screen below Ethernet mode is indicated by the number '2' under the column labeled 'L', where 'L' represents 'Layer'. For emphasis we have highlighted these fields in the excerpt.
FCX269  Run 2008/07/19 09:00:21         VNIC
                                        Virtual Network Device Activity
From 2008/07/19 08:52:37
To   2008/07/19 09:00:07
For    450 Secs 00:07:30                This is a performance report for GDLGPRF2
_____________________________________________________________________________________

 ____ .                 .        .    .                   .      .      .      .
                                                     <--- Outbound/s ---> <--- Inbou
      <---  LAN ID  --> Adapter  Base Vswitch  V      Bytes <  Packets  >  Bytes <
 Addr Owner    Name     Owner    Addr Grpname  S L T T_Byte T_Pack T_Disc R_Byte R_P
 <<  -----------------   System   --------------  >> 209510   3173     .0 75571k  50
 F000 SYSTEM   CCBVSW1  TCPCB2   F000 ........ X 2 Q 209510   3173     .0 75571k  50
Here is an example of the Performance Toolkit GVNIC screen (FCX268) which shows a virtual switch in IP mode. IP mode is indicated by the number '3' under the column labeled 'Tranp' (which is short for 'Transport mode'). For emphasis we have highlighted these fields in the excerpt.
FCX268  Run 2008/07/17 12:13:03         GVNIC
                                        General Virtual Network Device Description
From 2008/07/17 12:05:03
To   2008/07/17 12:13:03
For    480 Secs 00:08:00                This is a performance report for GDLGPRF2
____________________________________________________________________________________

 ____ .                 .        .    .          .     .
      <---  LAN ID  --> Adapter  Base Vswitch  V
 Addr Owner    Name     Owner    Addr Grpname  S Tranp  Type
 F000 SYSTEM   CCBVSW1  TCPCB2   F000 ........ X     3  QDIO
Summary and Conclusions
In the workloads we measured, z/VM TCP/IP running its virtual OSA-Express NIC in Ethernet mode provided data rate and OSA utilization improvements compared to running the virtual NIC in IP mode.
Based on this, and based on our previous Ethernet-mode evaluation and comparison, we believe similar results would be obtained for the case of z/VM TCP/IP running a real OSA-Express in Ethernet mode.
From a performance perspective, the workloads we ran revealed no "down side" to running the virtual NIC in Ethernet mode.
Back to Table of Contents.
z/VM TCP/IP Telnet IPv6 Support
Abstract
In z/VM 5.4, the TCP/IP stack provides a Telnet server and client capable of operating over an Internet Protocol Version 6 (IPv6) connection. This support includes new versions of the Pascal application programming interfaces (APIs) that let Telnet establish IPv6 connections.
Regression measurements showed that compared to z/VM 5.3 IPv4 Telnet, z/VM 5.4 IPv4 Telnet showed -8% to +3% changes in throughput and 3% to 4% increases in CPU utilization.
New-function measurements on z/VM 5.4 showed that compared to IPv4 Telnet, IPv6 Telnet showed increases from 12% to 23% in throughput and decreases in CPU utilization from 3% to 13%.
Combining these two scenarios showed that customers interested in migrating from z/VM 5.3 IPv4 Telnet to z/VM 5.4 IPv6 Telnet could expect increases from 4% to 16% in throughput and changes in CPU utilization from -6% to 1%.
Introduction
Prior to z/VM 5.4, z/VM Telnet was capable of handling only IPv4 connections. In z/VM 5.4, both the Telnet client and server are now capable of handling IPv6 connections. In addition, because Telnet is written in Pascal, new IPv6 versions of the Pascal APIs are provided.
The z/VM Telnet server uses the new IPv6 Pascal API whether the client is IPv4 or IPv6. If the address of the connection is an IPv4 address, it is converted to an IPv6-mapped IPv4 address and passed using the new APIs.
To demonstrate the effects of all of these changes, a suite of Telnet measurements was performed. The suite uses a single Linux guest on one LPAR to host Telnet clients directed toward a z/VM Telnet server on a different LPAR. By varying the number of clients, and the protocol (IPv4 or IPv6), and the level of the z/VM Telnet server, and by collecting throughput and CPU utilization information, the suite assessed the performance effects of the IPv6 changes.
No measurements were done to assess the z/VM IPv6 Telnet client.
Method
Using z/VM 5.3 and z/VM 5.4 Telnet servers, performance runs were executed to determine both the throughput and CPU utilization for Telnet connections using IPv4 and IPv6.
The following figure shows the environment used for the measurements.
Figure 1. Telnet IPv6 Environment
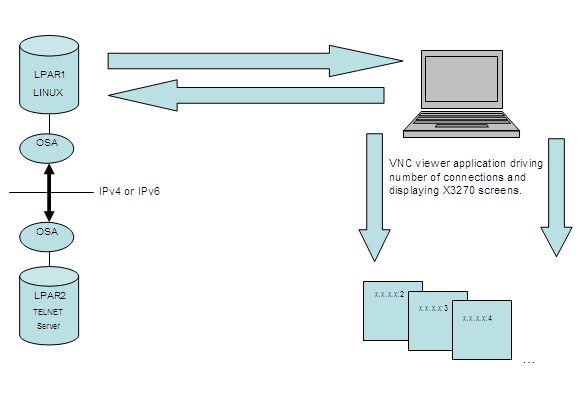
|
On LPAR1 a Linux guest running SUSE Linux Enterprise Server 10 SP1 (SLES10) is set up to run the Virtual Network Computing (VNC) server. The VNC server initiates the Telnet connections, using either IPv4 or IPv6, with the z/VM Telnet server on LPAR2. Both the Linux guest and z/VM TCP/IP stack communicate using direct OSA connections.
A workstation is set up to run a VNC client which, through the use of shell scripts, drives the number of Telnet connections and the workload within each connection. The VNC client passes the information to the VNC server in the Linux guest. Once the connection to the z/VM Telnet server is made, the VNC server then sends the data back to the workstation to be displayed.
The following three scenarios were run:
- z/VM 5.3 TCP/IP Telnet with IPv4 connections
- z/VM 5.4 TCP/IP Telnet with IPv4 connections
- z/VM 5.4 TCP/IP Telnet with IPv6 connections
All three scenarios were run with 10, 50, 100, and 200 connections. Each user initiated a Telnet connection, logged on, executed a workload and logged off. CP Monitor data was captured and reduced using Performance Toolkit for VM. The results shown are from the LPAR hosting the TCP/IP Telnet server.
Results and Discussion
The following tables display the results of the measurements. The 'Total Bytes/sec' data was retrieved from the Performance Toolkit for VM screen FCX222 'TCP/IP I/O Activity Log' and the CPU utilization information was retrieved from the FCX112 'General User Resource Utilization' screen.
It should be noted that the Performance Toolkit for VM screen FCX207 'TCP/IP TCP and UDP session log' incorrectly reports the longer IPv6 IP address and there are currently no screens in Performance Toolkit that display IPv6 addresses. This is a known requirement.
IPv4 Comparison
Table 1 shows the results comparing the z/VM 5.4 Telnet server to the z/VM 5.3 Telnet server using IPv4 connections. The purpose of this experiment was to show the effect of using the new IPv6 Pascal APIs in z/VM 5.4.
Table 1. z/VM 5.3 IPv4 - z/VM 5.4 IPv4
| Number of connections | 10 | 50 | 100 | 200 |
| 5.3 IPv4 | ||||
| Run ID | i43w0102 | i43w0502 | i43w1002 | i43w2002 |
| Total Bytes/Sec | 10806 | 30463 | 38001 | 43256 |
| Total CPU per MB trans (msec) | .141 | .135 | .136 | .136 |
| Emul CPU per MB trans (msec) | .071 | .069 | .069 | .069 |
| CP CPU per MB trans (msec) | .070 | .066 | .067 | .067 |
| 5.4 IPv4 | ||||
| Run ID | i44w0102 | i44w0502 | i44w1002 | i44w2002 |
| Total Bytes/Sec | 9927 | 28612 | 38035 | 44360 |
| Total CPU per MB trans (msec) | .147 | .140 | .140 | .143 |
| Emul CPU per MB trans (msec) | .077 | .070 | .070 | .072 |
| CP CPU per MB trans (msec) | .070 | .070 | .070 | .071 |
| % diff | ||||
| Total Bytes/Sec | -8% | -6% | .1% | 3% |
| Total CPU per MB trans | 4% | 4% | 3% | 4% |
| Emul CPU per MB trans | 8% | 1% | 1% | 4% |
| CP CPU per MB trans | 0% | 6% | 4% | 6% |
| 2094-733; z/VM 5.4 | ||||
The data shows there is a performance degradation in the number of bytes transmitted with the 10 and 50 connections and an overall 3% to 4% increase in CPU utilization for all of the test runs. While the throughput measurements for the smaller number of connections did not meet our expectations, the increase in CPU utilization is within criteria.
IPv6 Compared to IPv4
Table 2 shows the results comparing the z/VM 5.4 Telnet server using IPv6 connections to the z/VM 5.4 Telnet server using IPv4 connections.
Table 2. z/VM 5.4 IPv4 - z/VM 5.4 IPv6
| Number of connections | 10 | 50 | 100 | 200 |
| 5.4 IPv4 | ||||
| Run ID | i44w0102 | i44w0502 | i44w1002 | i44w2002 |
| Total Bytes/Sec | 9927 | 28612 | 38035 | 44360 |
| Total CPU per MB trans (msec) | .147 | .140 | .140 | .143 |
| Emul CPU per MB trans (msec) | .077 | .070 | .070 | .072 |
| CP CPU per MB trans (msec) | .070 | .070 | .070 | .071 |
| 5.4 IPv6 | ||||
| Run ID | i64w0102 | i64w0502 | i64w1002 | i64w2002 |
| Total Bytes/Sec | 11226 | 35222 | 43745 | 49588 |
| Total CPU per MB trans (msec) | .143 | .130 | .128 | .125 |
| Emul CPU per MB trans (msec) | .075 | .066 | .064 | .064 |
| CP CPU per MB trans (msec) | .068 | .064 | .064 | .061 |
| % diff | ||||
| Total Bytes/Sec | 13% | 23% | 15% | 12% |
| Total CPU per MB trans | -3% | -7% | -9% | -13% |
| Emul CPU per MB trans | -3% | -6% | -9% | -11% |
| CP CPU per MB trans | -3% | -9% | -9% | -14% |
| 2094-733; z/VM 5.4 | ||||
As seen from the results in the table, both the throughput and the CPU utilization show improvement when using IPv6.
Summary and Conclusions
As seen from the results, compared to z/VM 5.3, there is a small performance degradation when using IPv4 Telnet connections in z/VM 5.4. However, the performance results met our criteria and should not be a cause for concern.
The results for Telnet IPv6 exceeded our expectations and actually show an improvement in the performance measurements. This was unexpected based on results of our earlier performance measurements of z/VM 4.4.0 IPv6 support.
Back to Table of Contents.
CMS-Based SSL Server
Technology called Secure Sockets Layer (SSL) lets application programs use encrypted TCP connections to exchange data with one another in a secure fashion. On z/VM 5.3 and earlier, the z/VM TCP/IP stack used a Linux-based service machine to provide SSL function. In z/VM 5.4 IBM changed the SSL service machine to be based on CMS rather than on Linux.
IBM completed two performance evaluations of the z/VM 5.4 CMS-based SSL server. The first evaluation studied regression performance, that is, the performance of the z/VM 5.4 CMS-based server compared to the z/VM 5.3 Linux-based server, running workloads each SSL server could support. The second evaluation studied the z/VM 5.4 server alone, varying the server configuration so as to explore the performance implications of various configuration choices. For all measurements, IBM used a System z9 and its CP Assist for Cryptographic Function (CPACF) facility.
The regression study, focused on scaling, measured CPU cost for creating a new SSL connection and CPU cost for doing data transfer, at various numbers of existing connections. For the z/VM 5.3 Linux-based server, the study showed that as the number of existing connections increased, the CPU cost to create a new SSL connection did not increase significantly. It also showed that as the number of connections increased, the CPU cost per data transfer increased only slightly. Repeating these scenarios using the z/VM 5.4 CMS-based server showed that as the number of existing connections increased, the CPU cost to create a new SSL connection increased and the CPU cost per data transfer increased. In other words, the z/VM 5.4 CMS-based server does not scale as well as the z/VM 5.3 Linux-based server did.
IBM studied the z/VM 5.4 CMS-based server to find the reasons for these CPU cost increases. The CMS-based SSL server has a maximum session parameter that defines the maximum number of connections the SSL server will manage. When the server is started and no connections have been established yet, the server will allocate CMS threads equal to the maximum session parameter. Even at low numbers of connections, setting this value in the thousands can result in thousands of CMS threads. The cost in CMS to manage thousands of threads per process is not trivial. As the maximum session parameter increases, the CPU cost per connection increases. For optimum performance, IBM advises that customers set the SSL server's maximum session parameter to a minimum. IBM understands the requirement to offer some relief on this point.
To evaluate the performance implications of various configuration choices, IBM completed three sets of measurements. The first set compared implicit connections to explicit connections. The CPU cost to create an implicit connection was nearly identical to the cost to create an explicit connection. The second set compared the CPU costs of various key sizes (1K, 2K, and 4K). As the key size increased, the CPU cost to create a connection increased. The third set examined data transfer CPU cost as a function of cipher strength. During data transfer, the high cipher (3DES_168_SHA) was more efficient than the medium cipher (RC4_128_SHA), because in high cipher mode the SSL server can exploit the System z9's CPACF facility.
Update
IBM has addressed some of the SSL performance issues stated above. For more information, see SSL Multiple Server Support .
Back to Table of Contents.
z/VM Version 5 Release 3
The following sections discuss the performance characteristics of z/VM 5.3 and the results of the z/VM 5.3 performance evaluation.
Back to Table of Contents.
Summary of Key Findings
This section summarizes z/VM 5.3 performance with links that take you to more detailed information.
z/VM 5.3 includes a number of performance-related changes -- performance improvements, performance considerations, and changes that affect VM performance management.
Regression measurements comparing z/VM 5.3 back to z/VM 5.2 showed the following:
- Workloads and configurations that significantly exercise one or more of the z/VM 5.3 performance improvements generally showed improved performance in terms of reduced CPU usage and higher throughput. These cases are:
- All other measured workloads tended to experience somewhat reduced performance. CPU usage increases ranged from 1% to 5%.
Improved Real Storage Scalability: z/VM 5.3 includes several important enhancements to CP storage management: Page management blocks (PGMBKs) can now reside above the real storage 2G line, contiguous frame management has been further improved, and fast available list searching has been implemented. These improvements collectively resulted in improved performance in storage-constrained environments (throughput increased from 10.3% to 21.6% for example configurations), greatly increased the amount of in-use virtual storage that z/VM can support, and allowed the maximum real storage size supported by z/VM to be increased from 128 GB to 256 GB.
Memory Management: VMRM-CMM and CMMA: VM Resource Manager Cooperative Memory Management (VMRM-CMM) and Collaborative Memory Management Assist (CMMA) are two different approaches to enhancing the management of real storage in a z/VM system by the exchange of information between one or more Linux guests and CP. Performance improvements were observed when VMRM-CMM, CMMA, or the combination of VMRM-CMM and CMMA were enabled on the system. At lower memory over-commitment ratios, all three algorithms provided similar benefits. For the workload and configuration chosen for this study, CMMA provided the most benefit at higher memory over-commitment ratios.
Improved Processor Scalability: With z/VM 5.3, up to 32 CPUs are supported with a single VM image. Prior to this release, z/VM supported up to 24 CPUs. In addition to functional changes that enable z/VM 5.3 to run with more processors configured, a new locking infrastructure has been introduced that improves system efficiency for large n-way configurations. An evaluation study that looked at 6-way and higher configurations showed z/VM 5.3 requiring less CPU usage and achieving higher throughputs than z/VM 5.2 for all measured configurations, with the amount of improvement being much more substantial at larger n-way configurations. With a 24-way LPAR configuration, a 19% throughput improvement was observed.
Diagnose X'9C' Support: z/VM 5.3 includes support for diagnose X'9C' -- a new protocol for guest operating systems to notify CP about spin lock situations. It is similar to diagnose X'44' but allows specification of a target virtual processor. Diagnose X'9C' provided a 2% to 12% throughput improvement over diagnose X'44' for various measured Linux guest configurations having processor contention. No benefit is expected in configurations without processor contention.
Specialty Engine Support: Guest support is provided for virtual CPU types of zAAP (IBM System z Application Assist Processors), zIIP ( IBM z9 Integrated Information Processors), and IFL (Integrated Facilities for Linux) processors, in addition to general purpose CPs (Central Processors). These types of virtual processors can be defined for a z/VM user by issuing the DEFINE CPU command or placing the DEFINE CPU command in the directory. The system administrator can issue the SET CPUAFFINITY command to specify whether z/VM should dispatch a user's specialty CPUs on real CPUs that match their types (if available) or simulate them on real CPs. On system configurations where the CPs and specialty engines are the same speed, performance results are similar whether dispatched on specialty engines or simulated on CPs. On system configurations where the specialty engines are faster than CPs, performance results are better when using the faster specialty engines and scale correctly based on the relative processor speed. CP monitor data and Performance Toolkit for VM both provide information relative to the specialty engines.
HyperPAV Support: In z/VM 5.3, the Control Program (CP) can use the HyperPAV feature of the IBM System Storage DS8000 line of storage controllers. The HyperPAV feature is similar to IBM's PAV (Parallel Access Volumes) feature in that HyperPAV offers the host system more than one device number for a volume, thereby enabling per-volume I/O concurrency. Further, z/VM's use of HyperPAV is like its use of PAV: the support is for ECKD disks only, the bases and aliases must all be ATTACHed to SYSTEM, and only guest minidisk I/O or I/O provoked by guest actions (such as MDC full-track reads) is parallelized. Measurement results show that HyperPAV aliases match the performance of classic PAV aliases. However, HyperPAV aliases require different management and tuning techniques than classic PAV aliases did.
Virtual Switch Link Aggregation: Link aggregation is designed to allow you to combine multiple physical OSA-Express2 ports into a single logical link for increased bandwidth and for nondisruptive failover in the event that a port becomes unavailable. Having the ability to add additional cards can result in increased throughput, particularly when the OSA card is being fully utilized. Measurement results show throughput increases ranging from 6% to 15% for a low-utilization OSA card and throughput increases from 84% to 100% for a high-utilization OSA card, as well as reductions in CPU time ranging from 0% to 22%.
Back to Table of Contents.
Changes That Affect Performance
This chapter contains descriptions of various changes in z/VM 5.3 that affect performance. It is divided into three sections -- Performance Improvements, Performance Considerations, and Performance Management.
Back to Table of Contents.
Performance Improvements
The following items improve performance:
- Storage Management Improvements
- Collaborative Memory Management Assist
- Improved MP Locking
- Diagnose X'9C' Support
- Improved SCSI Disk Performance
- VM Guest LAN QDIO Simulation Improvement
- Virtual Switch Link Aggregation
Storage Management Improvements
z/VM 5.3 includes several important enhancements to CP storage management: Page Management Blocks (PGMBKs) can now reside above the real storage 2G line, contiguous frame management has been further improved, and fast available list searching has been implemented. These improvements resulted in improved performance in storage-constrained environments, greatly increased the amount of in-use virtual storage that z/VM can support, and allowed the maximum real storage size supported by z/VM to be increased from 128 GB to 256 GB. See Improved Real Storage Scalability for further discussion and performance results.
Collaborative Memory Management Assist
This new assist allows virtual machines to exploit the new Extract and Set Storage Attributes (ESSA) instruction to exchange information between the z/VM control program and the guest regarding the state and use of guest pages. This function requires z/VM 5.3, the appropriate hardware, and a Linux kernel that contains support for the Collaborative Memory Management Assist (CMMA). A performance evaluation was conducted to assess the relative merits of CMMA and VM Resource Manager Cooperative Memory Management (VMRM-CMM), another method for enhancing memory management of z/VM systems with Linux guests that first became available with z/VM 5.2. Performance improvements were observed when VMRM-CMM, CMMA, or the combination of VMRM-CMM and CMMA were enabled on the system. At lower memory over-commitment ratios, all three algorithms provided similar benefits. For the workload and configuration chosen for this study, CMMA provided the most benefit at higher memory over-commitment ratios. See Memory Management: VMRM-CMM and CMMA for further discussion and performance results.
Improved MP Locking
A new locking protocol has been implemented that reduces contention for the scheduler lock. In many cases where formerly the scheduler lock had to be held in exclusive mode, this is now replaced by holding the scheduler lock in share mode and holding the new Processor Local Dispatch Vector (PLDV) lock (one per processor) in exclusive mode. This reduces the amount of time the scheduler lock must be held exclusive, resulting in more efficient usage of large n-way configurations. See Improved Processor Scalability for further discussion and performance results.
Diagnose X'9C' Support
Diagnose X'9C' is a new protocol for guest operating systems to notify CP about spin lock situations. It is similar to diagnose X'44' but allows specification of a target virtual processor. Diagnose X'9C' provided a 2% to 12% throughput improvement over diagnose X'44' for various measured Linux guest configurations having processor contention. No benefit is expected in configurations without processor contention. Diagnose X'9C' support is also available in z/VM 5.2 via PTF UM31642. Linux and z/OS have both been updated to use Diagnose X'9C'. See Diagnose X'9C' Support for further discussion and performance results.
Improved SCSI Disk Performance
z/VM 5.3 contains several performance improvements for I/O to emulated FBA on SCSI volumes.
- z/VM now exploits the SCSI write-same function of the IBM 2105 and 2107 DASD subsystems, so as to accelerate the CMS FORMAT function for minidisks on SCSI volumes.
- CP modules that support SCSI were tuned to reduce path length for common kinds of I/O requests.
- For CP paging to SCSI volumes, the paging subsystem was changed to bypass FBA emulation and instead call the SCSI modules directly.
These changes resulted in substantial performance improvements for applicable workloads. See SCSI Performance Improvements for further discussion and performance results.
VM Guest LAN QDIO Simulation Improvement
The CPU time required to implement VM Guest LAN QDIO simulation has been reduced. We observed a 4.6% CPU usage decrease for an example workload that uses this connectivity intensively. In addition, the no-contention 64 GB Apache run shown in the Improved Real Storage Scalability discussion has improved performance in z/VM 5.3 due to this improvement.
Virtual Switch Link Aggregation
Link aggregation allows you to combine multiple physical OSA-Express2 ports into a single logical link for increased bandwidth and for nondisruptive failover in the event that a port becomes unavailable. Having the ability to add additional cards can result in increased throughput, particularly when the OSA card is being fully utilized. Measurement results show throughput increases ranging from 6% to 15% for a low-utilization OSA card and throughput increases from 84% to 100% for a high-utilization OSA card, as well as reductions in CPU time ranging from 0% to 22%. See Virtual Switch Link Aggregation for further discussion and performance results.
Back to Table of Contents.
Performance Considerations
These items warrant consideration since they have potential for a negative impact to performance.
- Performance APARs
- Large VM Systems
Performance APARs
There are a number of z/VM 5.3 APARs that correct problems with performance or performance management data. Review these to see if any apply to your system environment.
Large VM Systems
This was first listed as a consideration for z/VM 5.2 and is repeated here. Because of the CP storage management improvements in z/VM 5.2 and z/VM 5.3, it becomes practical to configure VM systems that use large amounts of real storage. When that is done, however, we recommend a gradual, staged approach with careful monitoring of system performance to guard against the possibility of the system encountering other limiting factors.
With the exception of the potential PGMBK constraint, all of the specific considerations listed for z/VM 5.2 continue to apply.
Back to Table of Contents.
Performance Management
These changes affect the performance management of z/VM:
- Monitor Changes
- Command and Output Changes
- Effects on Accounting and Performance Data
- Performance Toolkit for VM Changes
Monitor Changes
There were several changes and areas of enhancements affecting the CP monitor data for z/VM 5.3 involving system configuration information and additional data collection. As a result of these changes, there are twelve new monitor records, a new monitor domain, and several changed records. The detailed monitor record layouts are found on our control blocks page.
In z/VM 5.3, support is provided for virtual CPU types of zAAP (IBM System z Application Assist Processor), zIIP (IBM System z9 Integrated Information Processor), and IFL (Integrated Facility for Linux), in addition to general-purpose CPs (Central Processors). To assist in monitoring these specialty engines two new monitor records, Domain 0 Record 24 (Scheduler Activity (per processor type)) and Domain 2 Record 12 (SET CPUAFFINITY Changes) have been added. In addition, the following monitor records have been updated to specify the processor type:
| Monitor Record | Record Name |
|---|---|
| Domain 0 Record 1 | System Data (per processor) |
| Domain 0 Record 2 | Processor Data (per processor) |
| Domain 0 Record 4 | Real Storage Data (per processor) |
| Domain 0 Record 5 | Expanded Storage Data (per processor) |
| Domain 0 Record 10 | Scheduler Activity (per processor) |
| Domain 0 Record 11 | Processor Communication Activities (per processor) |
| Domain 0 Record 12 | User Wait States |
| Domain 0 Record 13 | Scheduler Activity (per processor) |
| Domain 0 Record 15 | Logical CPU Utilization Data (global) |
| Domain 0 Record 16 | CPU Utilization in a Logical Partition |
| Domain 0 Record 17 | Physical CPU Utilization Data for LPAR Management |
| Domain 0 Record 22 | System Execution Space (per processor) |
| Domain 1 Record 4 | System Configuration Data |
| Domain 1 Record 5 | Processor Configuration (per processor) |
| Domain 1 Record 7 | Memory Configuration Data |
| Domain 1 Record 15 | Logged on Users |
| Domain 2 Record 4 | Add User to Dispatch List |
| Domain 2 Record 5 | Drop User from Dispatch List |
| Domain 2 Record 6 | Add User to Eligible List |
| Domain 2 Record 9 | SET SHARE Changes |
| Domain 3 Record 2 | Real Storage Activity (per processor) |
| Domain 3 Record 20 | System Execution Space (per processor) |
| Domain 4 Record 2 | User Logoff Data |
| Domain 4 Record 3 | User Activity Data |
| Domain 4 Record 4 | User Interaction Data |
| Domain 4 Record 5 | DEFINE CPU |
| Domain 4 Record 6 | DETACH CPU |
| Domain 4 Record 7 | DEFINE CPU n AS |
| Domain 4 Record 8 | User Transaction End |
| Domain 4 Record 9 | User Activity Data at Transaction End |
| Domain 4 Record 10 | User Interaction Data at Transaction End |
| Domain 5 Record 1 | Vary On Processor |
| Domain 5 Record 3 | Processor Data (per processor) |
In z/VM 5.3, CP can support up to 32 real processors in a single z/VM image. As a result, the scheduler lock has been changed from an exclusive spin lock to a shared/exclusive spin lock to help reduce scheduler lock contention. To assist in debugging spin lock contention problems, the Domain 0 Record 23 (Formal Spin Lock Data (Global)) record has been added to Monitor along with updates to the Domain 0 Record 10 (Scheduler Activity (Global)) record, the Domain 0 Record 13 (Scheduler Activity (per processor)) record, and the Domain 4 Record 3 (User Activity Data) record.
Support was added in z/VM 5.2 to exploit large real memory by allowing use of memory locations above the 2G address line, thus helping to reduce the constraints on storage below the 2G address line. The constraints on storage below the 2G address line are further reduced in z/VM 5.3 by moving the page management blocks (PGMBKs) above 2G. In addition, CP has been enhanced to improve the management of contiguous frames of host real storage. These changes resulted in updates to the Domain 0 Record 3 (Real Storage Data (Global)), Domain 3 Record 1 (Real Storage Management (Global)), Domain 3 Record 2 (Real Storage Activity (Per Processor)), and Domain 3 Record 3 (User Activity Data) records.
The Hyper Parallel Access Volume (HyperPAV) function, optionally provided by the the IBM System Storage DS8000 disk storage systems, is now supported in z/VM 5.3. z/VM provides support of HyperPAV volumes as linkable minidisks for guest operating systems, such as z/OS, that exploit the HyperPAV architecture. This support is also designed to transparently provide the potential benefits of HyperPAV volumes for minidisks owned or shared by guests that do not specifically exploit HyperPAV volumes, such as Linux and CMS. To allow for monitoring of the HyperPAV support, four new monitor records are added: Domain 1 Record 20 (HyperPAV Pool Definition), Domain 6 Record 28 (HyperPAV Pool Activity), Domain 6 Record 29 (HyperPAV Pool Creation), and Domain 6 Record 30 (LSS PAV Transition). Also, the following records are enhanced: Domain 1 Record 6 (Device Configuration Data), Domain 6 Record 1 (Vary On Device - Event Data), Domain 6 Record 3 (Device Activity), and Domain 6 Record 20 (State Change).
A new monitor domain, Domain 8 - Virtual Network Domain, has been added to control and record monitor activity for virtual network resources. Monitoring of virtual networks is not enabled automatically using the CP MONITOR START command. The CP MONITOR SAMPLE ENABLE command with either the ALL or NETwork options must be issued to signal collection of virtual network sample data and the CP MONITOR EVENT DISABLE command with either the ALL or NETwork options must be issued to end the collection of virtual network event data. There are currently three new records in this domain: Domain 8 Record 1 (Virtual NIC Session Activity), Domain 8 Record 2 (Virtual Network Guest Link State Change - Link Up), and Domain 8 Record 3 (Virtual Network Guest Link State Change - Link Down).
A Simple Network Management Protocol (SNMP) agent is provided in z/VM 5.3 to perform information management functions, such as gathering and maintaining performance information and formatting and passing this data to the client when requested. This information is collectively called the Management Information Base (MIB) and is captured in the Domain 6 Record 21 (Virtual Switch Activity), Domain 6 Record 22 (Virtual Switch Failover), and Domain 6 Record 23 (Virtual Switch Recovery) records. In addition, the MIB data is used in the new Domain 8 Record 2 (Virtual Network Guest Link State Change - Link Up) record and the Domain 8 Record 3 (Virtual Network Guest Link State Change - Link Down) record.
In z/VM 5.3 the Virtual Switch, configured for Ethernet frames (layer 2 mode), now supports aggregating of 1 to 8 OSA-Express 2 adapters with a switch that supports the IEEE 802.3ad Link Aggregation specification. The following records are updated to contain link aggregation monitor information: Domain 6 Record 21 (Virtual Switch Activity), Domain 6 Record 22 (Virtual Switch Failover), and Domain 6 Record 23 (Virtual Switch Recovery). Also, the new Domain 8 Record 1 (Virtual Network NIC Session Activity) record contains this information as well.
Lastly, two new monitor records -- Domain 5 Record 11 (Instruction Counts (Per Processor)) and Domain 5 Record 12 (Diagnose Counts (Per Processor)) -- have been added to provide additional debug information for system and performance problems.
Command and Output Changes
The CP MONWRITE utility has been updated in z/VM 5.3 to allow for better management of monitor data (MONDATA) files. A new CLOSE option was added to allow a MONDATA file to automatically be closed, saved to disk, and a new file opened at an interval specified by the user. Addtionally, the user can specify the name of a CMS EXEC file that will be called once the current MONDATA file is closed, allowing for the manipulation or cleanup of existing MONDATA files.
Previous to z/VM 5.3, on systems with a large number of devices defined, CP MONITOR data records would sometimes be missing for some of the devices. This often occurred because the MONITOR SAMPLE CONFIG SIZE was too small. In z/VM 5.3, when using the MONWRITE utility, a new message: HCPMOW6273A - WARNING: SAMPLE CONFIGURATION SIZE TOO SMALL is now issued when the connection to MONITOR is made indicating this condition. To increase the size of the SAMPLE CONFIGURATION area, use the CP MONITOR SAMPLE CONFIG SIZE option.
For information on the CP MONWRITE Utility, see the CP Commands and Utilities Reference.
Effects on Accounting and Performance Data
Accounting support has been added for specialty engines. Two new fields (Virtual CPU type code and Real CPU type code) have been added to the Type 1 accounting records that are cut for each virtual CPU that is defined in each virtual machine. A new field (Secondary CPU capability) was added to the Type D accounting record so as to cover the case where a specialty engine runs at a different speed from normal processors. Finally, the ACCOUNT utility has been updated to include two new options (VCPU and RCPU) that can be used to limit its processing of Type 1 accounting records to those that match the specified virtual or real CPU type.
See chapter 8 in CP Planning and Administration for further information on the accounting record changes and chapter 3 in CMS Commands and Utilities Reference for further information on the ACCOUNT utility.
In z/VM 5.2.0, CP time was charged to the VM TCP/IP controller while handling real OSA port communications. In z/VM 5.3.0, VSwitch was changed to handle the OSA port communications under SYSTEMMP. This time will now be reported under System time in Performance Toolkit reports. SYSTEMMP is more efficient, resulting in less CPU time per transaction than was seen with z/VM 5.2.0.
Performance Toolkit for VM Changes
Performance Toolkit for VM has been enhanced in z/VM 5.3 to include the following new reports:
Performance Toolkit for VM: New Reports
| Name | Number | Type | Title |
| LOCKLOG | FCX265 | by time | Spin Lock Log (with breakdown by lock name) |
| GVSWITCH | FCX266 | by device | General Virtual Switch Description |
| EVSWITCH | FCX267 | by device | Extended Virtual Switch Activity |
| GVNIC | FCX268 | by device | General Virtual Network Device Description |
| VNIC | FCX269 | by device | Virtual Network Device Activity |
| EVNIC | FCX270 | by device | Virtual Network Device Activity - Extended |
In addition, a number of existing reports have been updated as part of the support for specialty engines. The CPU, LPAR, LPARLOG, and PROCLOG reports were updated to include the CPU type. The LPAR report was updated to include a table showing information for all physical processors in the total system configuration, broken down by CPU type. The SYSCONF report was updated to show the number and status of all processors in the LPAR configuration, broken down by CPU type. See Specialty Engine Support for example reports and discussion of their use.
Back to Table of Contents.
New Functions
This section contains performance evaluation results for the following new functions:
- Improved Real Storage Scalability
- Improved Processor Scalability
- Diagnose X'9C' Support
- Specialty Engine Support
- SCSI Performance Improvements
- z/VM HyperPAV Support
- Virtual Switch Link Aggregation
Back to Table of Contents.
Improved Real Storage Scalability
Abstract
z/VM 5.3 includes several important enhancements to CP storage management. Page management blocks (PGMBKs) can now reside above the real storage 2G line, contiguous frame management has been further improved, and fast available list searching has been implemented. These improvements collectively resulted in improved performance in storage-constrained environments (throughput increased from 10.3% to 21.6% for example configurations), greatly increased the amount of in-use virtual storage that z/VM can support, and allowed the maximum real storage size supported by z/VM to be increased from 128 GB to 256 GB.
Introduction
In z/VM 5.2, substantial changes were made to CP storage management so that most pages could reside in real (central) storage frames above the 2G line. These changes greatly improved CP's ability to effectively use large real storage sizes (see Enhanced Large Real Storage Exploitation for results and discussion).
With z/VM 5.3, additional CP storage management changes have been made to further improve real storage scalability. The most important of these changes is to allow CP's page management blocks (PGMBKs) to reside above the 2G line in real storage. In addition, the management of contiguous frames has been further improved and the search for single and contiguous frames on the available list is now much more efficient. These changes have resulted in the following three benefits:
- The performance of storage-constrained environments has been improved.
- The amount of in-use virtual storage that can be supported by z/VM has been greatly increased.
- The amount of real storage supported by z/VM has been increased from 128G to 256G.
This section provides performance results that illustrate and quantify each of these three benefits.
Improved Performance for Storage-Constrained Environments
The z/VM 5.3 storage management changes have resulted in improved performance relative to z/VM 5.2 for storage-constrained environments. This is illustrated by the measurement results provided in this section.
Method
The Apache Workload was measured on both z/VM 5.2 and z/VM 5.3 in a number of different configurations that include examples of low and high storage contention and examples of small and large real storage sizes. The amount of storage referenced by the workload was controlled by adjusting the number of Apache servers, the virtual storage size of those servers, and the size/number of URL files being randomly requested from those servers.
Results and Discussion
The results are summarized in Table 1 as percentage changes from z/VM 5.2. For each measurement pair, the number of expanded storage plus DASD pageins per CPU-second for the z/VM 5.2 measurement is used as a measure of real storage contention.
Table 1. Performance Relative to z/VM 5.2
| Configuration | 1 | 2 | 3 | 4 |
| Real Storage | 3G | 64G | 64G | 128G |
| Contention (z/VM 5.2 Pageins/CPU-sec) | 2159 | 0 | 352 | 291 |
| Expanded Storage | 4G | 2G | 2G | 2G |
| Processor Type/Model | 2084-B16 | 2094-S38 | 2094-S38 | 2094-S38 |
| Processors | 3 | 3 | 3 | 6 |
| Apache Clients/Servers | 2/12 | 3/6 | 3/6 | 4/13 |
| Apache Server Virtual Size | 1G | 10G | 10G | 10G |
| Apache Files | 600 | 2 | 10000 | 10000 |
| Apache File Size | 1M | small | 1M | 1M |
| Minidisk Cache | off | default | default | default |
| 520 Runid | APMTA193 | APT064G2 | APT064G1 | APT128G0 |
| 530 Runid | APMU5180 | APU064G2 | APU064G1 | APU128G0 |
| Throughput | 10.3% | 1.0% | 15.5% | 21.6% |
| Total CPU/tx | -9.5% | -0.9% | -12.7% | -19.4% |
| Virtual CPU/tx | -0.6% | 0.7% | -2.5% | -3.0% |
| CP CPU/tx | -18.8% | -4.8% | -24.6% | -36.3% |
| Notes: Apache workload; SLES8 Clients; SLES9 SP2 Servers; z/VM 5.2 GA; z/VM 5.3 GA + RSU1 | ||||
From these results, we see that whenever there is storage contention, we see a significant performance improvement both in terms of increased throughput and reduced CPU requirements. Some of these improvements may also be experienced by z/VM 5.2 systems that have service applied.
In configuration 2, which has no storage contention, we see only a small performance improvement. That improvement is due to the VM guest LAN QDIO simulation improvement rather than the storage management improvements. Indeed, we have observed a slight performance decrease relative to z/VM 5.2 for non-constrained workloads that do not happen to exercise any offsetting improvements.
As a general rule, you can expect the amount of improvement to increase as the amount of real storage contention increases and as the real storage size increases. This is supported by these results. Comparing configurations 3 and 4, we see that when we double real storage while holding the amount of contention roughly constant, performance relative to z/VM 5.2 shows a larger improvement. As another example, compare configurations 1 and 3. Both configurations show a large performance improvement relative to z/VM 5.2. Configuration 1 has high contention but a small real storage size while configuration 3 has low contention but a large real storage size.
Maximum In-use Virtual Storage Increased
With z/VM 5.3, the maximum amount of in-use virtual storage supported by z/VM has been greatly increased. This section discusses this in detail and then provides some illustrative measurement results and Performance Toolkit for VM data.
Before any page can be referenced in a given 1-megabyte segment of virtual storage, CP has to create a mapping structure for it called a page management block (PGMBK), which is 8KB in size. Each PGMBK is pageable but must be resident in real storage whenever one or more of the 256 pages in the 1 MB virtual storage segment it represents reside in real storage. For the purposes of this discussion, we'll refer to such a 1 MB segment as being "in-use". When resident in real storage, a PGMBK resides in 2 contiguous frames.
With z/VM 5.2, these resident PGMBKs had to located below the 2 GB line. This limited the total amount of in-use virtual storage that any given z/VM system could support. If the entire first 2 GB of real storage could be devoted to resident PGMBKs, this limit would be 256 GB of in-use virtual storage. (See calculation). Because there are certain other structures that must also reside below the 2 GB line, the practical limit is somewhat less.) Bear in mind that this limit is for in-use virtual storage. Since virtual pages and PGMBKs can be paged out, the total amount of ever-used virtual storage can be higher but only at the expense of degraded performance due to paging. So think of this is a "soft" limit.
Since, with z/VM 5.3, PGMBKs can reside anywhere in real storage, this limit has been removed and therefore z/VM can now support much larger amounts of in-use virtual storage. So what is the next limit?
In most cases, the next limit will be determined by the total real storage size of the z/VM system. The maximum real storage size supported by z/VM is now 256 GB (increased from 128 GB in z/VM 5.2) so let us consider examples for such a system. The number of real storage frames taken up by each in-use 1 MB segment of virtual storage is 2 frames for the PGMBK itself plus 1 frame multiplied by the average number of the 256 virtual pages in that segment that map to real storage. For example, suppose that the average number of resident pages per in-use segment is 50. In that case, each in-use segment requires a total of 52 real storage frames and therefore a 256 GB z/VM 5.3 system can support up to about 1260 GB of in-use virtual storage (see calculation), which is 1.23 TB (Terabytes). Again, this is a soft limit in that such a system can support more virtual storage but only at the expense of degraded performance due to paging.
As our next example, let us consider the limiting case where there there is just one resident page in each in-use segment. What happens then? In that case, each in-use segment requires only 3 real storage frames and, if we just consider real storage, a 256 GB system should be able to support 21.3 TB of virtual storage. However, that won't happen because we would first encounter a CP storage management design limit at 8 TB.
So where does this 8 TB design limit come from? Since PGMBKs are pageable, they also need to be implemented in virtual storage. This special virtual storage is implemented in CP as 1 to 16 4G shared data spaces named PTRM0000 through PTRM000F. These are created as needed. Consequently, on most of today's systems you will just see the PTRM0000 data space. Information about these data spaces is provided on the DSPACESH screen (FCX134) in Performance Toolkit. Since each PTRM data space is 4G and since each PGMBK is 8K, each PTRM data space can contain up to (4*1024*1024)/8 = 524288 PGMBKs, which collectively map 524288 MB of virtual storage, which is 524288/(1024*1024) = 0.5 TB. So the 16 PTRM data spaces can map 8 TB. Unlike the other limits previously discussed, this is a hard limit. When exceeded, CP will abend.
It turns out that, for a system with 256 GB of real memory, the smallest average number of pages per in-use virtual storage segment before you reach the 8 TB limit is 6 pages per segment. Few, if any, real world workloads have that sparse of a reference pattern. Therefore, maximum in-use virtual storage will be limited by available real storage instead of the 8 TB design limit for nearly all configurations and workloads.
Now that we have this background information, let us take a look at some example measurement results.
Method
Measurements were obtained using a segment thrasher program. This program loops through all but the first 2 GB of the virtual machine's address space and updates just the first virtual page in each 1 MB segment. As such, it implements the limiting case of 1 resident page per segment discussed above.
Three measurements were obtained that cover z/VM 5.2 and z/VM 5.3 at selected numbers of users concurrently running this thrasher program. For all runs, each user virtual machine was configured as a 64G 1-way. The runs were done on a 2094-S38 z9 system with 120 GB of real storage. This was sufficiently large that there was no paging for any of the runs. Performance Toolkit data were collected.
Results and Discussion
The results are summarized in Table 2. The PTRM data are extracted from the DSPACESH (FCX134) screens in the Performance Toolkit report. The remaining numbers are from calculations based on the characteristics of the segment thrasher workload.
Table 2. Improved Virtual Storage Capacity
| z/VM Release | 5.2 | 5.3 | 5.3 |
| Segment Thrasher Users | 4 | 5 | 128 |
| Run ID | ST4TA190 | ST5U5180 | STMU5180 |
| PTRM Data Spaces | 1 | 1 | 16 |
| PTRM Total pages (p) | 1049000 | 1049000 | 16784000 |
| PTRM Resid pages (p) | 508000 | 635000 | 16216000 |
| PTRM <2G Resid pages (p) | 508000 | 0 | 0 |
| Pages Touched/User | 63488 | 63488 | 63488 |
| Total User Pages Touched | 253952 | 317440 | 8126464 |
| Total GB Virtual Touched | 248 | 310 | 7936 |
| PTRM GB Real Storage Used | 2.0 | 2.4 | 62.0 |
| User GB Real Storage Used | 1.0 | 1.2 | 31.0 |
| Total GB Real Stg Used | 3.0 | 3.6 | 93.0 |
| Notes: Segment thrasher workload; 64G thrasher users; thrasher updates 1 page/MB in last 62G; 2094-S38; 120G central storage; no expanded storage; z/VM 5.2 GA; z/VM 5.3 GA + RSU1 | |||
For z/VM 5.2, PTRM Total Pages is incorrect due to an error in CP monitor that has been corrected in z/VM 5.3. The correct value for PTRM Total Pages is shown in Table 2.
The first measurement is for z/VM 5.2 at the highest number of these 64 GB segment thrasher users that z/VM 5.2 can support. Note that PTRM Resid Pages is 508000 (rounded by Performance Tookit to the nearest thousand) and they all reside below the 2 GB line. Since there are 524288 frames in 2 GB, this means that PGMBKs are occupying 97% of real storage below the 2 GB line. Given this, it is not surprising that when a 5 user measurement was tried, the result was a soft hang condition due to extremely high paging and we were unable to collect any performance data.
Here is what the DSPACESH screen looks like for the first run. Of most interest are Total Pages (total pages in the data space) and Resid Pages (number of those pages that are resident in real storage). As mentioned above, Total Pages is incorrect for z/VM 5.2. It is reported as 524k but should be 1049k. For this, and the following DSPACESH screen shots, the other (unrelated) data spaces shown on this screen have been deleted.
FCX134  Run 2007/05/21 21:22:26         DSPACESH
                                        Shared Data Spaces Paging Activity
From 2007/05/21 21:12:47
To   2007/05/21 21:22:17
For    570 Secs 00:09:30                This is a performance report for GDLS
_____________________________________________________________________________
                                          <--------- Rate per Sec. --------->
 Owning                             Users
 Userid    Data Space Name          Permt Pgstl Pgrds Pgwrt X-rds X-wrt X-mig
 SYSTEM    PTRM0000                     0  .000  .000  .000  .000  .000  .000


(Report split for formatting reasons.  Ed.)


                                GDLSPRF1
                                CPU 2094-733   SN 46A8D
PRF1                            z/VM   V.5.2.0 SLU 0000
_______________________________________________________
 <------------------Number of Pages------------------>
       <--Resid--> <-Locked--> <-Aliases->
 Total Resid R<2GB  Lock L<2GB Count Lockd XSTOR  DASD
  524k  508k  508k     0     0     0     0     0     0
The second measurement shows results for z/VM 5.3 at 5 users. Note that all of the PGMBKs are now above 2 GB. Here is the DSPACESH screen for the second run:
FCX134  Run 2007/05/21 22:16:56         DSPACESH
                                        Shared Data Spaces Paging Activity
From 2007/05/21 22:07:14
To   2007/05/21 22:16:44
For    570 Secs 00:09:30                This is a performance report for GDLS
_____________________________________________________________________________
                                          <--------- Rate per Sec. --------->
 Owning                             Users
 Userid    Data Space Name          Permt Pgstl Pgrds Pgwrt X-rds X-wrt X-mig
 SYSTEM    PTRM0000                     0  .000  .000  .000  .000  .000  .000


(Report split for formatting reasons.  Ed.)


                                GDLSPRF1
                                CPU 2094-733   SN 46A8D
PRF1                            z/VM   V.5.3.0 SLU 0000
_______________________________________________________
 <------------------Number of Pages------------------>
       <--Resid--> <-Locked--> <-Aliases->
 Total Resid R<2GB  Lock L<2GB Count Lockd XSTOR  DASD
 1049k  635k     0     0     0     0     0     0     0
The third measurement shows results for z/VM 5.3 at 128 users. This puts in-use virtual storage almost up to the 8 TB design limit. Note that now all 16 PTRM data spaces are in use. Because only 1 page is updated per segment, all the PGMBK and user pages fit into the configured 120 GB of real storage. For this configuration, an equivalent measurement with just 2 updated pages per segment would have resulted in very high paging. Here is the DSPACESH screen for the third run. You can see the 16 PTRM data spaces and that all but 2 of them are full.
FCX134  Run 2007/05/21 23:01:03         DSPACESH
                                        Shared Data Spaces Paging Activity
From 2007/05/21 22:51:14
To   2007/05/21 23:00:44
For    570 Secs 00:09:30                This is a performance report for GDLS
_____________________________________________________________________________
                                          <--------- Rate per Sec. --------->
 Owning                             Users
 Userid    Data Space Name          Permt Pgstl Pgrds Pgwrt X-rds X-wrt X-mig
 SYSTEM    PTRM000A                     0  .000  .000  .000  .000  .000  .000
 SYSTEM    PTRM000B                     0  .000  .000  .000  .000  .000  .000
 SYSTEM    PTRM000C                     0  .000  .000  .000  .000  .000  .000
 SYSTEM    PTRM000D                     0  .000  .000  .000  .000  .000  .000
 SYSTEM    PTRM000E                     0  .000  .000  .000  .000  .000  .000
 SYSTEM    PTRM000F                     0  .000  .000  .000  .000  .000  .000
 SYSTEM    PTRM0000                     0  .000  .000  .000  .000  .000  .000
 SYSTEM    PTRM0001                     0  .000  .000  .000  .000  .000  .000
 SYSTEM    PTRM0002                     0  .000  .000  .000  .000  .000  .000
 SYSTEM    PTRM0003                     0  .000  .000  .000  .000  .000  .000
 SYSTEM    PTRM0004                     0  .000  .000  .000  .000  .000  .000
 SYSTEM    PTRM0005                     0  .000  .000  .000  .000  .000  .000
 SYSTEM    PTRM0006                     0  .000  .000  .000  .000  .000  .000
 SYSTEM    PTRM0007                     0  .000  .000  .000  .000  .000  .000
 SYSTEM    PTRM0008                     0  .000  .000  .000  .000  .000  .000
 SYSTEM    PTRM0009                     0  .000  .000  .000  .000  .000  .000


(Report split for formatting reasons.  Ed.)


                                GDLSPRF1
                                CPU 2094-733   SN 46A8D
PRF1                            z/VM   V.5.3.0 SLU 0000
_______________________________________________________
 <------------------Number of Pages------------------>
       <--Resid--> <-Locked--> <-Aliases->
 Total Resid R<2GB  Lock L<2GB Count Lockd XSTOR  DASD
 1049k 1049k     0     0     0     0     0     0     0
 1049k 1049k     0     0     0     0     0     0     0
 1049k 1049k     0     0     0     0     0     0     0
 1049k 1049k     0     0     0     0     0     0     0
 1049k 1049k     0     0     0     0     0     0     0
 1049k  505k     0     0     0     0     0     0     0
 1049k 1049k     0     0     0     0     0     0     0
 1049k 1049k     0     0     0     0     0     0     0
 1049k 1049k     0     0     0     0     0     0     0
 1049k 1049k     0     0     0     0     0     0     0
 1049k 1025k     0     0     0     0     0     0     0
 1049k 1049k     0     0     0     0     0     0     0
 1049k 1049k     0     0     0     0     0     0     0
 1049k 1049k     0     0     0     0     0     0     0
 1049k 1049k     0     0     0     0     0     0     0
 1049k 1049k     0     0     0     0     0     0     0
Maximum Supported Real Storage Increased to 256G
Because of the improved storage scalability that results from these storage management improvements, the maximum amount of real storage that z/VM supports has been raised from 128 GB to 256 GB. This section provides measurement results that illustrate z/VM 5.3's real storage scalability characteristics and compares them to z/VM 5.2.
Method
A pair of Apache Workload measurements was obtained on z/VM 5.2 in 64 GB and 128 GB of real storage. A corresponding pair of measurements was obtained on z/VM 5.3 plus additional measurements in 160 GB, 200 GB, and 239 GB (the largest size we could configure on our 256 GB 2094-S38 z9 system). The number of processors used for each measurement was chosen so as to be proportional to the real storage size, starting with 3 processors for the 64 GB runs. For each run, the number of Apache clients and servers were chosen such that workload could fully utilize all processors and all real storage would be used with a low level of storage overcommitment. AWM and z/VM Performance Toolkit data were collected for each measurement. Processor instrumentation data (not shown) were collected for some of the measurements.
Results and Discussion
The z/VM 5.2 results are summarized in Table 3 while the z/VM 5.3 results are summarized in Table 4. The following notes apply to both tables:
Table 3. Storage and Processor Scaling: z/VM 5.2
| Real Storage (GB) | 64 | 128 |
| Expanded Storage (GB) | 2 | 2 |
| Processors | 3 | 6 |
| Client Guests | 3 | 4 |
| Server Guests | 6 | 13 |
| AWM Sample Size | 500 | 500 |
| Run ID | APT064G1 | APT128G0 |
| Tx/sec (p) | 137.04 | 254.35 |
| Total CPU Util/Proc (p) | 98.6 | 97.7 |
| ITR (p) | 138.99 | 260.34 |
| Processor Ratio | 1.000 | 2.000 |
| Real Storage Ratio | 1.000 | 2.000 |
| ITR Ratio | 1.000 | 1.873 |
| ITR Ratio; base = 530 64G | 0.873 | 1.634 |
| Total CPU/Tx (p) | 21.585 | 23.047 |
| Emul CPU/Tx (p) | 12.921 | 14.053 |
| CP CPU/Tx (p) | 8.664 | 8.994 |
| Total CPU/Tx Ratio | 1.000 | 1.067 |
| Emul CPU/Tx Ratio | 1.000 | 1.088 |
| CP CPU/Tx Ratio | 1.000 | 1.038 |
| Pageins/CPU-sec (p) | 352 | 291 |
| Notes: Apache workload; 1G, 1-way SLES8 clients; 10G, 1-way SLES9 SP2 servers; random requests to 10000 1M webpage files; 2094-S38; z/VM 5.2 GA | ||
Table 4. Storage and Processor Scaling: z/VM 5.3
| Real Storage (GB) | 64 | 128 | 160 | 200 | 239 |
| Expanded Storage (GB) | 2 | 2 | 2 | 2 | 2 |
| Processors | 3 | 6 | 8 | 10 | 12 |
| Client Guests | 3 | 4 | 5 | 6 | 7 |
| Server Guests | 6 | 13 | 15 | 19 | 23 |
| AWM Sample Size | 500 | 500 | 500 | 700 | 700 |
| Run ID | APU064G1 | APU128G0 | APU160G2 | APU200G0 | APU239G2 |
| Tx/sec (p) | 158.33 | 292.36 | 409.78 | 462.61 | 531.81 |
| Total CPU Util/Proc (p) | 99.4 | 90.5 | 94.9 | 96.3 | 93.1 |
| ITR (p) | 159.29 | 323.05 | 431.80 | 480.38 | 571.22 |
| Processor Ratio | 1.000 | 2.000 | 2.667 | 3.333 | 4.000 |
| Real Storage Ratio | 1.000 | 2.000 | 2.500 | 3.125 | 3.734 |
| ITR Ratio | 1.000 | 2.028 | 2.711 | 3.016 | 3.586 |
| Total CPU/Tx (p) | 18.834 | 18.573 | 18.527 | 20.817 | 21.008 |
| Emul CPU/Tx (p) | 11.274 | 11.328 | 11.870 | 12.927 | 13.245 |
| CP CPU/Tx (p) | 7.560 | 7.245 | 6.657 | 7.890 | 7.763 |
| Total CPU/Tx Ratio | 1.000 | 0.986 | 0.984 | 1.105 | 1.115 |
| Emul CPU/Tx Ratio | 1.000 | 1.005 | 1.053 | 1.147 | 1.175 |
| CP CPU/Tx Ratio | 1.000 | 0.958 | 0.881 | 1.044 | 1.027 |
| Pageins/CPU-sec (p) | 441 | 517 | 49 | 19 | 95 |
| Notes: Apache workload; 1G, 1-way SLES8 clients; 10G, 1-way SLES9 SP2 servers; random requests to 10000 1M webpage files; 2094-S38; z/VM 5.3 GA + RSU1 | |||||
Figure 1 is based upon the measurements summarized in Table 3 and Table 4. It shows a plot of z/VM 5.2 internal throughput rate (ITR) ratio, z/VM 5.3 ITR ratio, and processor ratio as a function of real storage size. All ITR ratios are relative to the ITR measured for z/VM 5.3 in 64 GB. Likewise, the processor ratios are relative to the number of processors (3) used for the 64 GB measurements.
Figure 1. Storage and Processor Scaling
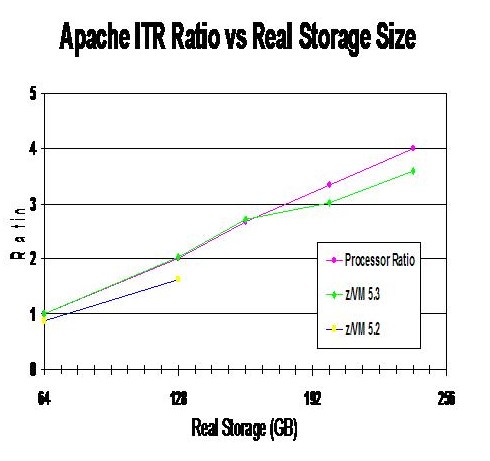 |
The ITR ratio results at 64 GB and 128G reflect the improved performance of z/VM 5.3 due to the storage management improvements. These same measurements also appear in Table 1.
If an ITR ratio curve were to exactly match the processor ratio curve, that would represent perfect scaling of internal throughput with number of processors. The z/VM 5.3 ITR ratio curve comes close to that. Analysis of the hardware instrumentation data indicates that z/VM 5.3's departure from perfect scaling is due to a combination of normal MP lock contention and longer minidisk cache searches.
Back to Table of Contents.
Memory Management: VMRM-CMM and CMMA
Abstract
VMRM-CMM and CMMA are two different approaches to enhancing the management of memory in a z/VM system by the exchange of information between one or more Linux guests and CP. Performance improvements were observed when VMRM-CMM, CMMA, or the combination of VMRM-CMM and CMMA were enabled on the system. At lower memory over-commitment ratios, all three algorithms provided similar benefits. For the workload and configuration used in this study, CMMA provided the most benefit at higher memory over-commitment ratios.
Introduction
This section evaluates the performance effects of two different approaches to enhancing the management of memory on a z/VM system. The two approaches are VM Resource Manager Cooperative Memory Management (VMRM-CMM, the Linux side of which is called "Cooperative Memory Management" also referred to as "CMM1") and Collaborative Memory Management Assist (CMMA, the Linux side of which is called "Collaborative Memory Management" also referred to as "CMM2"). VMRM-CMM uses a ballooning technique implemented in Linux. When VMRM detects a system-wide memory constraint, it notifies the participating Linux guests to release page frames. Linux releases the page frames by issuing the Diagnose X'10' function call. CMMA uses a page status technique. Page status is maintained by each participating Linux guest by using the new Extract and Set Storage Attributes (ESSA) instruction. When CP detects a system constraint, CP reclaims page frames based on this page status and without guest intervention.This report evaluates memory management based on an HTTP-serving workload. Another evaluation of VMRM-CMM and CMMA is based on Linux guests running a database server using a transaction processing (OLTP) workload in a z/VM environment. That report is found at z/VM Large Memory - Linux on System z.
Memory Management Overview
The z/VM system maps the guests' virtual memory into the real memory of the System z machine. If there are not enough real memory frames to contain all the required active guests' virtual memory pages, the active guests' virtual pages are moved to expanded storage (xstor). Once xstor becomes full, the guests' pages are migrated from xstor to DASD paging space. As the number of servers increases in a z/VM system, memory management overhead increases due to increased paging.
VMRM-CMM
VMRM-CMM can be used to help manage total system memory constraint in a z/VM system. Based on several variables obtained from the System and Storage domain CP monitor data, VMRM detects when there is such constraint and requests the Linux guests to reduce use of virtual memory. The guests can then take appropriate action to reduce their memory utilization in order to relieve this constraint on the system. When the system constraint goes away, VMRM notifies those guests that more memory can now be used. For more information, see VMRM-CMM.
CMMA
z/VM 5.3 adds support for the processor CMMA on the IBM System z9 ( z9 EC and z9 BC) processors. The ESSA instruction was introduced with the z9. CP and Linux share page status of all 4KB pages of guest memory. Using the ESSA instruction, Linux marks each page as:
- Stable (S): page has essential content the guest cannot recreate
- Unused (U): no useful content and any access to the page will cause an addressing exception
- Volatile (V): page has useful content. CP can discard the page anytime. The guest gets a discard fault on access for discarded pages
-
Potentially Volatile (P): same as Volatile (V) but CP needs to check
the dirty bit
- dirty - CP handles the page like a stable page
- not dirty - CP handles the page like a volatile page
If the processor does not support the ESSA instruction, CP will intercept the call and simulate the instruction on behalf of the processor. This technique optimizes the use of guest memory and host memory in the following ways:
- CP can preferentially steal unused, volatile, and not dirty potentially volatile pages, thus reducing paging.
- CP recognizes clean disk cache pages, the contents of which Linux is able to reconstruct, allowing CP to bypass paging out the data contents when reclaiming the backing frames for these pages. If Linux or its application subsequently tries to refer to the discarded page, Linux is notified that the page has been discarded and can reread the contents from disk or otherwise reconstruct them.
- When a Linux application releases memory, the Linux kernel marks those pages for removal. If a memory constraint occurs, CP can select those pages for removal at a higher priority or reclaim the page frames without the overhead of paging out their data content to xstor or DASD.
- The guest further benefits from the hardware Host Page-Management Assist (HPMA), which was announced in the Hardware Announcement dated July 27, 2005. HPMA support is also available on z990/z890. In conjunction with CMMA, HPMA allows the machine to supply fresh backing page frames for guest memory when the guest reuses a previously discarded page, eliminating the need for the z/VM hypervisor to intercept and resolve these host page faults.
Method
A full set of measurements was completed to evaluate the following memory management algorithms: physical partitioning, non-CMM, VMRM-CMM, CMMA, and VMRM-CMM + CMMA. The non-CMM measurements were used as the base measurements. VMRM-CMM and CMMA were evaluated separately. Then the combination of VMRM-CMM and CMMA was evaluated to observe whether there was synergy between the two.
The most basic type of improved memory management is physical partitioning where one takes the total real memory and divides it equally among the servers by changing the virtual machine sizes. In this scenario, memory is not overcommitted and thus represents the performance upper limit for the other memory management algorithms. Though we used this configuration to set performance goals, it is normally not practical in customer environments. This technique cannot be used for a large number of servers because the virtual machine size becomes less than the functional requirements of the Linux system. This technique also does not allow for temporary memory growth if the workload is in need of it.
The Apache workload was used for this evaluation. The following table contains a set of infrastructure items that remain constant for all the standard measurements of the Apache workload.
Apache workload parameters for standard
measurements in
this section
| System Model | 2094-719 |
| Processors | 4 |
| System Memory | 6G |
| Total CP xstor | 2G |
| PAGE slots | 10378K |
| MDC | ON (default) |
| Client virtual machines | 2 |
| Client connections per server | 1 |
| Number of 1M HTML files | 1200 |
| Think time (avg delay/std. dev.) | 620/50 (msec) |
| Server virtual memory | 1G |
| Servers virtual memory for Physical Partitioning | 6G/# of servers |
| 768M |
| 384M |
| 192M |
| Client virtual memory | 1G |
| Server virtual processors | 1 |
| Client virtual processors | 1 |
For each memory management algorithm, the number of servers was varied from 8 to 64. For the non-CMM measurements, the number of servers was varied from 8 to 32. For the physical partitioning measurements, the number of servers was varied from 8 to 32. Above 32 servers, the servers would not boot due to insufficient virtual memory (see above discussion).
This configuration was specifically designed to give VMRM-CMM and CMMA the most opportunity. That is, with a large number of Linux read-only file cache pages, a high VM paging rate, the presence of minidisk cache (MDC), and CPU not 100% utilized, the VMRM-CMM and the CMMA algorithms should improve the performance. In this configuration, memory contention was the only limiting factor for the 16, 24, and 32 server non-CMM measurements. The maximum memory over-commitment ratio measured was 11. Memory over-commitment ratio is calculated by dividing the total virtual memory for all virtual guests (clients and servers) by the real memory. In this configuration, a total of 64 servers defined at 1G of virtual memory, plus two clients defined at 1G of virtual memory is divided by 6G of real memory.
Processor Equipment and Software Environment
All standard measurements were completed on the z9, which has processor support for the ESSA instruction.
Earliest Recommended Software Level
| z/VM | Novell SUSE | Red Hat | |
| VMRM-CMM | z/VM 5.2 plus APAR VM64085 | SLES9 SP3 (see VMRM-CMM for recommended patches | RHEL4.7 |
| CMMA | z/VM 5.3 plus APAR VM64265 and APAR VM64297 | SLES10 SP1 update kernel 2.6.16.53-0.18 | Not Available |
For CMMA, it is not recommended to run earlier versions of VM or Linux. Therefore, for all the measurements completed in this report, we used the levels required for CMMA.
General Measurement Setup and Data Collection
Each measurement was primed unless stated otherwise. A primed run is when the Apache HTTP files are pre-referenced so that they are in the Linux file cache and/or MDC before the measurement begins. The two client guests were configured to not participate in the memory management algorithms. For each measurement, monitor data, Performance Toolkit for VM (Perfkit) data, and hardware instrumentation data were collected.
VMRM-CMM Measurement Setup Details
To enable VMRM-CMM, a VMRM configuration file containing the appropriate NOTIFY MEMORY statement was created on the A-disk of the VMRMSVM userid. Monitoring was started before each measurement with the following command:
-
IRMSERV VMRM CONFIG A
where VMRM CONFIG A is the name of the configuration file.
In the Linux server, the current number of pages released by Linux to CP can be found with the following command in Linux:
-
cat /proc/sys/vm/cmm_pages
For more instructions on how to enable VMRM-CMM for both VM and Linux, see VMRM-CMM.
CMMA Measurement Setup Details
For the standard measurements, where CMMA processor support existed, by default the z/VM software is enabled for CMMA. The Linux support for CMMA was activated at boot time by using the following option in the Linux parm file:
-
cmma=on (default is cmma=off)
Memory assist was specifically set OFF for the clients by issuing the following command from the client guests before boot time:
-
CP SET MEMASSIST OFF
For more information on the CP SET MEMASSIST command, see z/VM V5R3.0 CP Commands and Utilities Reference.
To ensure CMMA is active both on VM and Linux, a query command can be issued from a guest. See the above z/VM V5R3.0 CP Commands and Utilities Reference for more information.
-
CP Q MEMASSIST
For relevant documentation on Linux on System z, refer to the latest Device Drivers, Features, and Commands manual on the "October 2005 stream" page.
Results and Discussion
For each cooperative memory management algorithm, the number of servers was varied with each measurement. Figure 1 shows the Transaction Rate versus the Number of Servers for non-CMM and physical partitioning measurements.
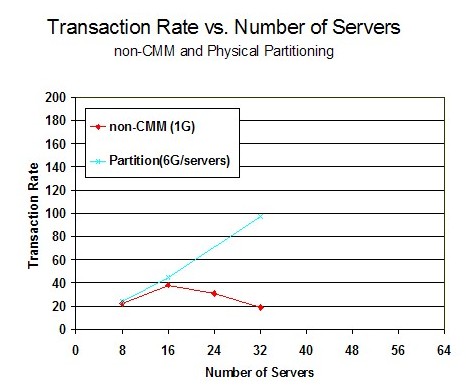
For the non-CMM measurements, the best results were achieved at 16 servers and then decreased as additional servers were added. At 16 servers, the memory over-commitment ratio is 3. This demonstrated the opportunity for any type of cooperative management algorithm. Perfkit data showed that with non-CMM, very few pages were allocated to MDC because the servers were large enough to hold the HTTP files in the Linux cache. As the number of servers increased, paging to DASD increased and the DASD avoid rate was very low.
For the physical partitioning measurements, the transaction rate increased as the number of servers increased but measurements could not be completed beyond 32 servers because the virtual machine size became less than the functional requirements of the Linux system. Perfkit data showed that a large number of pages were allocated for MDC and the MDC hit ratio was high. The virtual machine size was small enough that not all the HTTP files could fit into the Linux file cache. Thus, for all the Linux servers, the files remained in the MDC.
Figure 2 shows the Transaction Rate versus the Number of Servers for all five memory management algorithms.
Figure 2. Transaction Rate vs. Number of Servers:
All five Algorithms: Processor z9, 6G real memory
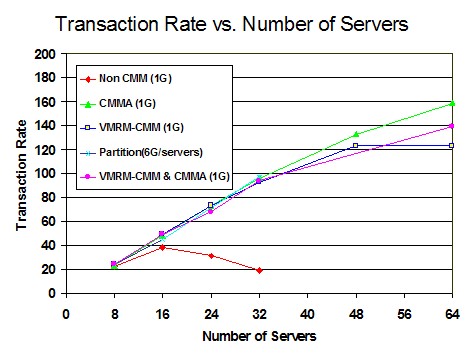
VMRM-CMM, CMMA, and VMRM-CMM + CMMA scaled to 32 servers just as did physical partitioning, thus, demonstrating the expected degree of improvement. All four algorithms had equal improvement because they were limited by the think time in the clients.
For CMMA, the number of servers was varied from 8 to 64 and throughput continued to increase as the number of servers increased. CMMA provided the best results as it scaled to 64 servers. Perfkit data showed that with CMMA, the majority of MDC pages were in expanded storage, not in real memory. As CP was stealing volatile pages from the Linux cache of each server, the HTTP files would no longer fit into the Linux cache. In addition, CP does not write volatile pages to xstor, thus there is more opportunity to use xstor for MDC. This combined action caused most of the HTTP files to be stored in MDC for all the Linux servers. In the Special Studies section, CMMA 64-server measurements were completed to understand how it would scale as the system was more memory constrained without additional servers.
For VMRM-CMM, the number of servers was varied from 8 to 64 and the throughput continued to increase as the number of servers increased. Results were nearly identical to CMMA except for the 64-server measurement. With 64 servers, VMRM log data showed that the SHRINK requests were much larger than what would be easily handled by the Linux server and thus the amount of processor time per transaction in Linux greatly increased between the 48-server and the 64-server measurement. Perfkit data showed that with VMRM-CMM, MDC was allocated more space than with CMMA measurements and more space than was actually needed for a good hit ratio. More than 60% of the MDC allocated space was in real memory and less than 40% was in xstor. In this scenario, capping MDC may improve performance.
For VMRM-CMM + CMMA, the number of servers was varied from 8 to 64 and the throughput continued to increase as the number of servers increased. The throughput results were nearly identical to VMRM-CMM and CMMA except for the 64-server measurement where it was between the VMRM-CMM and CMMA results. With 64 servers, the VMRM SHRINK requests were sometimes larger than what could be easily handled by the Linux server and thus the amount of processor time per transaction in Linux increased between the 32-server and the 64-server measurements. This was similar to VMRM-CMM measurements but a lower percentage, probably because CMMA stealing was also reducing the memory over-commitment. The volatile steal rate was very low in this measurement compared to the CMMA measurement. This was expected because the VMRM-CMM activity had already eliminated most of the pages that would have been marked volatile. The MDC allocated space looked more like the VMRM-CMM measurement than the CMMA measurement.
Figure 3 shows the Processor Utilization versus the Number of Servers.
Figure 3. Processor Utilization vs.
Number of Servers: Processor z9, 6G real memory
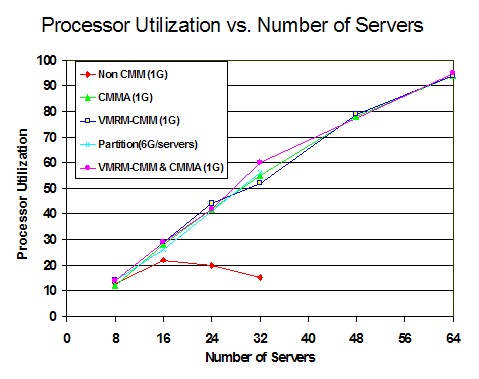
In the non-CMM run, processor utilization did not scale as more servers were added because the throughput was limited by DASD paging. For the other memory management algorithms, processor utilization scaled as the number of servers increased to 64. This chart also demonstrates that the workload was not CPU limited.
Figure 4 shows the Internal Throughput Rate (ITR) versus the Number of Servers.
Figure 4. ITR vs. Number of Servers:
Processor z9, 6G real memory
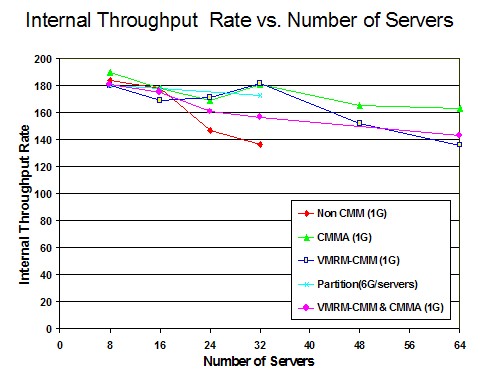
The non-CMM measurements showed that as the number of servers increased, the overhead of managing the memory increased. This graph also demonstrated the CPU efficiency of all the other memory management algorithms. At 64 servers, CMMA had the highest ITR, while VMRM-CMM had the lowest.
Figure 5 shows the Paging Space Utilization versus the Number of Servers.
Figure 5. Paging Space Utilization
vs. Number of Servers:
Processor z9, 6G real memory
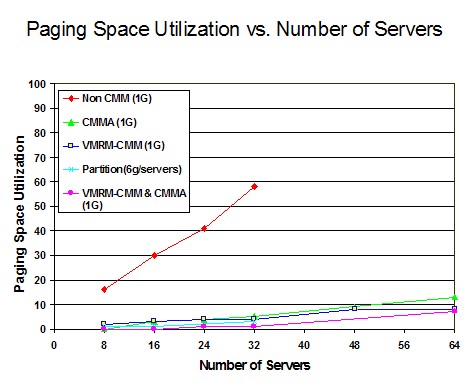
The non-CMM measurements showed that as the number of servers increased, the paging space utilization increased. In the measurements that included the memory management algorithms, paging space utilization was significantly reduced. In the case of VMRM-CMM and partitioning, this was due to the greatly reduced actual or effective server virtual storage size. In the case of CMMA, this was due to CP's preference for stealing volatile pages from the server guests, the contents of which do not need to be paged out.
Special Studies
This section of the report evaluates special memory management scenarios that were derived from the analysis above.
CMMA Scalability
Since CMMA scaled perfectly to 64 servers, a series of 64-server measurements in smaller real memory were completed to see how CMMA would be affected by more memory constraint. Three measurements were completed using the standard configuration at 64 servers and reducing the memory from 6G to 3G. Table 1 shows the transaction rates for the 4G and 3G measurements were not much lower than the 6G measurement. Thus, they provided nearly perfect scaling. The ITR remained nearly constant for all three measurements. This demonstrated CMMA memory management efficiency as the memory over-commitment ratio reached 22.
| System Memory (P) | 6G | 4G | 3G |
| Run ID | CMM2064 | CMM204G1 | CMM203G1 |
| Memory Over-commitment Ratio | 11 | 17 | 22 |
| Tx/sec (h) | 150.5 | 149.1 | 146.6 |
| ITR (h) | 162.5 | 169.6 | 161.0 |
A measurement at 2G of real memory was so memory constrained that AWM session timeouts occurred. The DASD paging devices became the limiting factor, causing a large drop in processor utilization. The heavy paging delay probably led to long AWM response times and thus the AWM session timeouts. It appeared that both VM and all 64 Linux servers were still running correctly at the end of the measurement.
Enablement Cost of CMMA
The CMMA enablement overhead was evaluated using a workload that ran at 100% processor utilization and caused no VM paging on a processor with the ESSA support (z9) and on a processor where the ESSA instruction needed to be simulated by CP (z990). This workload does not give an opportunity for a memory management algorithm to improve performance. The only changes from the standard workload were to increase system memory to 20G and reduce the AWM think time delay to zero. To disable CMMA for the whole system, the following command was issued:
-
CP MEMASSIST OFF ALL
Table 2 has a comparison of selected values for the CMMA enablement overhead measurements on a processor (z9) with the real ESSA instruction support. Transaction rate decreased by 1.8% because of the 1.7% increase in CPU usecs (microseconds) per transaction. The increased usecs per transaction was due to Linux CMMA support including use of the ESSA instruction. The ESSA instruction accounted for 40% of the overall increase in usecs per transaction.
Table 2. CMMA Enablement Cost on a Processor with ESSA Support
| CMMA Enable Flag | OFF | ON | ||
| Run ID | BASEDN0 | CMM2DU0 | Delta | Pct |
| Tx/sec (h) | 244.6 | 239.8 | -4.5 | -2.0 |
| ITR (h) | 255.6 | 251.2 | -4.4 | -1.7 |
| Total CPU usec/Tx (h) | 15651 | 15921 | 270 | 1.7 |
| CP CPU usec/Tx (h) | 5617 | 5672 | 55 | 1.0 |
| Emul CPU usecs/Tx (h) | 10034 | 10249 | 215 | 2.1 |
| Note: usec/Tx = microseconds/transaction | ||||
Table 3 has a comparison of selected values for the CMMA enablement overhead measurements on a processor where the ESSA instruction must be simulated by z/VM. Transaction rate decreased by 7.4% because of the 8.3% increase in CPU usecs (microseconds) per transaction. The increased usecs per transaction was due to Linux CMMA support including use of the ESSA instruction and the cost of z/VM to simulate the ESSA instruction. z/VM's simulation of the ESSA instruction accounts for 77% of the increased usecs per transaction and the Linux support accounts for the other 23% of the overall increase in usecs per transaction.
Table 3. CMMA Enablement Cost On Processor without ESSA support
| CMMA Enable Flag | OFF | ON | ||
| Run ID | BASETRX0 | CMM2SIM0 | Delta | Pct |
| Tx/sec (h) | 158.3 | 146.9 | -11.4 | -7.2 |
| ITR (h) | 164.4 | 151.8 | -12.6 | -7.7 |
| Total CPU usec/Tx (h) | 24335 | 26349 | 2014 | 8.3 |
| CP CPU usec/Tx (h) | 8654 | 10220 | 1566 | 18.1 |
| Emul CPU usec/Tx (h) | 15629 | 16129 | 448 | 2.9 |
| Note: usec/Tx = microseconds/transaction | ||||
Overall, for a non-paging, 100% CPU bound workload we found that the throughput does decrease with CMMA enabled. On a system where the ESSA instruction was executed on the processor, we observed the throughput to decrease by 1.8% when CMMA was enabled. On a system where the ESSA instruction was simulated by CP, we observed the throughput to decrease by 7.4% when CMMA was enabled. Thus, the overhead of running CMMA on a system where the processor does not support the ESSA instruction was more costly than on a system that has ESSA processor support.
CMMA with simulated ESSA versus VMRM-CMM
Two measurements on the z990 processor were completed to compare CMMA with simulated ESSA to VMRM-CMM. Using the standard configuration, two measurements were completed with 48 servers. Table 4 compares a 48-server simulated CMMA measurement to a 48-server VMRM-CMM measurement. The transaction rate for VMRM-CMM was 11.0% higher than the simulated version of CMMA. This is attributed to the ESSA instruction in CMMA being simulated by CP. CP microseconds per transaction was 26% higher than for VMRM-CMM.
Table 4. CMMA with simulated ESSA vs. VMRM-CMM
| CMM | CMMA with simulated ESSA | VMRM-CMM | |
| Run ID | CMM2T048 | CMM1T048 | Pct |
| Tx/sec (h) | 100.0 | 110.7 | 10.7 |
| ITR (h) | 103.7 | 116.7 | 12.5 |
| Total CPU usec/Tx (h) | 38586 | 34288 | -11.1 |
| CP CPU usec/Tx (h) | 15052 | 11154 | -25.9 |
| Virtual I/O Rate (p) | 8715 | 1258 | -85.6 |
| CMM2 ESSA Ops (z)* | 3170690 | 0 | -100 |
|
Note: usec/Tx = microseconds/transaction
* average per monitor interval (30 seconds) | |||
Summary and Conclusions
Conclusions
- All three algorithms provided benefit over the non-CMM workload.
- CMMA provided the most benefit for this workload where a large number of volatile pages existed in the Linux file cache.
- VMRM-CMM showed weakness at higher memory over-commitment ratios because the VMRM SHRINK value was larger than what was functionally required by the Linux guest.
- VMRM-CMM provided the most benefit for this workload on a processor that does not support the ESSA instruction.
- In a workload where the memory over-commitment ratio is not too high and a large number of stable or potentially volatile changed pages exist in the Linux cache, VMRM-CMM may provide more benefit than CMMA. This conclusion was derived from the z/VM Large Memory - Linux on System z study.
Characteristics of a good workload for VMRM-CMM and CMMA benefits
Depending on the Linux workload characteristics and the system configuration, VMRM-CMM and CMMA benefits will vary. Below are some characteristics to look for when determining if VMRM-CMM or CMMA may benefit your system.
- a high guest memory to real memory over-commitment ratio
- high VM paging rate
- not running 100% CPU busy
- memory contention is a limiting factor
- many Linux read-only file cache pages (check using cat /proc/meminfo )
- Linux files fit into MDC
Epilogue
Prior to z/VM 5.4 or APAR VM64439 for z/VM 5.2 and 5.3, VMRM had no lower bound beyond which it would refrain from asking Linux guests to give up memory. In some workloads, Linux guests that had already given up all the storage they could give used excessive CPU time trying to find even more storage to give up, leaving little CPU time available for useful work.With z/VM 5.4 or APAR VM64439, VMRM has been changed so that it will not ask a Linux guest to shrink below 64 MB. This was the minimum recommended virtual machine size for SuSE and RedHat at the time the work was done.
To see how VMRM-CMM with the safety net implementation compares to the other CMM algorithms studied above, a VMRM-CMM measurement with the safety net implementation was completed at 64 servers. See standard workload for specific system configuration settings.
Figure 6 shows the transaction rate versus the number of servers for five memory management algorithms including the new VMRM-CMM measurement with the safety net defined at 64 MB.
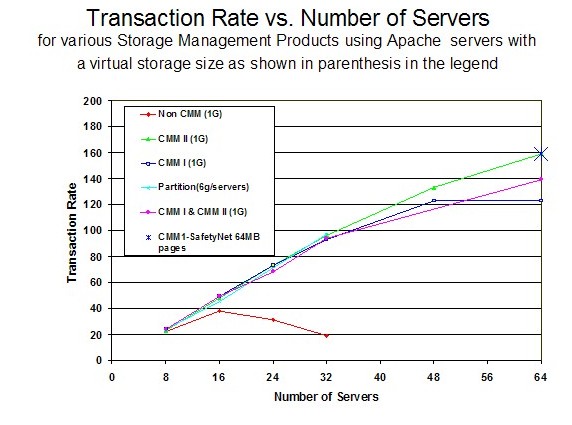 |
Compared to the VMRM-CMM without the safety net, the transaction rate for VMRM-CMM with the safety net increased by 29% and equalled the CMMA (aka CMM II) transaction rate. Thus, the safety net reduced the amount of CPU time Linux used to search for storage.
Back to Table of Contents.
Improved Processor Scalability
Abstract
With z/VM 5.3, up to 32 CPUs are supported with a single VM image. Prior to this release, z/VM supported up to 24 CPUs. In addition to functional changes that enable z/VM 5.3 to run with more processors configured, a new locking infrastructure has been introduced that improves system efficiency for large n-way configurations. A performance study was conducted to compare the system efficiency of z/VM 5.3 to z/VM 5.2. While z/VM 5.3 is more efficient than z/VM 5.2 for all of the n-way measurement points included in this study, the efficiency improvement is substantial at large n-way configurations. With a 24-way LPAR configuration, a 19% throughput improvement was observed.
Introduction
This section reviews performance experiments that were conducted to verify the significant improvement in efficiency with z/VM 5.3 when running with large n-way configurations. Prior to z/VM 5.3, the VM Control Program (CP) scheduler lock had to always be held exclusive. With z/VM 5.3, a new scheduler lock infrastructure has been implemented. The new infrastructure includes a new Processor Local Dispatch Vector (PLDV) lock, one per processor. The new infrastructure enables obtaining the scheduler lock in shared mode in combination with the individual PLDV lock for a processor in exclusive mode when system conditions allow. This new lock design reduces contention for the scheduler lock, enabling z/VM to more efficiently manage large n-way configurations. A study that was done comparing z/VM 5.3 to z/VM 5.2 with the same workload using the same LPAR configurations is reviewed. The results show that processor scaling with z/VM 5.3 is much improved for large n-way configurations.
Background
Motivated by customers' needs to consolidate large numbers of guest systems onto a single VM image, the design of the scheduler lock has been incrementally enhanced to reduce lock contention. With z/VM 4.3, CP timer management scalability was improved by eliminating master processor serialization and other design changes were made to reduce large system effects. With z/VM 4.4, more scheduler lock improvements were made. A new CP timer request block lock was introduced to manage timer request serialization (TRQBK lock), removing that burden from the CP scheduler lock. With z/VM 5.1, 24-way support was announced. Now, with z/VM 5.3, scheduler lock contention has been reduced even further with the introduction of a new lock infrastructure that enables the scheduler lock to be held shared when conditions allow. With these additional enhancements, 32 CPUs are supported with a single VM image.
Method
A 2094-109 z9 system was used to conduct experiments in an LPAR configured with 10GB of central storage and 25GB of expanded storage. The breakout of central storage and expanded storage for this evaluation was arbitrary. Similar results are expected with other breakouts because the measurements were obtained in a non-paging environment.
The LPAR's n-way configuration was varied for the evaluation. The hardware configuration included shared processors and processor capping for all measurements. z/VM 5.2 measurements were used as the baseline for the comparison. z/VM 5.2 baseline measurements were done with the LPAR configured as a 6-way, 12-way, 18-way, 24-way, and 30-way. z/VM 5.3 measurements were done for each of these n-way environments. In addition, a 32-way measurement was done, since that is the largest configuration supported by z/VM 5.3.
Processor capping creates a maximum limit for system processing power allocated to the LPAR. By running with processor capping enabled, any effects that are measured as the n-way is varied can be attributed to the n-way changes rather than a combination of n-way effects and large system effects. Processing capacity was held at approximately 6 full processors for this study.
The software application workload used for this evaluation was a version of the Apache workload without storage constraints. The Linux guests that were acting as clients were configured as virtual uniprocessor machines with 1GB of storage. The Linux guests that were acting as web servers were configured as virtual 5-way machines with 128MB of storage. The number of Linux web clients and web servers was increased as the n-way was increased in order to generate enough dispatchable units of work to keep the processors busy.
The Application Workload Modeler (AWM) was used to simulate client requests for the Apache workload measurements. Hardware instrumentation data, AWM data, and Performance Toolkit for VM data were collected for each measurement.
Results and Discussion
For this study, if system efficiency is not affected by the n-way changes, the expected result for the Internal Throughput Rate Ratio (ITRR) is that it will increase proportionally as the n-way increases. For example, if the number of CPUs is doubled, the ITRR would double if system efficiency is not affected by the n-way change.
Figure 1. Large N-Way Effects on ITR Ratio
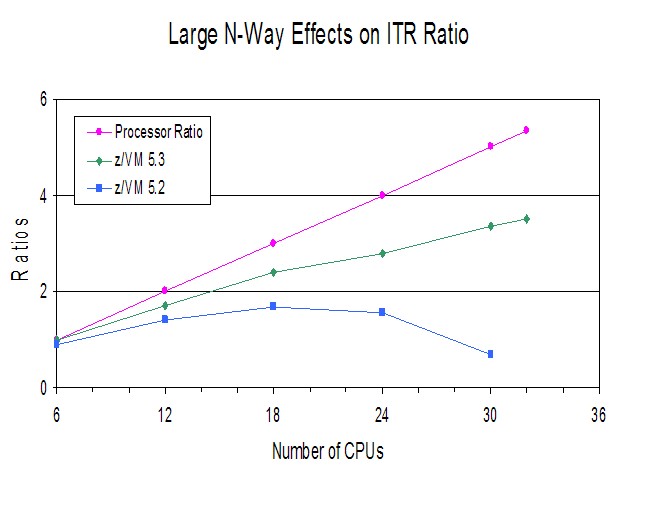 |
Figure 1 shows the comparison of ITRR between z/VM 5.2 and z/VM 5.3. It also shows the line for processor scaling, using the 6-way 5.3 measurement as the baseline.
Figure 1 illustrates the dramatic improvement with z/VM 5.3 scalability with larger n-way configurations. The processor ratio line shows the line for perfect scaling. While the z/VM 5.3 system does not scale perfectly, this is expected as software multi-processor locking will always have some impact on system efficiency. The loss of system efficiency is more pronounced for larger n-way configurations because that is where scheduler lock contention is the greatest.
It should be noted that z/VM 5.2 only supports up to 24 CPUs for a single VM image. The chart shows a 30-way configuration to illustrate the dramatic improvement in efficiency with z/VM 5.3. This also explains why support was limited to 24 CPUs with z/VM 5.2.
Table 1 shows a summary of the measurement data
collected when
running with z/VM 5.3 with LPAR n-way configurations of 6-way, 12-way,
18-way, 24-way, 30-way, and 32-way.
Table 1. Comparison of System Efficiency with z/VM 5.3 as N-Way Increases
| Shared CPUs | 6 | 12 | 18 | 24 | 30 | 32 |
| AWM Clients | 3 | 5 | 7 | 9 | 11 | 12 |
| AWM Servers | 5 | 9 | 13 | 17 | 21 | 23 |
| Run ID | AVPK5187 | AVPK5184 | AVPK5183 | AVPK5182 | AVPK5188 | AVPK5186 |
| Tx/sec (p) | 4674.21 | 4120.00 | 3841.05 | 3315.00 | 3177.00 | 3117.00 |
| ITR (p) | 4697.70 | 8015.56 | 11297.21 | 13102.77 | 15805.97 | 16492.06 |
| Total Util/Proc (p) | 99.5 | 51.4 | 34.0 | 25.3 | 20.1 | 18.9 |
| Processors (p) | 6 | 12 | 18 | 24 | 30 | 32 |
| Total CPU/Tx (p) | 1.277 | 1.497 | 1.593 | 1.832 | 1.898 | 1.940 |
| CP CPU/Tx (p) | 0.290 | 0.341 | 0.417 | 0.485 | 0.482 | 0.462 |
| Emul CPU/Tx (p) | 0.987 | 1.156 | 1.176 | 1.347 | 1.416 | 1.478 |
| Pct Spin Time (p) | .371 | 5.233 | 9.883 | 13.08 | 16.48 | 14.53 |
| Sch Pct Spin Time (p) | .315 | 4.763 | 9.034 | 12.58 | 16.05 | 14.08 |
| TRQ Pct Spin Time (p) | .054 | .463 | .833 | .488 | .433 | .442 |
| Privops/Tx (p) | 50.818 | 54.376 | 52.766 | 54.109 | 53.331 | 52.557 |
| Diagnoses/Tx (p) | 1.840 | 4.631 | 2.022 | 2.172 | 2.339 | 2.069 |
| RATIOS | ||||||
| Tx/sec (p) | 1.000 | 0.881 | 0.822 | 0.709 | 0.680 | 0.667 |
| ITR (p) | 1.000 | 1.706 | 2.405 | 2.789 | 3.365 | 3.511 |
| Total Util/Proc (p) | 1.000 | 0.517 | 0.342 | 0.254 | 0.202 | 0.190 |
| Processors (p) | 1.000 | 2.000 | 3.000 | 4.000 | 5.000 | 5.333 |
| Total CPU/Tx (p) | 1.000 | 1.172 | 1.247 | 1.435 | 1.486 | 1.519 |
| CP CPU/Tx (p) | 1.000 | 1.176 | 1.438 | 1.672 | 1.662 | 1.593 |
| Emul CPU/Tx (p) | 1.000 | 1.171 | 1.191 | 1.365 | 1.435 | 1.497 |
| Pct Spin Time (p) | 1.000 | 14.105 | 26.639 | 35.256 | 44.420 | 39.164 |
| Sch Pct Spin Time (p) | 1.000 | 15.121 | 28.679 | 39.937 | 50.952 | 44.698 |
| TRQ Pct Spin Time (p) | 1.000 | 8.574 | 15.426 | 9.037 | 8.019 | 8.185 |
| Privops/Tx (p) | 1.000 | 1.070 | 1.038 | 1.065 | 1.049 | 1.034 |
| Diagnoses/Tx (p) | 1.000 | 2.517 | 1.099 | 1.180 | 1.271 | 1.124 |
| Notes: z9 machine; 10GB central storage; 25GB expanded storage; Apache web serving workload with uniprocessor clients and 5-way servers; Non-paging environment with processor capping in effect to maintain processing capacity constant. (h) hardware instrumentation data; (p) Performance Toolkit data | ||||||
Table 1 highlights the key measurement points that were used in this performance study. Some of the same trends found here were also found in the 24-Way Support evaluated in the z/VM 5.1 performance report. Reference the z/VM 5.1 table comparison of system efficiency.
The CPU time per transaction (Total CPU/Tx) increases as the n-way increases. Both CP and the Linux guests (represented by emulation) contribute to the increase. However, the CP CPU/Tx numbers are lower than they were with z/VM 5.1 (although this metric was not included in the z/VM 5.1 table). In fact, there is a slight downward trend in the z/VM 5.3 numbers with the 30-way and 32-way configurations. The reduction in CP's CPU time per transaction is a result of the improvements to the scheduler lock design and other enhancements incorporated into z/VM 5.3.
Another trend discussed in the 24-Way Support with z/VM 5.1 is the fact that the Linux guest virtual MP machines are spinning on locks within the Linux system. This spinning results in Diagnose X'44's being generated. For further information concerning Diagnose X'44's, please refer to the discussion in the 24-Way Support section in the z/VM 5.1 Performance Report.
Finally, the 24-Way Support in the z/VM 5.1 Performance Report discusses the make up of the CP CPU time per transaction. Two components that are included there are formal spin time and non-formal spin time. With z/VM 5.3, a breakout by lock type of formal spin time is included in monitor records and is now presented in the Performance Toolkit with new screen FCX265 - Spin Lock Log By Time. A snapshot of the ">>Mean>>" portion of that screen is shown below.
The scheduler lock is "SRMSLOCK" in the Spin Lock Log screen shown below. The new lock infrastructure discussed in the Introduction of this section is used for all of the formal locks. However, at this time, only the scheduler lock exploits the shared mode enabled by the new design. The new infrastructure may be exploited for other locks in the future as appropriate.
FCX265  Run 2007/05/21 14:33:24         LOCKLOG
                                        Spin Lock Log, by Time
_____________________________________________________________________________________

                      <------------------- Spin Lock Activity -------------------->
                      <----- Total ----->  <--- Exclusive --->  <----- Shared ---->
 Interval             Locks Average   Pct  Locks Average   Pct  Locks Average   Pct
 End Time LockName     /sec    usec  Spin   /sec    usec  Spin   /sec    usec  Spin
 >>Mean>> SRMATDLK     61.0   48.39  .009   61.0   48.39  .009     .0    .000  .000
 >>Mean>> RSAAVCLK       .0    .000  .000     .0    .000  .000     .0    .000  .000
 >>Mean>> RSA2GCLK       .0   3.563  .000     .0   3.563  .000     .0    .000  .000
 >>Mean>> BUTDLKEY       .0    .000  .000     .0    .000  .000     .0    .000  .000
 >>Mean>> HCPTMFLK       .0    .000  .000     .0    .000  .000     .0    .000  .000
 >>Mean>> RSA2GLCK       .0    .551  .000     .0    .551  .000     .0    .000  .000
 >>Mean>> HCPRCCSL       .0    .000  .000     .0    .000  .000     .0    .000  .000
 >>Mean>> RSASXQLK       .0   1.867  .000     .0   1.867  .000     .0    .000  .000
 >>Mean>> HCPRCCMA       .0    .000  .000     .0    .000  .000     .0    .000  .000
 >>Mean>> RCCSFQL        .0    .000  .000     .0    .000  .000     .0    .000  .000
 >>Mean>> RSANOQLK       .0    .000  .000     .0    .000  .000     .0    .000  .000
 >>Mean>> NSUNLSLK       .0    .000  .000     .0    .000  .000     .0    .000  .000
 >>Mean>> HCPPGDML       .0    .000  .000     .0    .000  .000     .0    .000  .000
 >>Mean>> NSUIMGLK       .0    .000  .000     .0    .000  .000     .0    .000  .000
 >>Mean>> FSDVMLK        .0    .000  .000     .0    .000  .000     .0    .000  .000
 >>Mean>> DCTLLOK        .0    .000  .000     .0    .000  .000     .0    .000  .000
 >>Mean>> SYSDATLK       .0    .000  .000     .0    .000  .000     .0    .000  .000
 >>Mean>> RSACALLK       .0    .000  .000     .0    .000  .000     .0    .000  .000
 >>Mean>> RSAAVLLK       .0    .328  .000     .0    .328  .000     .0    .000  .000
 >>Mean>> HCPPGDAL       .0    .000  .000     .0    .000  .000     .0    .000  .000
 >>Mean>> HCPPGDTL       .0    .000  .000     .0    .000  .000     .0    .000  .000
 >>Mean>> HCPPGDSL       .0    .000  .000     .0    .000  .000     .0    .000  .000
 >>Mean>> HCPPGDPL       .0    .000  .000     .0    .000  .000     .0    .000  .000
 >>Mean>> SRMALOCK       .0    .000  .000     .0    .000  .000     .0    .000  .000
 >>Mean>> HCPTRQLK    675.5   209.2  .442  675.5   209.2  .442     .0    .000  .000
 >>Mean>> SRMSLOCK    30992   145.4 14.08  30991   145.4 14.08     .7   949.1  .002
Summary and Conclusions
With the workload used for this evaluation, there is a gradual decrease in system efficiency which is more pronounced at large n-way configurations.
The specific workload used will have a significant effect on the efficiency with which z/VM can manage large numbers of processor engines. As stated in the 24-Way Support section in the z/VM 5.1 report, when z/VM is running in large n-way LPAR configurations, z/VM overhead will be lower for workloads with fewer, more CPU-intensive guests than for workloads with many lightly loaded guests. Some workloads (such as CMS workloads) require master processor serialization. Workloads of this type will not be able to fully utilize as many CPUs because of master processor serialization. Also, application workloads that use a single virtual machine and are not capable of using multiple processors (such as DB2 for VM and VSE, SFS, and RACF) may not be able to take full advantage of a large n-way configuration.
This evaluation focused on analyzing the effects of increasing the n-way configuration while holding CPU processing capacity relatively constant. In production environments, n-way increases will typically also result in processing capacity increases. Before exploiting large n-way configurations, the specific workload characteristics should be considered in terms of how it will perform with the work dispatched across more CPUs as well as utilizing the larger processing capacity.
Back to Table of Contents.
Diagnose X'9C' Support
Abstract
z/VM 5.3 includes support for diagnose X'9C' -- a new protocol for guest operating systems to notify CP about spin lock situations. It is similar to diagnose X'44' but allows specification of a target virtual processor. Diagnose X'9C' provided a 2% to 12% throughput improvement over diagnose X'44' for various measured Linux guest configurations having processor contention. No benefit is expected in configurations without processor contention.
Introduction
This section of the report provides performance results for the new protocol, diagnose X'9C', that guest operating systems can use to notify CP about spin lock situations. This new support identifies the processor that is holding the desired lock and is more efficient than the previous protocol, diagnose X'44', which did not. The new z/VM 5.3 diagnose X'9C' support is compared to the existing diagnose X'44' support in various constrained configurations. The benefit provided by diagnose X'9C' is generally proportional to the constraint level in the base measurement. No benefit is expected in configurations without processor contention.
Figure 1 illustrates the difference between the diagnose X'44' and the diagnose X'9C' locking mechanisms. In the diagnose X'44' implementation, when a virtual processor needs a lock that is held by another virtual processor, CP is not informed of which other virtual processor holds the lock so it selectively schedules other virtual processors in an effort to find the virtual processor holding the lock to be released. In diagnose X'9C' implementation, however, the virtual processor holding the required lock is specified, so CP schedules only that processor. This allows for more efficient management of spin lock situations.
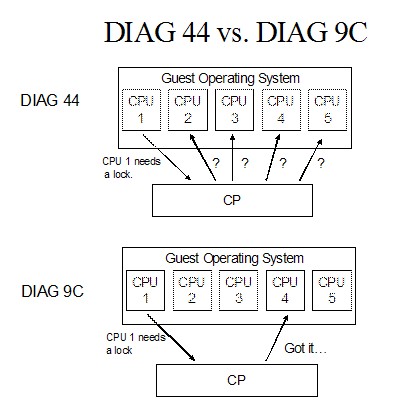 |
Diagnose X'9C' is also available for z/VM 5.2 in the service stream via PTF UM31642.
z9 processors provides diagnose X'9C' support to the operating systems running in an LPAR.
z9 processors have a new feature, SIGP Sense Running Status Order, that allows a guest operating system to determine if the virtual processor holding a lock is currectly dispatched on a real processor. This could provide additional benefit, since the guest does not need to issue a diagnose X'9C' if the virtual processor currently holding a lock is already dispatched.
In addition to providing diagnose X'9C' support to guest operating system, z/VM uses it for its own spin lock contention anytime the hipervisor on which it is running provides the support. z/VM also uses the SIGP Sense Running Status Order for its own lock contention anytime both the hardware and the hipervisor on which it is running provide support.
z/OS provided support for diagnose X'9C' in Release 1.7 but it is also available in the service stream for Release 1.6 via APAR OA12300. z/OS also uses the SIGP Sense Running Status Order when it is available.
Linux for System z provided support for diagnose X'9C' in SUSE SLES 10 but it does not use the SIGP Sense Running Status Order that is available on z9 processors.
Background
There have been several recent z/VM improvements for guest operating system spin locks.
-
Extended Diagnose X'44' Fast Path
describes the z/VM 5.2
extension of the diagnose
X'44'
fast path
from 2-way to n-way and
shows performance improvement results.
- Improved Processor Scalability describes the z/VM 5.3 improvements for the scheduler lock that is used by both diagnose X'44' and diagnose X'9C'.
In addition to z/VM changes, Linux for System z introduced a spin_retry variable in kernel 2.6.5-7.257 dated 2006-05-16 and is available in SUSE SLES 9 security update announced 2006-05-24, SUSE SLES 10, and RHEL5. Prior to the spin_retry variable, a diagnose X'44' or diagnose X'9C', was issued every time through the spin lock loop. The spin_retry variable specifies the number of times to complete the spin loop before issuing a diagnose X'44' or diagnose X'9C'. The default value is 1000 but the value can be changed by /proc/sys/kernel/spin_retry.
Method
The Apache workload was used to create a z/VM 5.3 workload for this evaluation.
Although not demonstrated in this report section, diagnose X'9C' does not appear to provide a performance benefit over fast path diagnose X'44'. Consequently, demonstrating the benefit of diagnose X'9C' requires a base workload containing non fast path diagnose X'44's. Creation of non fast path diagnose X'44's requires a set of n-way users that can create a high rate of diagnose X'44's plus a set of users that can create a large processor queue. Both conditions are necessary or a high percentage of the diagnose X'44's with be fast path.
Spin lock variations were created for the Apache workload by varying the number of client virtual processors, the number of servers, the number of server virtual processors, and the number of client connections to each server. Actual values for these parameters are shown in the data tables.
Information about the diagnose X'44' and diagnose X'9C' rates is provided on the PRIVOP screen (FCX104) in Performance Toolkit for VM. The fast path diagnose X'44' rate is provided on the SYSTEM screen (FCX102). Total rates and percentages shown in the tables are calculated from these values.
Processor contention is indicated by the PLDV % empty and queue depth on the PROCLOG screen (FCX144) in Performance Toolkit for VM. PLDV % empty represents the percentage of time the local processor vectors do not have a queue. Lower values mean increased processor contention. PLDV queue depth represents the number of VMDBKs that are in the local processor vector. Larger values mean increased processor contention. Values for the diagnose X'44' base measurements are shown in the data tables. Values for the diagnose X'9C' measurements are similar to the base measurement values and are shown in the data tables.
Most of the performance experiments were conducted in a z990 2084-320 LPAR configured with 30G central storage, 8G expanded storage, and 9 dedicated processors using 500 1M URL files in a non-paging environment. One set of the performance experiments was repeated in a z9 2094-733 LPAR configured with 30G central storage, 5G expanded storage, and 9 dedicated processors using 500 1M URL files in a non-paging environment.
Informal measurements, not included in this report, using a z/OS Release 1.7 guest with a z/OS paging workload produced a range of improvements similar to the Apache workload.
Results and Discussion
The Apache results are presented in four separate sections. The first three sections contain results from the z990 experiments while the fourth section contain results from the z9 experiments. The first section has direct comparisons of diagnose X'9C' and diagnose X'44' on z/VM 5.3. The second section has another set of direct comparisons of diagnose X'9C' and diagnose X'44' on z/VM 5.3 but the measurements have different values for the Linux spin_retry variable, thus demonstrating the effect of this Linux improvement on the benefit for diagnose X'9C'. The third section has a comparison of the z/VM 5.3 diagnose X'9C' support compared to the z/VM 5.2 diagnose X'9C' support and demonstrates the value of other z/VM 5.3 improvements. The fourth section has direct comparisons of diagnose X'9C' and diagnose X'44' on z/VM 5.3 by processor model.
Improvement versus contention
Table 1 has the Apache results presented in this section which are direct comparisons of diagnose X'9C' and diagnose X'44' on z/VM 5.3 using Linux SLES 10 SP1 for the clients, and SLES 9 SP2 for servers. Since the servers are SLES 9, they will continue to issue diagnose X'44' and not diagnose X'9C' so all of the diagnose X'9C' benefit comes from the clients. Client virtual processors were increased from 4 to 6 between the first and second set of data. Server virtual processors were increased from 1 to 2 between the first and second set of data. The number of servers was doubled between each set of data.The improvement provided by diagnose X'9C' increased as the processor contention level increased. It started at 2.1% in the first set of data, increased to 9.8% for the second set of data, and increased to 11.1% for the third set of data.
Table 1. Apache Diagnose X'9C' Workload Measurement Data
| DIAG 44 - Run ID | DIAG44GA | DIAG44GB | DIAG44GC |
| DIAG 9C - Run ID | DIAG9CGA | DIAG9CGB | DIAG9CGC |
| Virtual CPUs/client | 4 | 6 | 6 |
| Servers | 8 | 16 | 32 |
| Virtual CPUs/server | 1 | 2 | 2 |
| DIAG 44 - Total DIAG 44 Rate | 119868 | 110729 | 78542 |
| DIAG 44 - % Fast Path | 87 | 73 | 72 |
| DIAG 44 - PLDV % Empty | 62 | 34 | 22 |
| DIAG 44 - PLDV Queue | 1 | 2 | 3 |
| DIAG 9C - Total DIAGs (44,44FP,9C) | 100015 | 111904 | 74877 |
| DIAG 9C - % DIAG 9C | 100 | 86.8 | 86.2 |
| Percent Throughput Improvement with DIAG 9C | 2.1 | 9.8 | 11.1 |
| Notes: 9 Dedicated Processors; Processor Model 2084-320; 30G Central Storage; 8G Expanded Storage; Apache Workload; 2 SLES 10 Clients; SLES 9 Servers; 1G Client Virtual Storage; 1.5G Server Virtual Storage; 1 MB URL file size; 1 Client Connection per Server; Default (1000) Linux spin_retry; z/VM 5.3. | |||
Effect of Linux spin_retry variable
Table 2 has the Apache results presented in this section which are direct comparisons of diagnose X'9C' and diagnose X'44' on z/VM 5.3 using Linux SLES 10 SP1 for both the clients and servers so the diagnose X'9C' benefit comes from both the clients and the servers. Client virtual processors were increased from 6 to 9 between the measurements in this section and the last set of data in the previous section. Server virtual processors were increased from 2 to 6 between the measurements in this section and the last set of data in the previous section. The number of client connections to each server was increased from 1 to 3 between the measurements in this section and the last set of data in the previous section.With this increased processor contention, the improvement provided by diagnose X'9C' for the first set of data in this section was 12.1% -- higher than any of the percentages in the previous section.
Although we don't recommend changing the Linux spin_retry value, we evaluated the diagnose X'9C' benefit with a spin_retry value of zero and observed an improvement of 32.2%. However, actual throughput for both measurements using a spin_retry value of 0 are much lower than corresponding measurements using the default spin_retry of 1000.
Table 2. Full Support for Diagnose X'9C' and the Linux spin_retry Effect
| DIAG 44 - Run ID | DIAG44GI | DIAG44GH |
| DIAG 9C - Run ID | DIAG9CGE | DIAG9CGH |
| Linux spin_retry | 1000 | 0 |
| DIAG 44 - Total Diag 44 Rate | 48306 | 257264 |
| DIAG 44 - % Fast Path | 58 | 83 |
| DIAG 44 - PLDV % Empty | 14 | 24 |
| DIAG 44 - PLDV Queue | 4 | 4 |
| DIAG 9C - Total DIAGs (44,44FP,9C) | 40980 | 101702 |
| DIAG 9C - % DIAG 9C | 100 | 100 |
| Percent Throughput Improvement with DIAG 9C | 12.1 | 32.2 |
| Notes: 9 Dedicated Processors; Processor Model 2084-320; 30G Central Storage; 8G Expanded Storage; Apache workload; 2 SLES 10 Clients; 1G Client Virtual Storage; 9 Virtual CPU's/client; 32 SLES 10 Servers; 1.5G Server Virtual Storage; 6 Virtual CPUs/server; 1 MB URL file size; 3 Client Connections per Server; z/VM 5.3. | ||
Benefit of other z/VM 5.3 performance improvements
Table 3 has the Apache results presented in this section which are a comparison between z/VM 5.3 and z/VM 5.2 for a diagnose X'9C' workload. The z/VM 5.3 measurement is from the first set of data in the previous section and uses Linux SLES 10 SP1 for both the clients and servers. Clients have 9 virtual processors and servers have 6 virtual processors.The results with z/VM 5.3 improved 10.8% over z/VM 5.2, thus demonstrating the value of other z/VM 5.3 performance improvements, especially the scheduler lock improvement.
Table 3. Performance Comparison: z/VM 5.3 vs. z/VM 5.2
| z/VM 5.2 - Run ID | DIAG9CGJ |
| z/VM 5.3 - Run ID | DIAG9CGE |
| z/VM 5.2 - Total DIAGs (44,44FP,9C) | 38514 |
| z/VM 5.2 - % DIAG 9C | 100 |
| z/VM 5.3 - Total DIAGs (44,44FP,9C) | 40980 |
| z/VM 5.3 - % DIAG 9C | 100 |
| Percent Throughput Improvement with z/VM 5.3 | 10.8 |
| Notes: 9 Dedicated Processors; Processor Model 2084-320; 30G Central Storage; 8G Expanded Storage; Apache workload; 2 SLES 10 Clients; 1G Client Virtual Storage; 9 Virtual CPU's/client; 32 SLES 10 Servers; 1.5G Server Virtual Storage; 6 Virtual CPUs/server; 1 MB URL file size; 3 Client Connections per Server; z/VM 5.3. | |
Effect of processor model
Table 4 has the Apache results presented in this section which are direct comparisons of diagnose X'9C' and diagnose X'44' on z/VM 5.3 using Linux SLES 10 SP1 for both the clients and servers so the diagnose X'9C' benefit comes from both the clients and the servers. The z990 measurements are from a previous section. The z9 measurements use the same workload and a nearly identical configuration as the z990 measurements. The only configuration difference, 3G of expanded storage, is not expected to affect the results since there is no expanded storage activity during the measurements.The improvement provided by diagnose X'9C' on the z9 processor was 9.9%, which is lower than the 12.1% provided on the z990 processor. Since the z9 base measurement in Table 4 shows a 26% increase in the diagnose X'44' rate over the z990 measurement with an equivalent contention level, one would expect a larger percentage improvement on the z9 processor. Measurement details, not included in the table, show overall throughput increased 61% between the z990 measurement and the z9 measurement. This means that diagnose X'44' is a smaller percentage of the workload on the z9 and that therefore one should expect a smaller percentage improvement on the z9 processor. Since Linux for System z does not use the SIGP Sense Running Status Order on z9 processors, it is not a factor in the results.
Table 4. Benefit by processor model
| DIAG 44 - Run ID | DIAG44GI | DIAG44XA |
| DIAG 9C - Run ID | DIAG9CGE | DIAG9CXA |
| Processor Model | 2084-320 | 2094-733 |
| Expanded Storage | 8G | 5G |
| DIAG 44 - Total Diag 44 Rate | 48306 | 61115 |
| DIAG 44 - % Fast Path | 58 | 55 |
| DIAG 44 - PLDV % Empty | 14 | 14 |
| DIAG 44 - PLDV Queue | 4 | 5 |
| DIAG 9C - Total DIAGs (44,44FP,9C) | 40980 | 50898 |
| DIAG 9C - % DIAG 9C | 100 | 100 |
| Percent Throughput Improvement with DIAG 9C | 12.1 | 9.9 |
| Notes: 9 Dedicated Processors; 30G Central Storage; Apache workload; 2 SLES 10 Clients; 1G Client Virtual Storage; 9 Virtual CPU's/client; 32 SLES 10 Servers; 1.5G Server Virtual Storage; 6 Virtual CPUs/server; 1 MB URL file size; 3 Client Connections per Server; z/VM 5.3. | ||
Summary and Conclusions
Diagnose X'9C' provided a 2% to 12% improvement over diagnose X'44' for various constrained configurations.
Diagnose X'9C' shows a higher percentage improvement over diagnose X'44' when the Linux for System z spin_retry value is reduced but overall results are best with the default spin_retry value.
z/VM 5.3 provided a 10.8% improvement over z/VM 5.2 for a diagnose X'9C' workload.
Back to Table of Contents.
Specialty Engine Support
Abstract
Guest support is provided for virtual CPU types of zAAP (IBM System z Application Assist Processors), zIIP ( IBM z9 Integrated Information Processors), and IFL (Integrated Facilities for LINUX Processors), in addition to general purpose CPs (Central Processors). These types of virtual processors can be defined for a z/VM user by issuing the DEFINE CPU command or placing the DEFINE CPU command in the directory. The system administrator can issue the SET CPUAFFINITY command to specify whether z/VM should dispatch user's specialty CPUs on real CPUs that match their types (if available) or simulate them on real CPs. On system configurations where the CPs and specialty engines are the same speed, performance results are similar whether dispatched on specialty engines or simulated on CPs. On system configurations where the specialty engines are faster than CPs, performance results are better when using the faster specialty engines and scale correctly based on the relative processor speed. CP monitor data and Performance Toolkit for VM both provide information relative to the specialty engines.
Introduction
This section of the report provides general observations about performance results and more detail about performance information available for effective use of the zAAP and zIIP specialty engine support. It will deal only with the z/VM support for zIIP and zAAP processors as used by a z/OS guest. References to specialty engine support in this section applies only to zIIP and zAAP processors and not IFLs.
Valid combinations of processors types are defined in z/VM: Running Guest Operating Systems. IFLs cannot be defined in the same virtual machine as a zIIP or a zAAP.
Without proper balance between the LPAR, z/VM, and guest settings, a system can have a large queue for one processor type while other processor types remain idle.
Method
The specialty engine support was evaluated using z/OS guest virtual machines and three separate workloads.A z/OS JAVA Workload described in z/OS JAVA Encryption Performance Workload provided use of the zAAP. This workload will run a processor at 100% utilization and is mostly eligible for a zAAP.
A z/OS DB2 Utility Workload described in z/OS DB2 Utility Workload provided use of a zIIP. Due to DASD I/O delays and processing that is not eligible for a zIIP, this workload can only utilize about 10% of a zIIP.
A z/OS SSL Performance Workload described in z/OS Secure Sockets Layer (System SSL) Performance Workload provided utilization of the CPs. It is capable of using all the available CP processors.
The workloads were measured independently and together in many different configurations. The workloads were measured with and without specialty engines in the configuration. The workloads were measured with all available SET CPUAFFINITY values (ON, OFF, and Suppressed). The workloads were also measured with z/OS running directly in an LPAR. Measurements of individual workloads were used to verify quantitative performance results. Measurements involving multiple workloads were used to evaluate the various controlling parameters and to demonstrate the available performance information but not for quantitative results.
New z/VM monitor data available with the specialty engine support is described in z/VM 5.3 Performance Management.
This report section will deal mostly with the controlling parameters and the available performance information rather than the quantitative results.
Results and Discussion
Results were always consistent with the speed and numbers of engines provided to the application. Balancing of the LPAR, z/VM, and guest processors configurations is the key to optimal performance. This section will deal mostly with performance information available for effective use of the specialty engine support. Without proper balance between the LPAR, z/VM, and guest settings, a system can have a large queue for one processor type while other processor types remain idle.This section contains examples of both Performance Toolkit data and z/OS RMF data. Terminology for processor type has varied in both and includes CP for Central Processors, IFA, AAP, ZAAP for zAAP, and IIP, ZIIP for zIIP.
Specialty Engines from a LPAR Perspective
The LPAR in which z/VM is running can have a mixture of central processors and various types of specialty engines. Processors can be dedicated to the z/VM LPAR or they can be shared with other LPARs. For LPARs with shared processors, the LPAR weight is used to determine the capacity factor for the z/VM LPAR. On z9 processors, the weight for specialty engines can be different than the weight for the primary engine. Shared processors can be capped or non-capped. A capped LPAR cannot exceed its defined capacity factor but a non-capped LPAR can use excess capacity from other LPARs. On some z9 and z990 models, the specialty engines are faster than the primary engines.
Identifying the Relative Processor Speeds
The Performance Toolkit can be used tell whether CPs and specialty processors run at the same speed or different speeds.
Here is an example (Runid E7411ZZ2) of the Performance Toolkit SYSCONF screen showing the same Cap value for CPs and specialty engines so dispatching on a virtualized engine does not have any performance advantage over simulation on a CP.
FCX180  Run 2007/06/20 12:21:10         SYSCONF
                                        System Configuration, Initial and Changed
_________________________________________________________________________________

 Initial Status on 2007/04/11 at 16:42, Processor 2094-733
 Real Proc: Cap  1456, Total 40, Conf 33, Stby  0, Resvd  7
 Sec. Proc: Cap  1456, Total  5, Conf  5, Stby  0, Resvd  2
Here is an example (Runid E7307ZZ2) of the Performance Toolkit SYSCONF screen showing a different Cap value for CPs and specialty engines so dispatching on a virtualized engine has a performance advantage over simulation on a CP. A smaller number means a faster processor.
FCX180  Run 2007/06/20 09:53:49         SYSCONF
                                        System Configuration, Initial and Changed
_________________________________________________________________________________

 Initial Status on 2007/03/07 at 21:30, Processor 2096-X03
 Real Proc: Cap  2224, Total  7, Conf  3, Stby  0, Resvd  4
 Sec. Proc: Cap  1760, Total  3, Conf  3, Stby  0, Resvd  2
Identifying Dedicated, Shared Weights, and Capping
Quantitative results can be affected by how the processors are defined for the z/VM LPAR. With dedicated processors, the z/VM LPAR gets full utilization of the processors. With shared processors, the z/VM LPAR's capacity factor is determined by the z/VM LPAR weight, the total weights for each processor type, and the total number of each type processor. If capping is specified, the z/VM LPAR cannot exceed it calculated capacity factor. If capping is not specified, the z/VM LPAR competes with other LPARs for unused cycles by processor type.
Here is an example (Runid E7307ZZ2) of the Performance Toolkit LPAR screen for the KST1 LPAR with dedicated CP, zAAP, and zIIP processors. It shows 100% utilization regardless of how much is actually being used by z/VM because it is a dedicated partition.
FCX126  Run 2007/06/20 09:53:49         LPAR
                                        Logical Partition Activity
__________________________________________________________________________________________
 Partition Nr.  Upid #Proc Weight Wait-C Cap %Load CPU %Busy %Ovhd %Susp %VMld %Logld Type
 KST1        4    04     5    DED    YES  NO  83.3   0 100.0    .0    .1  99.8   99.8 CP
                              DED         NO         1 100.0    .0    .1  99.8   99.8 CP
                              DED         NO         2 100.0    .0    .1  99.8   99.8 CP
                              DED         NO         3 100.0    .0    .1  96.0   96.0 ZAAP
                              DED         NO         4 100.0    .0    .1   8.8    8.8 ZIIP
Here is an example (Runid E7123ZI2) of the Performance Toolkit LPAR screen for the KST1 LPAR with shared but non-capped CP, zAAP, and zIIP processors. KST1's weight for specialty processors is 80 versus only 20 for CPs. A new table at the bottom of this screen shows the total weights by processor type. Although KST1's fair share of CPs is only 20%, its actual utilization is 99.9% because all other LPARs are idle. This particular measurement did not have any JAVA work so the zAAP utilization is nearly zero. The zIIP utilization is only 9.3% but that is about the maximum that can be achieved by a single copy of the DB2 Utility workload.
FCX126  Run 2007/06/20 09:55:12         LPAR
                                        Logical Partition Activity
__________________________________________________________________________________________

 Partition Nr.  Upid #Proc Weight Wait-C Cap %Load CPU %Busy %Ovhd %Susp %VMld %Logld Type
 KST1        4    04     5     20     NO  NO  51.5   0  99.9    .0    .1  99.9   99.9 CP
                               20         NO         1  99.9    .0    .1  99.8   99.9 CP
                               20         NO         2  99.9    .1    .1  99.8   99.9 CP
                               80         NO         3    .0    .0    .4    .0     .0 ZAAP
                               80         NO         4   9.3    .2    .3   9.0    9.0 ZIIP

 Summary of physical processors:
 Type  Number  Weight  Dedicated
 CP         3     100          0
 ZAAP       1     100          0
 IFL        1       0          0
 ZIIP       1     100          0
Here is an example (Runid E6B20ZA3) of the Performance Toolkit LPAR screen for the KST1 LPAR with shared capped CP, zAAP, and zIIP processors. KST1's weight for zAAPs is 80 versus only 20 for CPs and zIIPs. Utilization of the CPs showed the expected 20%. The summary shows there are 2 real zAAPs with a total weight of 100 and so KST1's weight of 80 would allow a capacity factor equal to 1.6 zAAPs. However, since the KST1 LPAR has a single zAAP it cannot use all the allocated capacity and it is limited to 100% of its single zAAP.
FCX126  Run 2007/06/20 09:56:47         LPAR
                                        Logical Partition Activity
__________________________________________________________________________________________

 Partition Nr.  Upid #Proc Weight Wait-C Cap %Load CPU %Busy %Ovhd %Susp %VMld %Logld Type
 KST1        4    04     5     20     NO YES  22.5   0  20.7    .0  78.3  20.7   95.0 CP
                               20        YES         1  20.7    .0  78.9  20.7   98.0 CP
                               20        YES         2  20.7    .0  78.6  20.7   96.5 CP
                               80        YES         3  95.5    .1    .1  95.4   95.5 ZAAP
                               20        YES         4    .0    .0    .1    .0     .0 ZIIP

Summary of physical processors:
Type  Number  Weight  Dedicated
CP         3     100          0
ZAAP       2     100          0
IFL        1       0          0
ZIIP       1     100          0
Here is an example (Runid E7123ZI2) of the Performance Toolkit LPARLOG screen for the KST1 LPAR with shared non-capped CP, zAAP, and zIIP processors. KST1's weight for zAAPs an zIIPs is 80 versus only 20 for CPs. This screen does not separate data by processor type so the utilization is an average for all types. The weight shown on this screen is for the last processor listed in the LPAR screen (a zIIP in this case). The label in the rightmost report column identifies KST1 as an LPAR with a mixture of engine types.
FCX202  Run 2007/06/20 09:55:12         LPARLOG
                                        Logical Partition Activity Log
_________________________________________________________________________________________________

 Interval <Partition->                                        <- Load per Log. Processor -->
 End Time Name     Nr.   Upid  #Proc Weight Wait-C Cap %Load  %Busy %Ovhd %Susp %VMld %Logld Type
 >>Mean>> KST1       4     04      5     80     NO  NO   ...   61.8    .1    .2  61.7   61.7 MIX
 >>Mean>> Total     ..     ..      6    100     ..  ..    .1   30.9    .0   ...   ...    ... ..
Specialty Engines from a z/VM Perspective
The CPUAFFINITY value is used to determine whether simulation or virtualization is desired for a guest's specialty engines. With CPUAFFINITY ON, z/VM will dispatch user's specialty CPUs on real CPUs that match their types. If no matching CPUs exist in the z/VM LPAR, z/VM will suppress this CPUAFFINITY and simulate these specialty engines on CPs. With CPUAFFINITY OFF, z/VM will simulate specialty engines on CPs regardless of the existence of matching specialty engines. z/VM's only use of specialty engines is for guest code that is dispatched on a virtual specialty processor. Without any guest virtual specialty processors, z/VM's real specialty processors will appear nearly idle in both the z/VM monitor data and the LPAR data. Interrupts are enabled so their usage will not be absolute zero. The Performance Toolkit SYSCONF screen was updated to provide information about the processor types and capacity factor by processor type.Here is an example (Runid E7123ZI2) of the Performance Toolkit SYSCONF screen showing the same number and capacity factor by processor type. Since this was a non-capped LPAR, the capacity shows 1000. The z/VM LPAR can only use this much if other shared LPARs do not use their fair share.
FCX180  Run 2007/06/20 09:55:12         SYSCONF
                                        System Configuration, Initial and Changed
_________________________________________________________________________________

 Initial Status on 2007/01/23 at 09:57, Processor 2096-X03
 Log. CP  : CAF  1000, Total  3, Conf  3, Stby  0, Resvd  0, Ded  0, Shrd  3
 Log. ZAAP: CAF  1000, Total  1, Conf  1, Stby  0, Resvd  0, Ded  0, Shrd  0
 Log. ZIIP: CAF  1000, Total  1, Conf  1, Stby  0, Resvd  0, Ded  0, Shrd  0
The Performance Toolkit PROCLOG screen was updated to provide
the processor type for each individual processor and to include
averages by processor type.
Here is an example (Runid E7307ZZ2) of the Performance Toolkit PROCLOG screen showing the utilization of the individual processors and the average utilization by processor type. This example has all three workloads active, the z/OS and z/VM configurations are identical, CPUAFFINITY is ON, and shows full utilization of CPs and zAAPs, but only about 10% utilization of the zIIP. These values are consistent with the workload characteristics.
FCX144  Run 2007/06/20 09:53:49         PROCLOG
                                        Processor Activity, by Time
_______________________________________________________________________

                  <------ Percent Busy -------> <--- Rates per Sec.--->
           C
 Interval  P                                     Inst
 End Time  U Type Total  User  Syst  Emul  Vect  Siml  DIAG  SIGP  SSCH
 >>Mean>>  0 CP    99.8  99.5    .3  97.9  .... 125.0  12.6    .7  71.6
 >>Mean>>  1 CP    99.8  99.5    .2  98.0  .... 120.9   4.5    .8  58.4
 >>Mean>>  2 CP    99.8  99.5    .3  98.0  .... 123.4   3.2    .7  59.5
 >>Mean>>  3 ZAAP  96.0  96.0    .1  95.8  ....   1.1    .0  36.6   1.4
 >>Mean>>  4 ZIIP   8.8   8.4    .4   8.1  ....   1.0    .0 289.9   7.5

 >>Mean>>  . CP    99.7  99.5    .2  98.0  .... 123.0   6.7    .7  63.1
 >>Mean>>  . ZAAP  96.0  96.0    .1  95.8  ....   1.1    .0  36.6   1.4
 >>Mean>>  . ZIIP   8.8   8.4    .4   8.1  ....   1.0    .0 289.9   7.5


(Report split for formatting purposes.  Ed.)


___________________________________________________________

 <--------- PLDV ----------> <------ Paging -------> <Comm>
 Pct  Mean VMDBK VMDBK    To Below        Fast  Page
 Em-  when Mastr Stoln Mastr   2GB  PGIN  Path Reads   Msgs
 pty Non-0  only    /s    /s    /s    /s     %    /s     /s
   0     1     0    .2    .8    .0    .0  ....    .0     .6
 100     0  ....    .1    .0    .0    .0  ....    .0     .1
 100     1  ....    .1    .0    .0    .0  ....    .0     .1
 100     1  ....    .0    .0    .0    .0  ....    .0     .0
  97     1  ....    .0    .0    .0    .0  ....    .0     .0

  66     0  ....    .1    .2    .0    .0  ....    .0     .2
 100     1  ....    .0    .0    .0    .0  ....    .0     .0
  97     1  ....    .0    .0    .0    .0  ....    .0     .0
Here is an example (runid E7320ZZ2) of the Performance Toolkit PROCLOG screen showing the utilization of the individual processors and the average utilization by processor type. This example has all three workloads active, the z/OS and z/VM configurations are identical (3 CPs, 1 zAAP, and 1 zIIP), and CPUAFFINITY is OFF. With CPUAFFINITY OFF, z/VM will simulate the virtual zAAP and zIIP on CPs, resulting in 100% utilization plus queuing for the CPs while the zAAP and zIIP are idle. Since CPUAFFINITY defaults to ON, the SET CPUAFFINITY command must be used to create this configuration.
FCX144  Run 2007/06/20 09:50:18         PROCLOG
                                        Processor Activity, by Time
_______________________________________________________________________

                  <------ Percent Busy -------> <--- Rates per Sec.--->
           C
 Interval  P                                     Inst
 End Time  U Type Total  User  Syst  Emul  Vect  Siml  DIAG  SIGP  SSCH
 >>Mean>>  0 CP    99.9  99.4    .4  98.2  ....  98.5  18.8    .2  54.2
 >>Mean>>  1 CP    99.9  99.6    .3  98.3  ....  94.9   3.5    .3  43.5
 >>Mean>>  2 CP    99.9  99.5    .3  98.3  ....  85.8   4.5    .3  41.9
 >>Mean>>  3 ZAAP    .0    .0    .0    .0  ....    .0    .0    .0   1.5
 >>Mean>>  4 ZIIP    .0    .0    .0    .0  ....    .0    .0    .0   5.0

 >>Mean>>  . CP    99.8  99.5    .3  98.3  ....  93.0   8.9    .2  46.5
 >>Mean>>  . ZAAP    .0    .0    .0    .0  ....    .0    .0    .0   1.5
 >>Mean>>  . ZIIP    .0    .0    .0    .0  ....    .0    .0    .0   5.0


(Report split for formatting purposes.  Ed.)


___________________________________________________________

 <--------- PLDV ----------> <------ Paging -------> <Comm>
 Pct  Mean VMDBK VMDBK    To Below        Fast  Page
 Em-  when Mastr Stoln Mastr   2GB  PGIN  Path Reads   Msgs
 pty Non-0  only    /s    /s    /s    /s     %    /s     /s
   0     1     0   2.3    .9    .0    .0  ....    .0     .7
  57     1  ....   2.0    .0    .0    .0  ....    .0     .1
  57     1  ....   2.0    .0    .0    .0  ....    .0     .1
 100     0  ....    .0    .0    .0    .0  ....    .0     .0
 100     0  ....    .0    .0    .0    .0  ....    .0     .0

  38     1  ....   2.1    .3    .0    .0  ....    .0     .2
 100     0  ....    .0    .0    .0    .0  ....    .0     .0
 100     0  ....    .0    .0    .0    .0  ....    .0     .0
Specialty Engines from a z/VM Guest Perspective
Performance of an individual guest is controlled by the z/VM share setting and the SET CPUAFFINITY command.The share setting for a z/VM guest determines the percentage of available processor resources for the individual guest. The share setting for a virtual machine applies to each pool of the processor types (CP, IFL, zIIP, zAAP). Shares are normalized to the sum of shares for virtual machines in the dispatcher list for each pool of processor type. Since the sum will not necessarily be the same for each processor type, an individual guest could get a different percentage of a real processor for each processor type. The share setting for individual guests is shown in the Performance Toolkit UCONF screen.
Here is an example (Runid E7307ZZ2) of the Performance Toolkit UCONF screen showing the number of processors and the share settings for the ZOS1 virtual machine. It shows the 5 defined processors but does not show the individual processor types ( 3 CPs, 1 zAAP, and 1 zIIP). The relative share of 100 will be applied independently for each processor type and so these 5 virtual processors will not necessarily have the same percentage of a real processor.
FCX226  Run 2007/06/20 09:53:49         UCONF
                                        User Configuration Data
____________________________________________________________________________________________________

                                  <-------- Share -------->                     No     Stor
                 Virt  Mach Stor                  %    Max. Max.  Max.   QUICK  MDC    Size Reserved
 Userid     SVM  CPUs  Mode Mode  Relative Absolute Value/% Share Limit  DSP    Fair   (MB)    Pages
 ZOS1       No      5  EME  V=V        100      ...     ... ..    ..     Yes    Yes   4096M        0
The sum of
dispatcher list
share setting is shown
in the Performance Toolkit SCHEDLOG
screen. It is a global value and
does not contain
any information about the individual processor types.
Here is an example (Runid E7307ZZ2) of the Performance Toolkit SCHEDLOG screen showing 5 virtual processors in the dispatcher list with total share settings of 101. It does not show the individual processor types. Its does show that ZOS1 is generally the only guest in the dispatch list.
FCX145  Run 2007/06/20 09:53:49         SCHEDLOG
                                        Scheduler Queue Lengths, by Time
___________________________________________________________________________

          Total <-- Users in Dispatch List ---> Lim <- In Eligible List -->
 Interval VMDBK                  <- Loading -->  it             < Loading->
 End Time  in Q  Q0  Q1  Q2  Q3  Q0  Q1  Q2  Q3 Lst  E1  E2  E3  E1  E2  E3
 >>Mean>>   5.1 5.1  .0  .0  .0  .0  .0  .0  .0  .0  .0  .0  .0  .0  .0  .0


(Report split for formatting purposes.  Ed.)


_____________________________________________________

 Class 1 Sum of Sum of <----- Storage (Pages) ------>
 Elapsed   Abs.   Rel.  Total <----- Total WSS ----->
 T-Slice Shares Shares Consid    Q0    Q1    Q2    Q3
   1.133     0%    101  1022k  881k    56     0     0
The overall processor usage for individual guests is shown in the Performance Toolkit USER screen but it does not show individual processor types.
Here is an example (Runid E7307ZZ2) of the Performance Toolkit USER screen showing the ZOS1 guest using slightly more than 4 processors. It does not show the individual processor types ( 3 CPs, 1 zAAP, and 1 zIIP).
FCX112  Run 2007/06/20 09:53:49         USER
                                        General User Resource Utilization
_________________________________________________________________________________

           <----- CPU Load -----> <------ Virtual IO/s ------>
                <-Seconds->   T/V
 Userid    %CPU  TCPU  VCPU Ratio Total DASD Avoid Diag98   UR Pg/s  User Status
 ZOS1       403  4914  4853   1.0   173  173    .0     .0   .0   .0  EME,CL0,DISP


(Report split for formatting purposes.  Ed.)


______________________________________________

 <-User Time-> <--Spool-->    MDC
 <--Minutes--> Total  Rate Insert        Nr of
 Logged Active Pages SPg/s  MDC/s Share  Users
     20     20     0   .00    ...   100
The Performance Toolkit USER Resource Detail Screen (FCX115) has additional information for a virtual machine but it does not show processor type so no example is included.
For a z/OS guest, RMF data provides number and utilization of CP, zAAP, and zIIP virtual processors. The RMF reporting of data is not affected by the CPUAFFINITY setting but the actual values can be affected, as demonstrated by the next two examples.
Although the Performance Toolkit does not provide any information about the CPUAFFINITY setting, it can be determined from the QUERY CPUAFFINITY command or from a flag in z/VM monitor data z/VM monitor data Domain 4 Record 3.
Here is an example (Runid E7307ZZ2) of the RMF CPU Activity report showing the processor utilization by processor type with all three workloads active, identical z/OS and z/VM configurations (3 CPs, 1 zAAP, and 1 zIIP), and CPUAFFINITY ON.
The RMF reported processor utilization for each processor type matches the z/VM reported utilization for this measurement which is shown as an example in Performance Toolkit data.
                                                       C P U  A C T I V I T Y

            z/OS V1R8                SYSTEM ID UNKN             DATE 03/07/2007
                                     RPT VERSION V1R8 RMF       TIME 21.31.08
CPU  2096   MODEL  X03   H/W MODEL  S07
---CPU---  ONLINE TIME   LPAR BUSY       MVS BUSY      CPU SERIAL  I/O TOTAL
NUM  TYPE  PERCENTAGE    TIME PERC       TIME PERC     NUMBER      INTERRUPT RAT
 0   CP    100.00        ----            99.96         047D9B       0.06
 1   CP    100.00        ----            99.96         047D9B       0.06
 2   CP    100.00        ----            99.96         047D9B      175.8
CP   TOTAL/AVERAGE       ----            99.96                     176.0
 3   AAP   100.00        ----            97.46         047D9B
AAP  AVERAGE             ----            97.46
 4   IIP   100.00        ----             9.16         047D9B
IIP  AVERAGE             ----             9.16
Here is an example (Runid E7320ZZ2) of the RMF CPU Activity report showing processor utilization by processor type with all three workloads active, identical z/OS and z/VM configurations (3 CPs, 1 zAAP, and 1 zIIP), and CPUAFFINITY OFF.
With CPUAFFINITY OFF, z/VM will not use the real zAAP or zIIP but simulate them on a CP, thus the five virtual processors need to be dispatched on the three z/VM CPs. The RMF reported zIIP utilization is much higher than our workload is capable of generating and demonstrates the need to balance the LPAR, z/VM, and z/OS configuration. With CPUAFFINITY OFF, z/OS will report the zIIP as busy when it is queued for a processor by z/VM.
The RMF reported processor utilization for each processor type does not match the z/VM reported utilization for this measurement, which is shown as an example in Performance Toolkit data.
                                                       C P U  A C T I V I T Y

            z/OS V1R8                SYSTEM ID UNKN             DATE 03/20/2007
                                     RPT VERSION V1R8 RMF       TIME 16.31.22
CPU  2096   MODEL  X03   H/W MODEL  S07
---CPU---  ONLINE TIME   LPAR BUSY       MVS BUSY      CPU SERIAL  I/O TOTAL
NUM  TYPE  PERCENTAGE    TIME PERC       TIME PERC     NUMBER      INTERRUPT RATE
 0   CP    100.00        ----            99.95         047D9B       0.03
 1   CP    100.00        ----            99.96         047D9B       0.03
 2   CP    100.00        ----            99.96         047D9B      124.4
CP   TOTAL/AVERAGE       ----            99.96                     124.5
 3   AAP   100.00        ----            99.57         047D9B
AAP  AVERAGE             ----            99.57
 4   IIP   100.00        ----            29.58         047D9B
IIP  AVERAGE             ----            29.58


(Report split for formatting purposes.  Ed.)


        INTERVAL 19.59.939
        CYCLE 1.000 SECONDS

   % I/O INTERRUPTS
   HANDLED VIA TPI
    0.00
    4.88
    5.15
    5.15
It will be more difficult to correlate the z/OS data and the z/VM data when multiple guests have specialty engines and different share values.
Summary and Conclusions
Results were always consistent with the speed and numbers of engines provided to the application. Balancing of the LPAR, z/VM, and guest processors configurations is the key to optimal performance.Back to Table of Contents.
SCSI Performance Improvements
Abstract
z/VM 5.3 contains several performance improvements for I/O to emulated FBA on SCSI (EFBA, aka EDEV) volumes. First, z/VM now exploits the SCSI write-same function of the IBM 2105 and 2107 DASD subsystems, so as to accelerate the CMS FORMAT function for minidisks on EDEVs. Compared to z/VM 5.2, z/VM 5.3 finishes such a FORMAT in 41% less elapsed time and consumes 97% less CPU time. Second, the Control Program (CP) modules that support SCSI were tuned to reduce path length for common kinds of I/O requests. This tuning resulted in anywhere from a 4% to 15% reduction in CP CPU time per unit of work, depending on the workload. Third, for CP paging to EDEVs, the Control Program paging subsystem was changed to bypass FBA emulation and instead call the SCSI modules directly. In our workload, this enhancement decreased CP CPU time per page moved by about 25%.
Introduction
In z/VM 5.1, IBM shipped support that let the Control Program (CP) use a zSeries Fibre Channel Protocol (FCP) adapter to perform I/O to SCSI LUNs housed in various IBM storage controllers, such as those of the IBM 2105 family. The basic idea behind the z/VM SCSI support was that a fairly low layer in CP would use SCSI LUNs as backing store for emulation of Fixed Block Architecture (FBA) disk volumes. With this FBA emulation in place, higher levels of CP, such as paging and spooling, could use low-cost SCSI DASD instead of more-expensive ECKD DASD. The FBA emulation also let CP place user minidisks on SCSI volumes. Thus, guests not aware of SCSI and FCP protocols could use SCSI storage, CP having fooled those guests into thinking the storage were FBA. IBM's objective in supporting SCSI DASD on z/VM was to help customers reduce the cost of their disk storage subsystems.
Since z/VM 5.1, IBM has made improvements in the performance of z/VM's use of SCSI LUNs. Late in z/VM 5.1, IBM shipped APARs VM63534 and VM63725, which contained performance improvements for I/O to emulated FBA (EFBA) volumes. IBM included those APARs in z/VM 5.2 and documented their effect in its study of z/VM 5.2 disk performance.
In z/VM 5.3, IBM continued its effort to improve performance of emulated FBA volumes, doing work in these areas:
- The CMS FORMAT command and the CP SCSI layer (sometimes called the SCSI container) now exploit the write-same function of the IBM 2105 and 2107 disk subsystems. Write-same lets CP pass the storage subsystem a single 512-byte buffer and tell the the storage subsystem to write that buffer repeatedly onto a sequence of FB-512 blocks on the LUN.
- The SCSI container was tuned to remove instructions from frequently-used code paths.
- The CP paging and spooling subsystems no longer build FBA channel programs to do I/O to emulated FBA DASD. In other words, CP paging and spooling no longer depend on CP's FBA emulation to translate FBA I/O requests to SCSI ones. Rather, paging and spooling now call the SCSI container directly, bypassing the building of FBA channel programs and bypassing FBA emulation's conversion and handling of those channel programs. There are two consequences to this change. First, CPU time per page moved is reduced, because the overhead of building an FBA channel program and then emulating it on SCSI were both eliminated. Second, because the SCSI container can overlap I/Os to a LUN, paging and spooling can now have more than one I/O in progress at a time when using EDEVs.
This report chapter describes the four different experiments IBM performed to measure the effects of these improvements.
SCSI Write-Same: CMS FORMAT
Method
Overview: We set up a CMS user ID with a minidisk on an EDEV. We formatted the minidisk with write-same disabled and then again with write-same enabled. For each case, we measured elapsed time and processor time consumed.
Environment: See table notes.
Data collected: We collected CP QUERY TIME data and CP monitor data.
Results and Discussion
| EFBA Minidisk Fast-Format Results | ||||
| Metric | z/VM 5.2 | z/VM 5.3 | Delta | % Delta |
| Elapsed time (sec) | 468 | 276 | -192 | -41% |
| CP CPU time (msec) | 610 | 20 | -590 | -97% |
| Virtual CPU time (msec) | 0 | 0 | 0 | 0% |
| Total CPU time (msec) | 610 | 20 | -590 | -97% |
| Notes: 2084-C24, model-capacity indicator 322. Two dedicated engines, 2 GB central, 2 GB XSTORE. 2105-F20, 16 GB, one 1 Gb FCP chpid. z/VM 5.2 serviced through May 2007. z/VM 5.3 GA RSU. CMS FORMAT ( BLKSIZE 4K of a 10 GB minidisk on a 100 GB EDEV. | ||||
SCSI write-same removed 41% of the elapsed time and 97% of the CP CPU time from the formatting of this minidisk.
SCSI Container Tuning: XEDIT Read
Method
Overview: We gave a CMS guest a 4-KB-formatted minidisk on an emulated FBA volume, MDC OFF. We ran an exec that looped on XEDIT reading a 100-block file from the minidisk. We measured XEDIT file loads per second and CP CPU time per XEDIT file load.
Environment: See table notes.
Data collected: We counted XEDIT file loads per second and used this as the transaction rate. We also collected zSeries hardware sampler data. We used the sampler data to calculate CP CPU time used per transaction.
Results and Discussion
| EFBA Minidisk XEDIT Read Results | ||||
| Metric | z/VM 5.2 | z/VM 5.3 | Delta | % Delta |
| Read rate (/sec) | 100.9 | 102.2 | 1.3 | 1.3% |
| CP CPU/read (usec) | 1121.23 | 1005.17 | -116.06 | -10.4% |
| Virtual CPU/read (usec) | 360.79 | 366.12 | 5.33 | 1.5% |
| Total CPU/read (usec) | 1482.02 | 1371.29 | -110.73 | -7.47% |
| Notes: 2084-B16, model-capacity indicator 320. Partition with three dedicated engines, 4 GB central, 2 GB XSTORE. 2105-F20, 16 GB, one 1 Gb FCP chpid. z/VM 5.2 with all service applied (May 2007). z/VM 5.3 GA RSU. | ||||
The SCSI container tuning resulted in about a 10% reduction in CP CPU time per unit of data moved. Transaction rate increased slightly.
SCSI Container Tuning: Linux IOzone
Method
Overview: We ran a subset of our IOzone workloads as described in our IOzone appendix. Because Linux disk performance is a topic of continuing interest, we chose to run not only the emulated FBA cases, but also some ECKD and Linux-native cases.
Environment: See table notes.
Data collected: To assess data rates, we collected IOzone console output. To assess CPU time per unit of work, we used the zSeries hardware sampler.
Results and Discussion
|
IOzone Overall Results (scaled to z/VM 5.2) |
||||
| Configuration | KB/sec | Total CPU/KB | CP CPU/KB | Virtual CPU/KB |
| ECKD SSCH | ||||
| EDED | 1.00 | 0.99 | 0.94 | 1.00 |
| EMD0 | 0.99 | 0.98 | 0.94 | 0.99 |
| EMD1 | 1.00 | 0.98 | 0.96 | 0.99 |
| EFBA SSCH | ||||
| FDED | 1.01 | 0.92 | 0.85 | 0.99 |
| FMD0 | 1.01 | 0.92 | 0.86 | 0.99 |
| FMD1 | 1.00 | 0.93 | 0.87 | 1.00 |
| ECKD Diag X'250' | ||||
| D240 | 1.00 | 0.99 | 0.94 | 0.99 |
| D241 | 1.01 | 0.99 | 0.98 | 0.99 |
| EFBA Diag X'250' | ||||
| G240 | 1.01 | 0.96 | 0.87 | 0.99 |
| G241 | 1.00 | 0.96 | 0.91 | 1.00 |
| Linux native SCSI | ||||
| LNS0 | 1.01 | 0.98 | 0.90 | 0.99 |
| Notes: 2084-B16, model-capacity indicator 320. Partition with three dedicated engines, 4 GB central, 2 GB XSTORE. 2105-F20, 16 GB, one FICON chpid, one 1 Gb FCP chpid. z/VM 5.2 with all service applied (May 2007). z/VM 5.3 GA RSU. Linux SLES 9 SP 3, 192 MB, 64-bit, virtual uniprocessor. See our IOzone appendix for workload descriptions. | ||||
We see that in all cases, z/VM 5.3 equalled z/VM 5.2 in data rate and in virtual time per unit of work. For CP CPU time per unit of work, improvements range from 4% to 15%. Improvements in the FBA cases (Fxxx, Gxxx) exceed improvements in the other cases (Exxx, Dxxx, Lxxx) because of z/VM 5.3's tuning in the SCSI container.
Paging and Spooling: FBA Emulation Bypass
Method
Overview: We used a CMS Rexx program to induce paging on a z/VM system specifically configured to be storage-constrained. This program used the Rexx storage() function to touch virtual storage pages randomly, with a uniform distribution. By running this program in a storage-constrained environment, we induced page faults.
Configuration: We used the following configuration:
- 2084-C24, model-capacity indicator 322.
- Partition with two dedicated engines, 2 GB central storage, 0 GB expanded storage.
- No activity in the partition being measured, except our CMS guest and the test case driver. All other partitions either shut down or idling.
- 2105-F20, 16 GB of cache, FICON or FCP attached.
- z/VM 5.2 serviced through May 2007, or z/VM 5.3, as called out in the tables below.
- Two 2 GB paging volumes, either two ECKD or two EFBA (EDEV).
- 512 MB CMS guest, configured to use the Rexx storage() function to touch pages randomly within a 480 MB address range of the virtual machine.
- 944 MB of other virtual machines logged on, all with their addresses spaces completely locked into storage via CP LOCK REAL.
- CP SET TRACEFRAMES was set artificially high so that we would end up with about 180 MB of real storage frames available for holding pages of the thrashing CMS guest.
- We ran the thrasher for 20 minutes unmeasured, then collected data for five minutes. Measurements reported here are from the five-minute measured interval.
The net effect of this configuration was that the z/VM Control Program would have about 180 MB of real storage to use to run a CMS guest that was trying to touch about 480 MB worth of its pages. This ratio created a healthy paging rate. Further, the Control Program would have to run this guest while dealing with large numbers of locked user pages and CP trace table frames. This let us exercise real storage management routines that were significantly rewritten for z/VM 5.3.
One other note about configuration. We are aware that comparing ECKD paging to SCSI paging is a topic of continuing interest. So, we ran this pair of experiments with ECKD DASD as well as with SCSI DASD. This lets us illustrate the differences in CP CPU time per page moved for the two different DASD types.
Data collected: We measured transaction rate by measuring pages touched per second by the thrasher. Being interested in how CP overhead had changed since z/VM 5.2, we also measured CP CPU time per page moved. Finally, being interested in the efficacy of CP's storage management logic, we calculated the pages CP moved per page the thrasher touched. Informally, we thought of this metric as commenting on how "smart" CP was being about keeping the "correct" pages in storage for the thrasher. Though this metric isn't directly related to an assessment of SCSI I/O performance, we are reporting it here anyway as a matter of general interest.
Results and Discussion
| SCSI Paging, z/VM 5.2 to z/VM 5.3 | ||||
| Metric | z/VM 5.2 | z/VM 5.3 | Delta | % Delta |
| Page moves (/sec) | 3528 | 3523 | -5 | 0% |
| CP/move (usec) | 37.7 | 28.5 | -9.2 | -24% |
| Page touches (/sec) | 2627 | 2616 | -11 | 0.4% |
| Virt/touch (usec) | 51.8 | 51.6 | -0.2 | 0% |
| Moves/touch | 1.35 | 1.35 | 0 | 0% |
| Notes: 2084-C24, model-capacity indicator 322. Two dedicated engines, 2 GB central, 0 GB XSTORE. 2105-F20, 16 GB, one 1 Gb FCP chpid. z/VM 5.2 with all service applied (May 2007). z/VM 5.3 GA RSU. 944 MB of locked users. 180 MB of DPA. RXTHR2 in 512 MB virtual, thrashing randomly in 480 MB. | ||||
For paging to SCSI, we see that transaction rate and page touch rate are unchanged, but CP time per page moved is down about 25%. This is due to the z/VM 5.3 FBA bypass for paging and spooling.
| ECKD Paging, z/VM 5.2 to z/VM 5.3 | ||||
| Metric | z/VM 5.2 | z/VM 5.3 | Delta | % Delta |
| Page moves (/sec) | 2277 | 2119 | -158 | -6.9% |
| CP/move (usec) | 10.2 | 11.8 | 1.6 | 15.7% |
| Page touches (/sec) | 1597 | 1785 | 188 | 11.8% |
| Virt/touch (usec) | 51.1 | 51.1 | 0 | 0% |
| Moves/touch | 1.43 | 1.18 | -0.25 | -17.5% |
| Notes: 2084-C24, model-capacity indicator 322. Two dedicated engines, 2 GB central, 0 GB XSTORE. 2105-F20, 16 GB, one 1 Gb FCP chpid. z/VM 5.2 with all service applied (May 2007). z/VM 5.3 GA RSU. 944 MB of locked users. 180 MB of DPA. RXTHR2 in 512 MB virtual, thrashing randomly in 480 MB. | ||||
For paging to ECKD, we see that CP time per page moved is elevated slightly in z/VM 5.3. Analysis of zSeries hardware sampler data showed that the increases are due to changes in the CP dispatcher so as to support specialty engines. (For paging to SCSI, the dispatcher growth from specialty engines support is also present, but said growth was more than paid off by the FBA emulation bypass.) We also see that page touches per second are increased by 12%, with moves per touch down by almost 18%. For this particular workload, z/VM 5.3 was more effective than z/VM 5.2 at keeping the correct user pages in storage, thus letting the application experience a higher transaction rate (aka page touch rate).
Finally, the CPU cost of SCSI paging compared to ECKD paging is a topic of continuing interest. On z/VM 5.2, we see that the ratio of CP/move is (37.7/10.2), or 3.7x. On z/VM 5.3, we see that the ratio is (28.5/11.8), or 2.4x. The FBA emulation bypass helped bring the CPU cost of SCSI paging toward the cost of ECKD paging.
Back to Table of Contents.
z/VM HyperPAV Support
Abstract
In z/VM 5.3, the Control Program (CP) can use the HyperPAV feature of the IBM System Storage DS8000 line of storage controllers. The HyperPAV feature is similar to IBM's PAV (Parallel Access Volumes) feature in that HyperPAV offers the host system more than one device number for a volume, thereby enabling per-volume I/O concurrency. Further, z/VM's use of HyperPAV is like its use of PAV: the support is for ECKD disks only, the bases and aliases must all be ATTACHed to SYSTEM, and only guest minidisk I/O or I/O provoked by guest actions (such as MDC full-track reads) is parallelized.
We used our PAV measurement workload to study the performance of HyperPAV aliases as compared to classic PAV aliases. We found, as we expected, that HyperPAV aliases match the performance of classic PAV aliases. However, HyperPAV aliases require different management and tuning techniques than classic PAV aliases did. This section discusses the differences and illustrates how to monitor and tune a z/VM system that uses PAV or HyperPAV aliases.
Introduction
In May 2006 IBM equipped z/VM 5.2 with the ability to use Parallel Access Volumes (PAV) aliases so as to parallelize I/O to user extents (minidisks) on SYSTEM-attached volumes. In its PAV section, this report describes the performance characteristics of z/VM's PAV support, under various workloads, on several different IBM storage subsystems. Readers not familiar with PAV or not familiar with z/VM's PAV support should read that section and our PAV technology description before continuing here.
With z/VM 5.3, IBM extended z/VM's PAV capability so as to support the IBM 2107's HyperPAV feature. Like PAV, HyperPAV offers the host system the opportunity to use many different device numbers to address the same disk volume, thereby enabling per-volume I/O concurrency. Recall that with PAV, each alias device is affiliated with exactly one base, and it remains with that base until the system programmer reworks the I/O configuration. With HyperPAV, though, the base and alias devices are grouped into pools, the rule being that an alias device in a given pool can perform I/O on behalf of any base device in said pool. This lets the host system achieve per-volume I/O concurrency while potentially consuming fewer device numbers for alias devices.
IBM's performance objective for z/VM's HyperPAV support was that with equivalent numbers of aliases, HyperPAV disk performance should equal PAV disk performance. Measurements showed z/VM 5.3 meets this criterion, to within a very small margin. The study revealed, though, that the performance management techniques necessary to exploit HyperPAV effectively are not the same as the techniques one would use to exploit PAV. Rather than discussing the performance of HyperPAV aliases, this section describes the performance management techniques necessary to use HyperPAV effectively. For completeness' sake, this section also discusses tuning techniques appropriate for classic PAV.
Customers must apply VM64248 (UM32072) to z/VM 5.3 for its HyperPAV support to work correctly. This fix is not on the z/VM 5.3 GA RSU. Customers must order it from IBM.
z/VM Performance Toolkit does not calculate volume response times correctly for base or alias devices, either classic PAV or HyperPAV. Service times, I/O rates, and queue depths are correct. In this section, DEVICE report excerpts for classic PAV scenarios have been hand-corrected to show accurate response time values. DEVICE report excerpts for HyperPAV scenarios have not been corrected.
Understanding Disk Performance
Largely speaking, z/VM disk performance can be understood by looking at the amount of time a guest machine perceives is required to do a single I/O operation to a single disk volume. This time, called response time, consists of two main components. The first, queue time (aka wait time), is the time the guest's I/O spends waiting for access to the appropriate real volume. The second component, service time, is the time required for the System z I/O subsystem to perform the real I/O, once z/VM starts it.
Technologies like PAV and HyperPAV can help reduce queue time in that they provide the System z host with means to run more than one real I/O to a volume concurrently. This is similar to there being more than one teller window operating at the local bank. Up to a certain point, adding tellers helps decrease the amount of time a customer stands in line waiting for a teller to become available. In a similar fashion, PAV and HyperPAV aliases help decrease the amount of time a guest I/O waits in queue for access to the real volume.
This idea -- that PAV and HyperPAV offer I/O concurrency and thereby decrease the likelihood of I/Os queueing at a volume -- leads us to our first principle as regards using PAV or HyperPAV to adjust volume performance. If a volume is not experiencing queueing, adding aliases for the volume will not help the volume's performance. Consider adding aliases for a volume only if there is an I/O queue for the volume.
In the bank metaphor, once a given customer has reached a teller, the number of other tellers working does not appreciably change the time needed to perform a customer's transaction. With PAV and HyperPAV, though, IBM has seen evidence that in some environments, increasing the number of aliases for a volume can increase service time for the volume. Most of the time, the decrease in wait time outweighs the increase in service time, so response time improves. At worst, service time increases exactly as wait time decreases, so response time stands unchanged.
This trait -- that adding aliases will generally change the split between wait time and service time, but will generally not increase their sum -- leads us to our second principle for using PAV or HyperPAV. If a queue is forming at a volume, add aliases until you run out of alias capability, or until the queue disappears. Depending on the workload, it might take several aliases before things start to get better.
A performance analyst can come to an understanding of the right number of PAV or HyperPAV aliases for his environment by examining the disk performance statistics z/VM emits in its monitor data. Performance monitoring products such as IBM's z/VM Performance Toolkit comment on device performance and thus are invaluable in tuning and configuring PAV or HyperPAV.
The Basic DEVICE Report
z/VM Performance Toolkit emits a report called DEVICE which comments on the performance statistics for the z/VM system's real devices. This report is the analyst's primary tool for understanding disk performance. Below is an excerpt from the DEVICE report for one of the disk exercising workloads we use for PAV and HyperPAV measurements, run with no aliases.
Readers: please note that due to browser window width limitations, all of the report excerpts in this section are truncated on the right, after the "Req. Qued" column. The rest of the columns are interesting, but not in this discussion. Ed.
FCX108  Run 2007/06/05 14:00:12         DEVICE
                                        General I/O Device Load and Performance
From 2007/05/27 15:00:14
To   2007/05/27 15:10:14
For    600 Secs 00:10:00                Result of Y040180P Run
________________________________________________________________________________

 .    .                     .      ___     .    .    .    .    .    .    .    .
 <-- Device Descr. -->  Mdisk Pa- <-Rate/s-> <------- Time (msec) -------> Req.
 Addr Type   Label/ID   Links ths  I/O Avoid Pend Disc Conn Serv Resp CUWt Qued
 522A 3390-3 BWPVS0         0   4  755    .0   .2   .2   .9  1.3  3.7   .0 1.84
The following columns are interesting in this discussion:
- I/O is the I/O rate for the device, in operations per second.
- Serv (service time) is the average amount of time (milliseconds) the device is using in performing a single I/O.
- Resp (response time) is the average amount of time (milliseconds) the guest machine perceives is required to perform an I/O to its minidisk on the volume. Response time includes service time plus wait time (aka queue time).
- Req. Qued is the average length of the wait queue for the real device. This is the average number of I/Os waiting in line to use the volume.
The excerpt above shows device 522A that has a wait queue and has low pending time. This suggests opportunity to tune the volume by using PAV or HyperPAV. Let's look at the two approaches.
DASD Tuning via Classic PAV
For classic PAV, the strategy is to add aliases for the volume until the volume's I/O rate maximizes or the volume's wait queue disappears, whichever comes first. Ordinarily, we would expect these to happen simultaneously.
First, let's use Performance Toolkit's DEVICE report to estimate how many aliases the volume will need. The Req. Qued column gives us the number we seek. For a given volume, the estimate for aliases needed is just the queue depth, smoothing any fractional part up to the next integer.
In the excerpt above, device 522A is reporting a queue depth of 1.84. This suggests two aliases will be needed to tune the volume. Keep this in mind as we work through the tuning exercise.
Starting small, we first added one alias to the workload. Here is the corresponding DEVICE excerpt, showing how the performance of the 522A volume changed, now that one alias is helping.
FCX108  Run 2007/06/05 14:03:05         DEVICE
                                        General I/O Device Load and Performance
From 2007/05/27 14:48:26
To   2007/05/27 14:58:26
For    600 Secs 00:10:00                Result of Y040181P Run
________________________________________________________________________________

 .    .                     .      ___     .    .    .    .    .    .    .    .
 <-- Device Descr. -->  Mdisk Pa- <-Rate/s-> <------- Time (msec) -------> Req.
 Addr Type   Label/ID   Links ths  I/O Avoid Pend Disc Conn Serv Resp CUWt Qued
 522A 3390-3 BWPVS0         0   4  477    .0   .2   .3  1.4  1.9  2.8   .0  .91
 5249 ->522A BWPVS0         0   4  465    .0   .2   .3  1.5  2.0  2.9   .0  .00
Notice several things about this example:
- In this situation, there is one base device, 522A, and there is one classic PAV alias device for it, as notated in the second column by ->522A.
- The 522A volume, although it now has one alias, is still experiencing queueing. We could have forecast this, given our estimate that two aliases would be needed.
- The alias device does not have a wait queue. When CP owns the base and alias devices, volume queueing happens only on the volume's base device, not on its alias devices. Guest minidisk I/O never queues on an alias device.
- Volume I/O rate has increased from 755/sec to (477+465) = 942/sec.
- The service time has increased from 1.3 msec to about 1.9 msec. However, because wait time is reduced, response time improved from 3.7 msec to about 2.8 msec.
Adding this one alias increased volume I/O rate and decreased volume response time. We made progress.
Because there's still a wait queue at base device 522A, and because we'd estimated that two aliases would be needed to tune the volume, let's keep going. Let's see what happens if we add another classic PAV alias for volume 522A.
FCX108  Run 2007/06/05 14:27:46         DEVICE
                                        General I/O Device Load and Performance
From 2007/05/27 14:36:37
To   2007/05/27 14:46:37
For    600 Secs 00:10:00                Result of Y040182P Run
________________________________________________________________________________

 .    .                     .      ___     .    .    .    .    .    .    .    .
 <-- Device Descr. -->  Mdisk Pa- <-Rate/s-> <------- Time (msec) -------> Req.
 Addr Type   Label/ID   Links ths  I/O Avoid Pend Disc Conn Serv Resp CUWt Qued
 522A 3390-3 BWPVS0         0   4  552    .0   .3   .2  1.2  1.7  1.7   .0  .02
 5249 ->522A BWPVS0         0   4  545    .0   .3   .2  1.2  1.7  1.7   .0  .00
 524C ->522A BWPVS0         0   4  522    .0   .3   .2  1.3  1.8  1.8   .0  .00
By adding another PAV alias, we increased the volume I/O rate to (552+545+522) = 1619/sec. Note we also decreased response time to about 1.7 msec. Because the 522A wait queue is now gone, adding more aliases will not further improve volume performance.
The overall result was that we tuned 522A from 742/sec and 3.7 msec response time to 1619/sec and 1.7 msec response time.
DASD Tuning via HyperPAV
With HyperPAV, base devices and alias devices are organized into pools. Each alias in the pool can perform I/O on behalf of any base device in its same pool.
To reduce queueing at a base device, we add an alias to the pool in which the base resides. However, we must remember that said alias will be used to parallelize I/O for all bases in the pool. It follows that with HyperPAV, there really isn't any notion of "volume tuning" per se. Rather, we tune the pool.
Usually, some base devices in a pool will be experiencing little queueing while others will be experiencing more. The design of HyperPAV makes it possible to add just enough aliases to satisfy the I/O concurrency level for the pool. Usually this will result in needing fewer aliases, as compared to having to equip each base with its own aliases.
For example, in a pool having ten base devices, it might be possible to satisfy the I/O concurrency requirements for all ten bases by adding merely five aliases to the pool. This lets us conserve device numbers. IBM is aware that in large environments, conservation of device numbers is an important requirement.
Let's look at a DEVICE report excerpt for a measurement involving our DASD volumes 522A-5231.
FCX108  Run 2007/06/05 11:01:14         DEVICE
                                        General I/O Device Load and Performance
From 2007/02/04 13:28:34
To   2007/02/04 13:38:35
For    600 Secs 00:10:00                Result of Y032180H Run
_______________________________________________________________________________

 .    .                     .      ___     .    .    .    .    .    .    .    .
 <-- Device Descr. -->  Mdisk Pa- <-Rate/s-> <------- Time (msec) -------> Req.
 Addr Type   Label/ID   Links ths  I/O Avoid Pend Disc Conn Serv Resp CUWt Qued
 522A 3390   BWPVS0         0   4  711    .0   .2   .2   .9  1.3  3.9   .0  1.8
 522B 3390   BWPVS1         0   4  745    .0   .2   .2   .9  1.3  3.8   .0  1.8
 522C 3390   BWPVS2         0   4  744    .0   .2   .2   .9  1.3  3.8   .0  1.8
 522D 3390   BWPVS3         0   4  745    .0   .2   .2   .9  1.3  3.8   .0  1.8
 522E 3390   BWPVT0         0   4  769    .0   .2   .2   .8  1.2  3.6   .0  1.8
 522F 3390   BWPVT1         0   4  740    .0   .2   .2   .9  1.3  3.7   .0  1.8
 5230 3390   BWPVT2         0   4  716    .0   .2   .2   .9  1.3  3.9   .0  1.8
 5231 3390   BWPVT3         0   4  719    .0   .2   .2   .9  1.3  3.9   .0  1.8
In this workload we see that each of the eight volumes is experiencing queueing, with pending time not being an issue. Again, volume tuning looks promising.
Notice also that each volume is experiencing an I/O rate of about 735/sec and a response time of about 3.8 msec. When we are done tuning this pool, we will take another look at these, to see what happened.
Because we are going to use HyperPAV this time, we will not be tuning these volumes individually. Rather, we will be tuning them as a group. Noticing that the total queue depth for the group is (1.8*8) = 14.4, we can estimate that 15 HyperPAV aliases should suffice to tune the pool. Let's start by adding eight HyperPAV aliases 5249-5250 and see what happens.
FCX108  Run 2007/06/05 14:33:16         DEVICE
                                        General I/O Device Load and Performance
From 2007/02/04 13:16:46
To   2007/02/04 13:26:47
For    600 Secs 00:10:00                Result of Y032181H Run
_______________________________________________________________________________

 .    .                     .      ___     .    .    .    .    .    .    .    .
 <-- Device Descr. -->  Mdisk Pa- <-Rate/s-> <------- Time (msec) -------> Req.
 Addr Type   Label/ID   Links ths  I/O Avoid Pend Disc Conn Serv Resp CUWt Qued
 522A 3390-3 BWPVS0         0   4  665    .0   .2   .2  1.0  1.4  2.8   .0  .90
 522B 3390-3 BWPVS1         0   4  651    .0   .2   .2  1.0  1.4  2.9   .0  .98
 522C 3390-3 BWPVS2         0   4  658    .0   .2   .2  1.0  1.4  2.8   .0  .90
 522D 3390-3 BWPVS3         0   4  644    .0   .2   .2  1.0  1.4  2.8   .0  .90
 522E 3390-3 BWPVT0         0   4  597    .0   .2   .2  1.1  1.5  3.1   .0  .93
 522F 3390-3 BWPVT1         0   4  721    .0   .2   .1   .9  1.2  2.4   .0  .89
 5230 3390-3 BWPVT2         0   4  606    .0   .2   .2  1.1  1.5  3.1   .0  .95
 5231 3390-3 BWPVT3         0   4  649    .0   .2   .2  1.0  1.4  2.8   .0  .94
 5249 3390-3                0   4  608    .0   .2   .2  1.1  1.5  1.5   .0  .00
 524A 3390-3                0   4  621    .0   .2   .2  1.0  1.4  1.4   .0  .00
 524B 3390-3                0   4  611    .0   .2   .2  1.0  1.4  1.4   .0  .00
 524C 3390-3                0   4  601    .0   .2   .2  1.1  1.5  1.5   .0  .00
 524D 3390-3                0   4  578    .0   .2   .2  1.1  1.5  1.5   .0  .00
 524E 3390-3                0   4  615    .0   .2   .2  1.1  1.5  1.5   .0  .00
 524F 3390-3                0   4  562    .0   .2   .2  1.2  1.6  1.6   .0  .00
 5250 3390-3                0   4  592    .0   .2   .2  1.1  1.5  1.5   .0  .00
There are lots of interesting things in this report, such as:
- Base devices 522A-5231 are still experiencing queueing. So some benefit could likely be had by adding more HyperPAV aliases to the pool. We predicted this.
- Alias devices are not showing "->" notation to indicate base affiliation. That's because the base with which a HyperPAV alias is affiliated changes for every I/O the alias does.
- Alias devices 5249-5250 are not showing volume labels. Again, affiliation changes with every I/O, so an alias has no long-lived volume label.
- Alias devices 5249-5250 are not showing device queues. This is correct. Again, I/O queues form only on base devices.
One note about I/O rates needs mention. When we tuned via classic PAV, it was easy to calculate the aggregate I/O rate for a volume. All we did was add up the rates for the volume's base and alias devices. By doing this summing, we could see the volume I/O rates rise as we added aliases. With HyperPAV, though, an alias does I/Os for all of the bases in the pool. Thus there is no way from the DEVICE report to calculate the aggregate I/O rate for a specific volume. There is relief in the raw monitor data, though. More on this later.
Bear in mind also that z/VM Performance Toolkit does not calculate response times correctly in PAV or HyperPAV situations, so we can't really see how well we're doing at this interim step. Again, there is relief in the raw monitor data. More on this later, too.
To continue to tune this pool, we can add some more HyperPAV aliases. Again summing the queue depths for the pool's base devices yields a sum of 7.39 I/Os still queued for these bases. Let's add eight more HyperPAV aliases for this pool at device numbers 5251-5258 and see what happens. Again, for convenience we have sorted the report by device number.
FCX108  Run 2007/06/05 14:39:47         DEVICE
                                        General I/O Device Load and Performance
From 2007/02/04 13:04:57
To   2007/02/04 13:14:57
For    600 Secs 00:10:00                Result of Y032182H Run
________________________________________________________________________________

 .    .                     .      ___     .    .    .    .    .    .    .    .
 <-- Device Descr. -->  Mdisk Pa- <-Rate/s-> <------- Time (msec) -------> Req.
 Addr Type   Label/ID   Links ths  I/O Avoid Pend Disc Conn Serv Resp CUWt Qued
 522A 3390-3 BWPVS0         0   4  536    .0   .3   .2  1.2  1.7  1.8   .0  .03
 522B 3390-3 BWPVS1         0   4  553    .0   .3   .2  1.2  1.7  1.7   .0  .00
 522C 3390-3 BWPVS2         0   4  576    .0   .3   .2  1.1  1.6  1.6   .0  .00
 522D 3390-3 BWPVS3         0   4  570    .0   .3   .2  1.1  1.6  1.6   .0  .01
 522E 3390-3 BWPVT0         0   4  548    .0   .3   .2  1.2  1.7  1.7   .0  .00
 522F 3390-3 BWPVT1         0   4  573    .0   .3   .2  1.1  1.6  1.6   .0  .01
 5230 3390-3 BWPVT2         0   4  584    .0   .3   .2  1.1  1.6  1.6   .0  .00
 5231 3390-3 BWPVT3         0   4  572    .0   .3   .2  1.1  1.6  1.6   .0  .00
 5249 3390-3                0   4  558    .0   .3   .2  1.2  1.7  1.7   .0  .00
 524A 3390-3                0   4  569    .0   .3   .2  1.1  1.6  1.6   .0  .00
 524B 3390-3                0   4  562    .0   .3   .2  1.1  1.6  1.6   .0  .00
 524C 3390-3                0   4  566    .0   .3   .2  1.1  1.6  1.6   .0  .00
 524D 3390-3                0   4  564    .0   .3   .2  1.1  1.6  1.6   .0  .00
 524E 3390-3                0   4  538    .0   .3   .2  1.2  1.7  1.7   .0  .00
 524F 3390-3                0   4  563    .0   .3   .2  1.1  1.6  1.6   .0  .00
 5250 3390-3                0   4  548    .0   .3   .2  1.2  1.7  1.7   .0  .00
 5251 3390-3                0   4  524    .0   .3   .2  1.2  1.7  1.7   .0  .00
 5252 3390-3                0   4  535    .0   .3   .2  1.2  1.7  1.7   .0  .00
 5253 3390-3                0   4  568    .0   .3   .2  1.1  1.6  1.6   .0  .00
 5254 3390-3                0   4  570    .0   .3   .2  1.1  1.6  1.6   .0  .00
 5255 3390-3                0   4  557    .0   .3   .2  1.2  1.7  1.7   .0  .00
 5256 3390-3                0   4  543    .0   .3   .2  1.2  1.7  1.7   .0  .00
 5257 3390-3                0   4  544    .0   .3   .2  1.2  1.7  1.7   .0  .00
 5258 3390-3                0   4  574    .0   .3   .2  1.1  1.6  1.6   .0  .00
We see that by adding the eight HyperPAV aliases, we have eliminated queueing at the eight bases, which was our objective.
Further, now that there is no queueing, we can assess volume response time by inspecting the service times in the DEVICE report. For this example, we can conclude that we reduced volume response time in this pool from about 3.8 msec to about 1.7 msec.
Because this pool is comprised only of bases 522A-5231 and aliases 5249-5268, summing the device I/O rates gives 13395/sec aggregate I/O rate to the pool. We can approximate the volume I/O rate by dividing by 8, because there are eight bases. This gives us a volume I/O rate of about 1674/sec, which is an increase from our original value of 735/sec.
Regarding HyperPAV pools, one other point needs mention. The span of a HyperPAV pool is typically the logical subsystem (LSS) (aka logical control unit, or LCU) within the IBM 2107. IBM anticipates that customers using HyperPAV will have more than one LSS (LCU) configured in HyperPAV mode, and so keeping track of the base-alias relationships can become a bit challenging. Unfortunately, z/VM Performance Toolkit does not report on the base-alias relationships for HyperPAV, so the system administrator must resort to other means. The CP command QUERY PAV yields comprehensive console output that describes the organization of HyperPAV bases and aliases into pools, thereby telling the system administrator what he needs to know to interpret Performance Toolkit reports and subsequently tune the I/O subsystem. Customers interpreting raw monitor data will notice that the MRIODDEV record has new bits IODDEV_RDEVHPBA and IODDEV_RDEVHPAL which tell whether the device is a HyperPAV base or alias respectively. If one of those bits is set, a new field, IODDEV_RDEVHPPL, gives the pool number in which the device resides.
Another Look at HyperPAV Alias Provisioning
New monitor record MRIODHPP (domain 6, record 28) comments on the configuration of a HyperPAV pool.
From a pool tuning perspective, perhaps the most important fields in this record are IODHPP_HPPTRIES and IODHPP_HPPFAILS. The former counts the number of times CP went to the pool to try to get an alias to do an I/O on behalf of a base. The latter counts the number of those tries where CP came up empty, that is, there were no aliases available.
Trend analysis on IODHPP_HPPTRIES and IODHPP_HPPFAILS reveals whether there are enough aliases in the pool. If HPPTRIES is increasing but HPPFAILS is remaining constant, there are enough aliases. If both are rising, there are not enough aliases.
Fields IODHPP_HPPMINCT and IODHPP_HPPMAXCT are low-water and high-water marks on free alias counts. CP updates these fields each time it tries to get an alias from the pool, and it resets them each time it cuts an MRIODHPP record. Thus each MRIODHPP record comments on the minimal and maximal number of free aliases CP found in the pool since the previous MRIODHPP record. If IODHPP_HPPMINCT is consistently large, we can conclude the pool probably has too many aliases. If our I/O configuration is suffering for device numbers, some of those aliases could be removed and the device numbers reassigned for other purposes.
z/VM Performance Toolkit does not yet report on the MRIODHPP record. The customer must use other means, such as the MONVIEW package on our download page, to inspect it.
A Unified Look at Volume I/O Rate and Volume Response Time
In z/VM 5.3, IBM has extended the MRIODDEV record so that it comments on the I/O contributions made by alias devices, no matter which aliases contributed. These additional fields make it simple to calculate volume performance statistics, such as volume I/O rate, volume service time, and volume response time.
Analysts familiar with fields IODDEV_SCGSSCH, IODDEV_SCMCNTIM, IODDEV_SCMFPTIM, and friends already know how to use those fields to calculate device I/O rate, device pending time, device connect time, device service time, and so on. In z/VM 5.3, this set of fields continues to have the same meaning, but it's important to realize that in a PAV or HyperPAV situation, those fields comment on the behavior of only the base device for the volume.
The new MRIODDEV fields IODDEV_PAVSSCH, IODDEV_PAVCNTIM, IODDEV_PAVFPTIM, and friends comment on the aggregate corresponding phenomena for all aliases ever acting for this base, regardless of PAV or HyperPAV, and regardless of alias device number.
What this means is that by looking at MRIODDEV and doing the appropriate arithmetic, a reduction program can calculate volume behavior quite easily, by weighting the base and aggregate-alias contributions according to their respective I/O rates.
For example, if the traditional MRIODDEV base device fields show an I/O rate of 400/sec and a connect time of 1.2 msec, and the same calculational technique applied to the new aggregate-alias fields reveals an I/O rate of 700/sec and a connect time of 1.4 msec, the expected value of the volume's connect time is calculated to be (400*1.2 + 700*1.4) / (400 + 700), or 1.33 msec.
Authors of reduction programs can update their software so as to calculate and report on volume behavior.
z/VM Performance Toolkit does not yet report on the new MRIODDEV fields. The customer must use other means, such as the MONVIEW package on our download page, to examine them.
I/O Parallelism: Other Thoughts
In this section we have discussed that for the case of guest I/O to minidisks, z/VM CP can exploit PAV or HyperPAV so as to parallelize the corresponding real I/O, thereby reducing or eliminating CP's serializing on real volumes. This support is useful in removing I/O queueing in the case where several guests require access to the same real volume, each such guest manipulating only its own slice (minidisk) of the volume.
Depending on the environment or configuration, other opportunities exist in a z/VM system for disk I/O to become serialized inadvertently, and other remedies exist too.
For example, even though z/VM can itself use PAV or HyperPAV to run several guest minidisk I/Os concurrently to a single real volume, each such guest still can do only one I/O at a time to any given minidisk. Depending on the workload inside the guest, the guest itself might be maintaining its own I/O queue for the minidisk. z/VM Performance Toolkit would not ordinarily report on such a queue, nor would z/VM's PAV or HyperPAV support be useful in removing it.
A holistic approach to removing I/O queueing requires an end-to-end analysis of I/O performance and the application of appropriate relief measures at each step. Returning to the earlier example, if guest I/O queueing is the real concern, and if the guest is PAV-aware, it might make sense to move the guest's data to a dedicated volume, and then attach the volume's base and alias device numbers to the guest. Such an approach would give the guest an opportunity to use PAV or HyperPAV to do its own I/O scheduling and thereby mitigate its queueing problem.
If the guest is PAV-aware, another tool for removing a guest I/O queue is to have z/VM create some virtual PAV aliases for the guest's minidisk. z/VM can virtualize either classic PAV aliases or HyperPAV aliases for the minidisk. This approach lets the guest's data continue to reside on a minidisk but also lets the guest itself achieve I/O concurrency for the minidisk.
Depending on software levels, guests running Linux for System z can use PAV to parallelize I/O to volumes containing Linux file systems, so as to achieve file system I/O concurrency. Again, whether this is useful or appropriate depends on the results of a comprehensive study of the I/O habits of the guest.
As always, customers must study performance data and apply tuning techniques appropriate to the bottlenecks discovered.
Back to Table of Contents.
Virtual Switch Link Aggregation
Abstract
Link aggregation is designed to allow you to combine multiple physical OSA-Express2 ports into a single logical link for increased bandwidth and for nondisruptive failover in the event that a port becomes unavailable. Having the ability to add additional cards can result in increased throughput, particularly when the OSA card is being fully utilized. Measurement results show an increase in throughput from 6% to 15% for a low-utilization OSA card to an increase in throughput from 84% to 100% for a high-utilization OSA card, as well as reductions in CPU time ranging from 0% to 22%.
Introduction
The Virtual Switch (VSwitch) is a guest LAN technology that bridges real hardware and virtual networking LANs, offering external LAN connectivity to the guest LAN environment. The VSwitch operates with virtual QDIO adapters (OSA-Express), and external LAN connectivity is available only through OSA-Express adapters in QDIO mode. Like the OSA-Express adapter, the VSwitch supports the transport of either IP packets or Ethernet frames. You can find out more detail about VSwitches in the z/VM Connectivity book.
In 5.3.0 the VSwitch, configured for Ethernet frames (layer 2 mode), now supports aggregating of 1 to 8 OSA-Express2 adapters with a switch that supports the IEEE 802.3ad Link Aggregation specification.
Link aggregation support is exclusive to the IBM z9 EC GA3 and z9 BC GA2 servers and is applicable to the OSA-Express2 features when configured as CHPID type OSD (QDIO). This support makes it possible to dynamically add or remove OSA ports for "on-demand" bandwidth, transparent recovery of a failed link within the aggregated group, and the ability to "remove" an OSA card temporarily for upgrades without bringing down the virtual network.
One of the key items in link aggregation support is the load balancing done on the VSwitch. All active OSA-Express2 ports within a VSwitch port group are used in the transmission of data between z/VM's VSwitch and the connected physical switch. The VSwitch logic will attempt to distribute the load equally across all the ports within the group. The actual load balancing achieved will depend on the frame rate of the different conversations taking place across the OSA-Express2 ports and the load balance interval specified by the SET PORT GROUP INTERVAL command. It is also important to know that the VSwitch cannot control what devices are used for the inbound data -- the physical switch controls that. The VSwitch can only affect which devices are used for the outbound data. For further details about load balancing refer to the z/VM Connectivity book.
Method
The measurements were done on a 2094-733 with 4 dedicated processors in each of two LPARs.
A 6509 Cisco switch was used for the measurements in this report. It was configured with standard layer 2 ports for the base measurements and the following commands were issued in order to configure the group/LACP ports for the group measurements.
- configure terminal
- interface range gigabitEthernet 2/23 -24
- no ip address
- channel-protocol lacp
- channel-group 1 mode active
- exit
- interface port-channel 1
- switchport trunk encapsulation dot1q
- switchport mode trunk
- no shutdown
- end
The Application Workload Modeler (AWM) was used to drive the workload for VSwitch. (Refer to AWM Workload for more information.) A complete set of runs was done for RR and STR workloads for each of the following: base 5.3.0 with 1 Linux guest client/server pair, base 5.3.0 with 2 Linux guest client/server pairs, 5.3.0 link aggregation (hereafter referred to as group) with 1 Linux guest cleint/server pair, and 5.3.0 group with 2 Linux guest client/server pairs. In addition, these workloads were run using 1 OSA card and again using 2 OSA cards. The following figures show the specific environment(s) for the measurements referred to in this section.
Figure 1. Base:VSwitch-One OSA-Environment
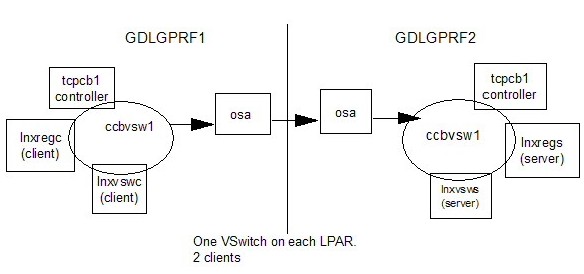
|
The base 5.3.0 VSwitch - one OSA environment in Figure 1 has 2 client Linux guests on the GDLGPRF1 LPAR that connect to the corresponding server Linux guests on the GDLGPRF2 LPAR through 1 OSA. Linux client lnxregc connects to Linux server lnxregs and Linux client lnxvswc connects to Linux server lnxvsws.
Figure 2. Group VSwitch-Two OSAs-Environment
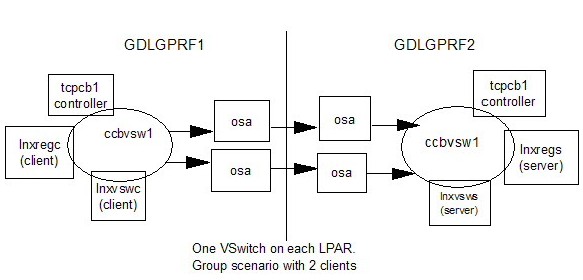
|
After running base measurements, the VSwitches on each side were defined in a group (defined with SET PORT GROUP) with 2 OSA cards. Figure 2 illustrates the group scenario environment where the two client Linux guests connect to their corresponding server Linux guests using VSwitches that now have two OSAs each.
The following factors were found to have an influence on the throughput and overall performance of the group measurements:
- LACP on
- For the measurements done for this report, this was found to have a beneficial impact on results. If you decide to turn LACP on, it needs to be specified on the VSwitch definition and on the physical switch.
- load balancing interval
- This is a parameter on the SET PORT GROUP command. For the measurements shown in this report, the interval was set to 30. This value should be based on your workload. Refer to the z/VM Connectivity book for further details.
- load balancing on the physical switch
- dst-mac was found to give the best performance by the physical switch for these measurements.
- a unique mac prefix and unique mac suffix
- A unique mac prefix should be defined in the system config file (rather than letting VSwitch assign a number) and a unique mac suffix for each user should be defined in the system directory. The mac address influences a distribution algorithm based on the last three bits so try not to give sequential numbers.
- limit queuestorage to 1M
- For queuestorage, smaller is better. One of the side effects of using SYSTEMMP are the cache misses on buffers. Therefore, the bigger the number for queuestorage, the more likely it is to see lower performance due to the cache misses. The default (as documented in the DEFINE VSWITCH command) is 8M. For these measurements, 1M was the used.
Results and Discussion
Measurements and results shown below were done to compare 5.3.0 VSwitch non-group with 5.3.0 VSwitch group. These measurements were done using 2 client Linux guests in one LPAR with 2 corresponding server Linux guests in the other LPAR. For both non-group and group, individual measurements were taken simulating 1, 10 and 50 client/server connections between the client and servers across LPARs. The detailed measurements can be found at the end of this section.
The following charts show how adding an OSA card to a VSwitch can improve bandwidth. The measurements shown are for the case of 2 client and server guests, 10 client/server connections, and MTU 1492.
Figure 3. Performance Benefit of Multiple OSA Cards
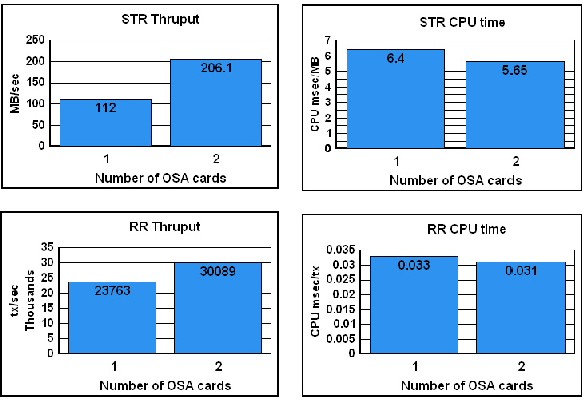 |
This improvement may not be seen in all cases. It will depend on the workload (how much data, how many different targets, whether any other bottlenecks are present such as CPU, etc.) However, it does show the possibilities. In the case shown for STR, the OSA card was fully loaded. In fact, there was enough traffic trying to go across one card that the second card was also fully loaded when it was added. (Note: The OSA/SF product can be used to determine whether the OSA card is running at capacity.) For the detailed measurements see Table 1.
The RR measurements (see Table 2) also show improvement when the second card is added. Since, in this case, there were two target macs (the two servers), traffic flowed over both cards, resulting in a 27% increase in throughput when simulating 10 client/server connections.
Additional measurements, not shown here, were done to see what effect there would be if an additional Linux client/server pair were added. For the RR workload, which does not send a lot of data, the results were as expected. In the case of the STR workload, the measurements produced similar results as seen with the 2 Linux client/server pair case with the simulated 1 and 10 client-server connections. However, the STR workload results with the three Linux client/server pairs become unpredicatable when using the simulated 50 client-server connections. This phenomenon is not well understood and is being investigated.
Monitor Changes
A number of new monitor records were added in 5.3.0 which show guest LAN activity. These are especially useful for determining which guests are sending and receiving data. The Performance Toolkit was also changed to show these new records. The records, along with the existing VSwitch record (Domain 6 Record 21) are very useful for seeing whether the network activity is balanced, who is actively involved in sending and receiving, and the OSA millicode level.
The following is an example of the Performance Toolkit VSWITCH screen (FCX240):
STR, both OSAs fully loaded
 FCX240      Data for 2007/04/13  Interval 15:34:10 - 15:34:40    Monitor
 ____ .         .              .       .      .      .      .      .      .
                          Q Time  <--- Outbound/s ---> <--- Inbound/s ---->
                          S  Out   Bytes <--Packets-->  Bytes <--Packets-->
 Addr     Name  Controlr  V  Sec  T_Byte T_Pack T_Disc R_Byte R_Pack R_Disc
 >>      System       <<  1  300  677431  10262      0   123M  81588      0
 28BA CCBVSW1   TCPCB1    1  300  677585  10265      0   123M  81595      0
 2902 CCBVSW1   TCPCB1    1  300  677276  10260      0   123M  81581      0
Note: In this, and the following examples, the rightmost columns have been truncated.
Here is the Performance Toolkit VNIC screen (FCX269) for the same measurement.
FCX269      Data for 2007/04/13  Interval 13:20:11 - 13:20:41
____ .                 .        .    .                   .      .      .      .
                                                    <--- Outbound/s ---> <--- Inbound
     <---  LAN ID  --> Adapter  Base Vswitch  V      Bytes <  Packets  >  Bytes <  Pa
Addr Owner    Name     Owner    Addr Grpname  S L T T_Byte T_Pack T_Disc R_Byte R_Pac
<<  -----------------   System   --------------  >> 169398   2566     .0 30745k  2040
0500 SYSTEM   CCBFTP   TCPCB1   0500 ........   3 Q     .0     .0     .0     .0     .
B000 SYSTEM   LNXSRV   TCPIP    B000 ........   3 Q     .0     .0     .0     .0     .
F000 SYSTEM   LCSNET   TCPIP    F000 ........   3 H     .0     .0     .0     .0     .
F000 SYSTEM   CCBVSW1  LNXVSWC  F000 CCBGROUP X 2 Q 677405  10262     .0   123M  8159
F000 SYSTEM   CCBVSW1  LNXREGC  F000 CCBGROUP X 2 Q 677782  10268     .0   123M  8160
F004 SYSTEM   CCBFTP   LNXVSWC  F004 ........   3 Q     .0     .0     .0     .0     .
F004 SYSTEM   CCBFTP   LNXREGC  F004 ........   3 Q     .0     .0     .0     .0     .
F010 SYSTEM   LOCALNET TCPIP    F010 ........   3 H     .0     .0     .0     .0     .
F010 SYSTEM   LOCALNET TCPIP    F010 ........   3 H     .0     .0     .0     .0     .
Here is an example of the Performance Toolkit VSWITCH screen (FCX240) showing network activity.
STR, one OSA loaded the other is not
FCX240      Data for 2007/04/13  Interval 15:42:22 - 15:42:52    Monitor
____ .         .              .       .      .      .      .      .      .
                         Q Time  <--- Outbound/s ---> <--- Inbound/s ---->
                         S  Out   Bytes <--Packets-->  Bytes <--Packets-->
Addr     Name  Controlr  V  Sec  T_Byte T_Pack T_Disc R_Byte R_Pack R_Disc
>>      System       <<  1  300  698991  10589      0   100M  66628      0
28BA CCBVSW1   TCPCB1    1  300       5      0      0   123M  81951      0
2902 CCBVSW1   TCPCB1    1  300   1398k  21179      0 77124k  51305      0
At first glance, it would seem that the load is not balanced. However, as noted earlier in this section, the VSwitch connot control which devices are used for the inbound data. This is handled by the physical switch. In the example above, the load is actually balanced. Since the bulk of the inbound data is handled by device 28BA, the VSwitch has directed the outbound data to the 2902 device.
Detailed Results
The following tables show more detail for the MTU 1492, 10 simulated client/server connection runs discussed above. In addition, they show STR results for MTU 8992, and both the STR and RR results for the 1 and 50 simulated client/server connection (labeled 'Number of Threads') cases.
| MTU 1492 | |||
| Number of threads | 01 | 10 | 50 |
| 5.3.0 (non-group, 1 OSA) | |||
| runid | lvsn0102 | lvsn1002 | lvsn5002 |
| MB/sec | 82.4 | 112.0 | 111.9 |
| Total CPU msec/MB | 5.54 | 6.40 | 7.15 |
| Emul CPU msec/MB | 2.77 | 3.36 | 3.90 |
| CP CPU msec/MB | 2.77 | 3.04 | 3.25 |
| Approx. OSA card utilization | 70% | 95% | 95% |
| 5.3.0 (group, 2 OSAs) | |||
| runid | lvsn0102 | lvsn1002 | lvsn5002 |
| MB/sec | 94.7 | 206.1 | 216.9 |
| Total CPU msec/MB | 5.41 | 5.65 | 5.57 |
| Emul CPU msec/MB | 2.62 | 3.03 | 3.01 |
| CP CPU msec/MB | 2.79 | 2.62 | 2.56 |
| Approx. OSA card utilization | 40% | 85% | 90% |
| % diff | |||
| MB/sec | 15% | 84% | 94% |
| Total CPU msec/MB | -2% | -12% | -22% |
| Emul CPU msec/MB | -5% | -10% | -23% |
| CP CPU msec/MB | 1% | -14% | -21% |
| MTU 8992 | |||
| Number of threads | 01 | 10 | 50 |
| 5.3.0 (nongroup) | |||
| runid | lvsj0102 | lvsj1002 | lvsj5002 |
| MB/sec | 70.7 | 118 | 117.8 |
| Total CPU msec/MB | 3.80 | 3.66 | 3.91 |
| Emul CPU msec/MB | 1.70 | 1.73 | 1.94 |
| CP CPU msec/MB | 2.10 | 1.93 | 1.97 |
| Approx. OSA card utilization | 60% | 100% | 100% |
| 5.3.0 (group) | |||
| runid | lvsj0102 | lvsj1002 | lvsj5002 |
| MB/sec | 74.6 | 235.9 | 235.6 |
| Total CPU msec/MB | 3.38 | 3.22 | 3.38 |
| Emul CPU msec/MB | 1.45 | 1.54 | 1.66 |
| CP CPU msec/MB | 1.93 | 1.68 | 1.72 |
| Approx. OSA card utilization | 30% | 100% | 100% |
| % diff | |||
| MB/sec | 6% | 100% | 100% |
| Total CPU msec/MB | -11% | -12% | -14% |
| Emul CPU msec/MB | -15% | -11% | -14% |
| CP CPU msec/MB | -8% | -13% | -13% |
| 2094-733; z/VM 5.3.0; Linux 2.6.14-16 | |||
| MTU 1492 | |||
| Number of threads | 01 | 10 | 50 |
| 5.3.0 (non-group, 1 OSA) | |||
| runid | lvrn0102 | lvrn1002 | lvrn5002 |
| Tx/sec | 4488.5 | 23763.0 | 42049.8 |
| Total CPU msec/Tx | .048 | .033 | .025 |
| Emul CPU msec/Tx | .025 | .020 | .016 |
| CP CPU msec/Tx | .023 | .013 | .009 |
| 5.3.0 (group, 2 OSAs) | |||
| runid | lvrn0102 | lvrn1002 | lvrn5002 |
| Tx/sec | 4709.5 | 30089.0 | 65916.0 |
| Total CPU msec/Tx | .048 | .031 | .025 |
| Emul CPU msec/Tx | .022 | .018 | .016 |
| CP CPU msec/Tx | .026 | .013 | .009 |
| % diff | |||
| Tx/sec | 5% | 27% | 57% |
| Total CPU msec/Tx | 0% | -6% | 0% |
| Emul CPU msec/Tx | -12% | -10% | 0% |
| CP CPU msec/Tx | 13% | 0% | 0% |
| 2094-733; z/VM 5.3.0; Linux 2.6.14-16 | |||
Back to Table of Contents.
z/VM Version 5 Release 2.0
The following sections discuss the performance characteristics of z/VM 5.2.0, the results of the z/VM 5.2.0 performance evaluation, and the results from additional performance evaluations that were conducted during the z/VM 5.2.0 time frame.
Back to Table of Contents.
Summary of Key Findings
This section summarizes z/VM 5.2.0 performance with links that take you to more detailed information.
z/VM 5.2.0 includes a number of performance-related changes -- performance improvements, performance considerations, and changes that affect VM performance management. The Enhanced Large Real Storage Exploitation support affects all three of these in significant ways. CP was changed so that even though most of its code continues to run with 31-bit addressing, it is now able to work with guest pages without first having to move them to frames that are below the 2 GB real storage line. Furthermore, the CP code and most of its data structures can now reside in real storage above the 2G line. As a result, workloads that show a 2G-line constraint on prior releases should no longer have this constraint on z/VM 5.2.0. Furthermore, measurement results demonstrate that z/VM can now fully utilize real storage sizes up to the supported maximum of 128 GB.
The extensive CP changes required for this storage constraint relief necessitated some unavoidable increases in CPU usage. Our regression results reflect this. The workloads experienced increases in total CPU time per transaction ranging from 2% to 11% with the 3G high-paging workload at the top of this range. Specialized workloads that target a narrow range of CP services can show differences outside this range, including a net performance improvement when the CP services being used have benefitted from one or more of the z/VM 5.2.0 performance improvements.
z/VM 5.2.0 includes support for QDIO Enhanced Buffer State Management (QEBSM), a hardware assist that moves the processing associated with typical QDIO data transfers from CP to the processor millicode. Measurement results show reductions in total CPU usage ranging from 13% to 36%, resulting in throughput improvements ranging from 0% to 50% for the measured QDIO, HiperSockets, and FCP workloads.
With APAR VM63855, z/VM 5.2.0 now supports the use of Parallel Access Volumes (PAV) for user minidisks. Measurement results show that the use of PAV can greatly improve the performance of DASD volumes that experience frequent I/O requests from multiple users.
The performance report updates for z/VM 5.2.0 also include four performance evaluations that can be helpful when making system configuration decisions. Linux Disk I/O Alternatives shows relative performance for a wide range of methods that a Linux guest can choose to do disk I/O. Dedicated OSA vs Virtual Switch Comparison, compares two methods of providing network connectivity to Linux guests. Layer3 and Layer2 Comparisons, compares the Layer3 and Layer2 OSA-Express2 transport modes for the following cases: 1) z/VM virtual switch, 2) Linux directly attached to an OSA-Express2 Gigabit Ethernet card (1 Gb and 10 Gb). Finally, Guest Cryptographic Enhancements, discusses the performance of the additional cryptographic support provided in z/VM 5.2.0, including support for the Cryptographic Express 2 coprocessor (CEX2C) and the Cryptographic Express2 Accelerator coprocessor (CEX2A).
Back to Table of Contents.
Changes That Affect Performance
This chapter contains descriptions of various changes in z/VM 5.2.0 that affect performance. It is divided into three sections -- Performance Improvements, Performance Considerations, and Performance Management.
Back to Table of Contents.
Performance Improvements
The following items improve performance:
- Enhanced Large Real Storage Exploitation
- QDIO Enhanced Buffer State Management
- Storage Management APARs
- Contiguous Frame Management Improvements
- Extended Diagnose X'44' Fast Path
- Dispatcher Improvements
- Fast Steal from Idling Virtual Machines
- Reduced Page Reorder Processing for High-CPU Virtual Machines
- Improved SCSI Disk Performance
- VM Resource Manager Cooperative Memory Management
- Improved DirMaint Performance
Enhanced Large Real Storage Exploitation
Substantial changes have been made to CP in z/VM 5.2.0 that allow for much improved exploitation of large real storage sizes.
Prior to z/VM 3.1.0, CP did not support real storage sizes larger than 2 GB -- the extent of 31-bit addressability. Starting with the 64-bit build of z/VM 3.1.0 through z/VM 5.1.0, CP was changed to provide a limited form of support for real storage sizes greater than 2G. All CP code and data structures still had to reside below the 2G line and most of the CP code continued to use 31-bit addressing. Guest pages could reside above 2G. They could continue to reside above 2G when referenced by 64-bit-capable CP code using access registers but there are only a few places in CP that do that. Normally, when a guest page that mapped to a real storage frame above 2G had to be referenced by CP (as, for example, during the handling of a guest I/O request), it first had to be moved to a frame below the 2G line before it could be manipulated by the 31-bit CP code. In large systems, this sometimes led to contention for the limited number of frames below 2G, limiting system throughput.
CP runs in its own address space, called the System Execution Space (SXS), which can be up to 2G in size. Prior to z/VM 5.2.0, the SXS was identity-mapped -- that is, all logical addresses were the same as the corresponding real addresses. With z/VM 5.2.0, the SXS is no longer identity-mapped, thus allowing logical pages in the SXS to reside anywhere in real storage. Now, when CP needs to reference a guest page, it maps (aliases) that page to a logical page in the SXS. This allows most of the CP code to continue to run using 31-bit addressability while also eliminating the need to move pages to real frames that are below the 2G line. The CP code and most CP data structures can now reside above 2G. For example, Frame Table Entries (FRMTEs) can now reside above 2G. These can require much space because there is one 32-byte FRMTE for every 4K frame of real storage. The most notable exception is the Page Management Blocks (PGMBKs), which must still reside below 2G. These are discussed further under Performance Considerations.
This change effectively removes the 2G line constraint and, as test measurements have demonstrated, allows for effective utilization of real storage up to the maximum 128 GB currently supported by z/VM.
QDIO Enhanced Buffer State Management
The Queued Direct I/O (QDIO) Enhanced Buffer State Management (QEBSM) facility provides virtual machines running under z/VM an optimized mechanism for transferring data via QDIO (including FCP, which uses QDIO). Prior to this new facility, z/VM had to be an intermediary between the virtual machine and adapter during QDIO data transfers. With QEBSM, z/VM will not have to get involved with a typical QDIO data transfer for operating systems or device drivers that support the facility.
Starting with z/VM 5.2.0 and z990/890 with QEBSM Enablement applied, a program running in a virtual machine has the option of using QEBSM to manage QDIO buffers. By using QEBSM for buffer management, the processor millicode can perform the shadow queue processing typically performed by z/VM for a QDIO connection. This eliminates the z/VM and hardware overhead associated with SIE entry and exit for every QDIO data transfer. The shadow queue processing still requires processor time, but much less than required when done by the software. The net effect is a small increase in virtual CPU time coupled with a much larger decrease in CP CPU time used on behalf of the guest.
Measurement results show reductions in total CPU usage ranging from 13% to 36%, resulting in throughput improvements ranging from 0% to 50% for the measured QDIO, HiperSockets, and FCP workloads.
Storage Management APARs
There are a number of improvements to the performance of CP's storage management functions that have been made available to z/VM 5.1.0 (and, in some cases, z/VM 4.4.0) through the service stream. All of these have been incorporated into z/VM 5.2.0.
VM63636 - This corrects a condition where an excessive number of frames were being stolen for potential future use in satisfying contiguous frame requests.
VM63729 - This applies to storage constrained systems that have more than 2 GB of main storage. Demand scan CPU usage is reduced by bypassing scan of the frames owned by a user when that user does not have any frames of the type required (below 2G or above 2G). This service is also available on z/VM 4.4.0.
VM63730 - This applies to systems that support large amounts of virtual storage. Contiguous frame management is improved, resulting in reduced CPU usage and better scaling.
VM63752 - This applies to storage constrained systems that have more than 2G of main storage and expanded storage available for paging. Performance is improved by making more extensive use of the above-2G main storage when pages must be moved from the below-2G main storage. This service is also available on z/VM 4.4.0.
Contiguous Frame Management Improvements
In addition to VM63636 and VM63730 discussed above, z/VM 5.2.0 includes other improvements that further reduce the time required to search for contiguous real storage frames.
Extended Diagnose X'44' Fast Path
When running in a virtual machine with multiple virtual processors, guest operating systems such as Linux use Diagnose x'44' to notify CP whenever a process within that guest must wait for an MP spin lock. This allows CP to dispatch any other virtual processors for that guest that are ready to run.
Prior VM releases include a Diagnose x'44' fast path for the case of virtual 2-way configurations. When the guest has no other work that is waiting to run on its other virtual processor (either because it is already running or it has nothing to do), the fast path applies and CP does an immediate return to the guest. Normally, most Diagnose x'44s qualify for the fast path. With z/VM 5.2.0, this fast path has been extended so that it applies to any virtual multiprocessor configuration.
The fast path improves guest throughput by reducing the average delay between the time that the guest lock becomes available and the time the delayed guest process resumes execution. It also reduces the load on CP's scheduler lock, which can improve overall system performance in cases where there is high contention for that lock.
See Extended Diagnose X'44' Fast Path for further discussion and measurement results.
Dispatcher Improvements
APAR VM63687, available on z/VM 5.1.0, fixes a dispatcher problem that can result in long delays right after IPL of a multiprocessor z/VM system while a CP background task is completing initialization of central storage above 2 GB. This fix has been integrated into z/VM 5.2.0.
The dispatcher was changed so to reduce the amount of non-master work that gets assigned to the master processor, thus allowing it to handle more master-only work. This can result in improved throughput and processing efficiency for workloads that cause execution in master-only CP modules.
Fast Steal from Idling Virtual Machines
When a virtual machine becomes completely idle (uses no CPU), it quickly gets moved to the dormant list and, if central storage is constrained, its frames are quickly stolen and made available for satisfying other paging requests. A CMS virtual machine is a good example of this case. Most virtual machines that run servers and guest operating systems, however, do not go completely idle when they run out of work. Instead, they typically enter a timer-driven polling loop. From CP's perspective, such a virtual machine is still active and frames are stolen from it just like any other active virtual machine. This is based on the frames' hardware reference bit settings, which are tested and reset each time that virtual machine's frames are examined by CP's reorder background task.
Prior to z/VM 5.2.0, active virtual machines that use little CPU are infrequently reordered. As a result, they tend to keep their frames for a long time even if the system is storage constrained. With z/VM 5.2.0, the reorder task is run more frequently for such virtual machines so that their frames can be stolen more quickly when needed. This is done by basing reorder frequency on how much CPU time is made available to a virtual machine instead of the amount of CPU time it actually consumes. This change can result in a significant reduction in total paging for storage-constrained systems where a significant proportion of real storage is used by guest/server virtual machines that frequently cycle between periods of idling and activity.
Reduced Page Reorder Processing for High-CPU Virtual Machines
The improvement described above also reduces how frequently the frames of high-CPU usage virtual machines are reordered, thus reducing system CPU usage. In prior releases, such virtual machines were being reordered more frequently than necessary.
Improved SCSI Disk Performance
z/VM-owned support for SCSI disks (via FBA emulation) was introduced in z/VM 5.1.0. Since then, improvements have been made that reduce the amount of processing time required by this support. One of these improvements is available on z/VM 5.1.0 as APARs VM63725 and VM63534 (as part of DS8000 support) and is now integrated into z/VM 5.2.0. It can greatly improve the performance of I/Os to minidisks on emulated FBA on SCSI devices for CMS or any other guest application that uses I/O buffers that are not 512-byte aligned. Total CPU time was decreased 10-fold for the Xedit read workload used to evaluate this improvement.
Additional changes to the SCSI code in z/VM 5.2.0 have improved the efficiency of CP paging to SCSI devices. Measurement results show a 14% decrease in CP CPU time per page read/written for an example workload and configuration.
For further information on both of these improvements, see CP Disk I/O Performance.
VM Resource Manager Cooperative Memory Management
VM Resource Manager Cooperative Memory Management (VMRM-CMM) can be used to help manage total system memory constraint in a z/VM system. Based on several variables obtained from the System and Storage domain CP monitor data, VMRM detects when there is such constraint and requests the Linux guests to reduce use of virtual memory. The guests can then take appropriate action to reduce their memory utilization in order to relieve this constraint on the system. When the system constraint goes away, VMRM notifies those guests that more memory can now be used. For more information, see VMRM-CMM. For measurement evaluation results, see Memory Management: VMRM-CMM and CMMA.
Improved DirMaint Performance
Changes to an existing directory statement can, in many cases, be put online very quickly using Diagnose x'84' - Directory-Update-In-Place. However, it is not possible to add a new directory statement or delete an existing directory statement using Diagnose x'84'. In such cases, prior to z/VM 5.2.0, DirMaint had to run the DIRECTXA command against the full source directory to rebuild the entire object directory. For large directories, this can be quite time-consuming.
In z/VM 5.2.0, CP and DirMaint have been updated to allow virtual machine directory entries to be added, deleted, or updated without having to rewrite the entire object directory. Instead, this is done by processing a small subset of the source directory. This can substantially improve DirMaint responsiveness when the directory is large.
Back to Table of Contents.
Performance Considerations
These items warrant consideration since they have potential for a negative impact to performance.
- Increased CPU Usage
- Performance APARs
- Expanded Storage Size
- Large VM Systems
Increased CPU Usage
The constraint relief provided in z/VM 5.2.0 allows for much better use of large real storage. However, the many structural changes in CP resulted in some unavoidable increases in CP CPU usage. The resulting increase in total system CPU usage is in the 2% to 11% range for most workloads but the impact can be higher in unfavorable cases. See CP Regression Measurements for further information.
Performance APARs
There are a number of z/VM 5.2.0 APARs that correct problems with performance or performance management data. Review these to see if any apply to your system environment.
Expanded Storage Size
The 2G-line constraint relief provided by z/VM 5.2.0 can affect what expanded storage size is most suitable for best performance. The "bottom line" z/VM guidelines provided in Configuring Processor Storage continue to apply. Those guidelines suggest that a good starting point is to configure 25% of total storage as expanded storage, up to a maximum of 2 GB. Some current systems have been configured with a higher percentage of expanded storage in order to mitigate a 2G-line constraint. Once such a system has been migrated to z/VM 5.2.0, consider reducing expanded storage back to the guidelines.
Large VM Systems
With z/VM 5.2.0, it becomes practical to configure VM systems that use large amounts of real storage. When that is done, however, we recommend a gradual, staged approach with careful monitoring of system performance to guard against the possibility of the system encountering other limiting factors. Here are some specific considerations:
- Most CP control blocks and data areas can now reside above the 2G
line. The most important exception is the page management blocks
(PGMBKs). Each PGMBK is 8 KB in size and is pageable. When resident,
a PGMBK is backed by two contiguous real storage frames below the 2G
line. There is one resident PGMBK for every in-use one-megabyte
segment of virtual storage, where "in-use" means that it contains at
least one page that is backed by a real storage frame. The fact that
PGMBKs must still reside below 2G sets an absolute maximum of 256 GB to
the amount of in-use virtual storage that z/VM 5.2.0 can support. (The
actual maximum is somewhat less because of other data that still must
reside below 2G.) Most z/VM systems are far below this limit but it is
more likely to become a factor as systems become larger.
Performance Toolkit for VM can be used to check PGMBK usage. Go to the FCX134 screen (Shared Data Spaces Paging Activity - DSPACESH) and look at the data for the PTRM0000 data space. "Resid" is the number of frames being used for PGMBKs and the number of PGMBKs is half that amount. (Note: In z/VM 5.1.0, this count is in error and is, in effect, a count of PGMBKs rather than PGMBK frames.) The "Enhanced Large Real Storage Exploitation" section has a table that includes this data.
- Since the System Execution Space (SXS) is limited to a maximum of 2
GB, it represents another resource that can become constrained. We
don't expect this to become a problem on z/VM 5.2.0. You can use the
QUERY SXSPAGES command to check SXS utilization at any moment in time.
SXS utilization is 100 times "Total SXS Pages in Use" divided by "Total
SXS Pages". Performance Toolkit for VM can be used to see SXS
utilization over time. Go to the new "System Execution Space
Utilization" report (SXSUTIL; FCX264) and use the "Total Pages Used"
and "Total Pages" values. The "Enhanced Large Real Storage
Exploitation" section has a table
that includes this data. SXS storage management is designed to keep
aliases in place until SXS pages are needed for some other purpose.
Consequently, the "Total Pages Used" count tends to overstate the
true requirements.
- On larger systems, it becomes more important to follow the
minidisk cache tuning
recommendations. In particular, randomly accessed large databases
are usually poor candidates for minidisk caching and therefore MDC
should be turned off for the underlying minidisks / real devices.
- The time and space required to process CP dumps can become a
factor on very large z/VM systems.
- If real processors are added, look for MP locking as a potential constraint. See 24-Way Support for discussion and measurement results.
Back to Table of Contents.
Performance Management
These changes affect the performance management of z/VM:
- Monitor Enhancements
- Command Syntax and Output Changes
- Effects on Accounting Data
- VM Performance Products
Monitor Enhancements
There were several changes and areas of enhancements affecting the monitor data for z/VM 5.2.0 involving system configuration information and improvements in data collection. As a result of these changes, there are two records that are no longer generated, seven new monitor records, and several changed records. The detailed monitor record layouts are found on our control blocks page.
In z/VM 5.2.0, the Vector Facility is no longer available so support for the facility has been removed. As a result, the Domain 5 Record 4 (Vary on Vector Facility) and the Domain 5 Record 5 (Vary off Vector Facility) monitor records are no longer generated. In addition, there are fields which were used for monitoring the Vector Facility which are no longer provided in the following records: Domain 0 Record 2 (Processor Data (Per Processor)), Domain 1 Record 4 (System Configuration Data), Domain 1 Record 5 (Processor Configuration), Domain 4 Record 2 (User Logoff Data), Domain 4 Record 3 (User Activity Data), and Domain 4 Record 9 (User Interaction at Transaction End).
Preferred guest support (V=R) was discontinued in z/VM 5.1.0 and all related monitor fields were changed to display zeros. With z/VM 5.2.0, fields used to capture data for this support have been removed from the Domain 0 Record 3 (Real Storage Data (Global)), Domain 1 Record 7 (Memory Configuration), Domain 3 Record 1 (Real Storage Management(Global)), and the Domain 3 Record 2 (Real Storage Activity (Per Processor)) records. Also, the VMDSTYPE value of X'80', representing V=R, is no longer valid. This value was reported in the Domain 1 Record 15 (Logged on User), Domain 4 Record 1 (User Logon), Domain 4 Record 2 (User Logoff Data), Domain 4 Record 3 (User Activity Data), and the Domain 4 Record 9 (User Activity Data at Transaction End) records.
A new record, Domain 3 Record 18 (SCSI Storage Pool Sample), has been added to allow monitoring of storage utilization in a SCSI container storage subpool. In z/VM 5.1.0, support was added to provide native SCSI disk support. This record is a follow-on to the monitor support added in the previous release and provides data for a SCSI storage subpool including the name, size, number of malloc() and free() calls, bytes currently allocated, as well as additional data which can be used to keep track of storage usage for SCSI devices.
Support was added to z/VM 5.2.0 for a Guest LAN sniffer debugging facility. It provides a LAN sniffing infrastructure that will support Linux network debugging tools as well as VM and Linux users who are familiar with the z/VM operating system. The Domain 6 Record 21 (Virtual Switch Activity) record has been updated to include two new fields which indicate the count of the current active trace ids and the count of the current users in Linux sniffer mode.
Two new monitor records, Domain 5 Record 9 (Crypto Performance Counters) and Domain 5 Record 10 (Crypto Performance Measurement Data), have been added to allow monitoring of cryptographic adapter cards. These records include counters and timers for transactions on the cryptographic adapter cards and measurement data for each specific cryptographic adapter card in the system configuration.
Starting with the z890 and z990 processors (with appropriate MCL) and z/VM 5.2.0, a program running in a virtual machine has the option of using the Queued Direct I/O (QDIO) Enhanced Buffer State Management (QEBSM) facility to manage QDIO buffers for real dedicated QDIO-capable devices (OSA Express, FCP, and HiperSockets). The following monitor records have been extended to provide data for the new QEBSM support: Domain 1 Record 19 (indicates configuration of a QDIO device), Domain 6 Record 25 (indicates that a QDIO device has been activated), Domain 6 Record 26 (indicates activity on a QDIO device), and Domain 6 Record 27 (indicates deactivation of a QDIO device).
In z/VM 5.2.0, users can now specify preferred and non-preferred channel paths for emulated SCSI devices on the IBM 1750 (DS6000) storage controller. This information has been added to the Domain 1 Record 6 (Device Configuration Data), Domain 6 Record 1 (Vary on Device), and the Domain 6 Record 3 (Device Activity) records.
The largest change to the monitor records for z/VM 5.2.0 has been in the area of storage management due to the improved support for large real storage. This allows z/VM 5.2.0 to use storage locations above the 2 GB address line for operations that previously required moving pages below the 2 GB line. All monitor records reporting data on storage have been modified. There are several fields which are no longer available and many new fields. There are also some fields which have a somewhat different meaning: Prior to z/VM 5.2.0, these fields reported data on the total amount of storage. In z/VM 5.2.0, these fields now represent data for storage below 2 GB only. In most cases, new fields have been added to report storage data above 2 GB. To assist in understanding the fields involved, the control blocks page lists each monitor record changed along with a list of the fields within the record that have been removed, added, or have a new meaning. The list of changed records include:
| Monitor Record | Record Name |
|---|---|
| Domain 0 Record 3 | Real Storage Data (Global) |
| Domain 0 Record 4 | Real Storage Data (Per Processor) |
| Domain 1 Record 7 | Memory Configuration Data |
| Domain 3 Record 1 | Real Storage Management (Global) |
| Domain 3 Record 2 | Real Storage Management (Per Processor) |
| Domain 3 Record 3 | Shared Storage Management |
| Domain 3 Record 14 | Address Space Information Record |
| Domain 3 Record 16 | NSS/DCSS/SSP Removed from Storage |
| Domain 4 Record 2 | User Logoff Data |
| Domain 4 Record 3 | User Activity Data |
| Domain 4 Record 9 | User Activity Data at Transaction End |
In addition to the changes in the existing storage management areas within monitor, there are four new storage management records that contain data for the new storage concept in z/VM 5.2.0 known as the System Execution Space. Two new high-level System Execution Space monitor records have been added to the System Domain: Domain 0 Record 21 (System Execution Space (Global)) and Domain 0 Record 22 (System Execution Space (Per Processor)). Two System Execution Space monitor records that contain more detailed information have been added to the Storage Domain: Domain 3 Record 19 (System Execution Space (Global)) and Domain 3 Record 20 (System Execution Space (Per Processor)).
Command Syntax and Output Changes
The extensive changes to CP storage management necessitated some changes to the syntax and/or output of a number of CP commands. Performance management tools that use these commands should be reviewed to see if any updates are required.
| Command | Syntax | Output |
| DISPLAY host address | X | X |
| DUMP host address | X | X |
| STORE host address | X | X |
| INDICATE LOAD | X | |
| INDICATE USER | X | |
| INDICATE NSS | X | |
| INDICATE SPACES | X | |
| LOCATE FRAMETBL | X | |
| LOCATE STORAGE | X | |
| LOCATE SYMBOL | X | |
| LOCATE VMDBK | X | |
| LOCK | X | X |
| UNLOCK | X | X |
| QUERY FRAMES | X |
There are three new commands: QUERY SXSPAGES, QUERY SXSSTORAGE, and LOCATE SXSTE. These are in support of the new System Execution Space component.
Effects on Accounting Data
The values reported in the virtual machine resource usage accounting record will be affected for guest virtual machines that use the QEBSM assist for QDIO data transfers. Relative to not using QEBSM, virtual CPU time reported for that guest will tend to be somewhat higher, while CP CPU time can be much lower.
Performance Toolkit for VM
Performance Toolkit for VM has been enhanced to include the following additional data. These are all new reports except for PAGELOG, which has been updated:
- Storage management ..
- PAGELOG - Total Paging Activity (by time). Two data columns (Nonpageable Pages and Resident Shared Pages) were moved to the new STORLOG report, one column (Mean Available List) was moved to the new AVAILLOG report, and two columns (Page Table Mgmt Reads and Writes) were added.
- STORLOG - Storage Utilization Log (by time)
- AVAILLOG - Available List Management (by time)
- New System Execution Space storage management component ..
- SXSAVAIL - SXS Queues Management (by time)
- SXSPAGE - SXS Page Management (by time)
- SXSDEFER - SXS Deferred Tasks Management (by time)
- SXSUTIL - SXS Utilization (by time)
- QEBSM/QDIO ..
- QEBSM - QEBSM device activity (by device)
- QEBSMLOG - QEBSM device activity log (by time)
- UQDIO - User QDIO Activity Information (by user)
- UQDIOLOG - User QDIO Log (by time)
- Other ..
- DEMNDLOG - Demand Scan Details (by time)
Currently, Performance Toolkit for VM does not accurately calculate I/O response time when CP is using parallel access volumes (PAV) for user minidisks. See Performance Toolkit for VM and PAV for details. The reported I/O service times are correct. Bear in mind, however, that they are for each listed device number and not for the DASD volume as a whole.
For general information about Performance Toolkit for VM and considerations for migrating from VMPRF and RTM, refer to the Performance Toolkit for VM page.
Back to Table of Contents.
Migration from z/VM 5.1.0
This section discusses the performance changes that occur when existing workloads that run without a 2 GB constraint on z/VM 5.1.0 are migrated to z/VM 5.2.0.
The Enhanced Large Real Storage Exploitation section covers cases where 2G-constrained workloads are migrated from z/VM 5.1.0 to z/VM 5.2.0.
Back to Table of Contents.
CP Regression Measurements
This section summarizes z/VM 5.1.0 to z/VM 5.2.0 performance comparison results for workloads that do not have a 2G storage constraint in z/VM 5.1.0. Results for workloads that are constrained in z/VM 5.1.0 are presented in the Enhanced Large Real Storage Exploitation section.
Factors that most affect the performance results include:
- The CP virtual address space no longer has a direct identity mapping to real storage
- The CP control block that maps real storage (frame table) was moved above 2G
- Some additional CP modules were changed to 64-bit addressing
- Some CP modules (including those involved in Linux virtual I/Os) were changed to use access registers to reference guest pages that reside above 2G
What workloads have a below-2G constraint?
The effects of these changes are very dependent on the workload characteristics. Workloads currently constrained for page frames below the 2G line should benefit in proportion to the amount of constraint.
Systems with 2G or less of real storage receive no benefit from these enhancements and may experience some reduction in performance from this support.
Systems with 2G to 4G of real storage need careful evaluation to decide if they will receive a performance benefit or a performance decrease. These environments can have more available storage below 2G than above 2G, which can lead to a constraint for above-2G frames. Storage-constrained workloads can see an increase in the demand scan processing when the number of above-2G frames is not larger than the number of below-2G frames.
At least one of the following characteristics must be present in a pre-z/VM-5.2.0 system to receive a benefit from the z/VM 5.2.0 large real storage enhancements:
- A high below-2G paging rate
- A high expanded storage (Xstor) and/or DASD paging rate combined with a large number of available frames above the 2G line
A high expanded storage and/or DASD paging rate with a low below-2G paging rate and full utilization of the frames above the 2G line may indicate a storage-constrained workload, but not a below-2G-constrained workload.
The Apache workload was used to create a 3G workload that was below-2G-constrained and a 3G workload that was storage-constrained. The below-2G-constrained workload received a benefit from z/VM 5.2.0 but the storage-constrained workload showed a performance decrease.
The following table compares the characteristics of these two workloads, including some measurement data from z/VM 5.1.0 in a 3-way LPAR on a 2064-116 system.
Apache Workload Parameters and Selected Measurement Data
| Storage | Below-2G | |
|---|---|---|
| Constrained | Constrained | |
| Run ID | APXS9220 | 3GBS9220 |
| Server virtual machines | 12 | 3 |
| Number of Files | 600 | 5000 |
| Location of the file | Linux cache | Xstor MDC |
| Below-2G Page Rate | 28 | 83 |
| Xstor Total Rate | 26170 | 29327 |
| Resident Pages above 2G | 253692 | 28373 |
| Resident Pages below 2G | 495504 | 503540 |
| z/VM-5.1.0; 2064-116; 3 dedicated processors, 3G central storage, 8G expanded storage; 1024M server virtual storage size; 1 megabyte URL file size; 1 server virtual processor; 2 client virtual machines; 1 client virtual processor; 1 client connection per server | ||
z/VM 5.2.0 results for the storage-constrained workload are discussed later in this section. z/VM 5.2.0 results for the below-2G-constrained workload are discussed in the Enhanced Large Real Storage Exploitation section.
Both are measured with 3G of real storage, 8G of expanded storage, 2 AWM client virtual machines, and URL files of 1 megabyte. Both have low below-2G paging rates, high expanded storage paging rates, and no DASD paging. However, the storage-constrained workload is utilizing all the frames above the 2G line while the below-2G-constrained workload is utilizing a very small percentage of the above-2G frames.
For this experiment, location of the files is the primary controlling factor for the results, and location is controlled by the number of files and server virtual storage size.
For the storage-constrained workload, all 600 files reside in the Linux page cache of all 12 servers. Retrieving URL files from these Linux page caches does not require CP to move pages below the 2G line.
For the 2G-constrained workload, most of the 5000 files reside in z/VM's expanded storage minidisk cache because fewer than 1000 will fit in any server page cache and ones not in the file cache must be read by each Linux server. All page frames related to these Linux I/Os are required to be below 2G. Since the majority of page frames are in this category, above-2G storage frames aren't fully utilized.
Regression Workload Expectations
Most workloads that are not 2G-constrained will show an increase in CP CPU time because of the following factors.
- Address translation, including CCW translation, is more costly since CP is no longer identity-mapped to real storage
- Module linkage is more costly because of the mode switches between 31-bit and 64-bit
- Saving and restoring status, including access registers, is more costly with 64-bit addresses
- Trace table pages fill up faster because trace table entries have become larger due to the presence of 64-bit addresses instead of 31-bit addresses. This results in an increase in trace-table-full interrupts
Some performance improvements partially offset these factors. Each specific combination of the CP regression factors and the offsetting improvements will cause unique regression results. Workloads that concentrate on one particular CP service can experience a significantly different performance impact than comprehensive workloads. Storage-constrained workloads in real storage sizes where the number of above-2G frames is not larger than the number of below-2G frames also show higher regression ratios than the more comprehensive workloads.
Virtual time should not be directly affected by these CP changes. Exceptions will be discussed in the detailed sections. Virtual time can be indirectly affected by uncontrollable factors such as hardware cache misses and timer-related activities.
Transaction rate is affected by a number of factors. Workloads currently limited by think time that do not fully utilize the processor capacity generally show very little change. Workloads that currently run at 100% of processor capacity will generally see a decrease in the transaction rate that is proportional to the increase in CPU time per transaction. Workloads currently limited by virtual MP locking may see an increased transaction rate because the Diagnose X'44' fast path can reduce the time it takes to dispatch another virtual processor once the lock is freed.
Regression Summary
The following table provides an overall summary of the regression workloads. Values are provided for the transaction rate, total microseconds (µsec) per transaction, CP µsec per transaction, and virtual µsec per transaction. All values are expressed as the percentage change between z/VM 5.1.0 and z/VM 5.2.0. The meaning of "transaction" varies greatly from one workload to another. More details about each individual workload follow the table.
| Total | CP | Virtual | |||
| Workload | ETR | CPU/Tx | CPU/Tx | CPU/Tx | |
| Apache nonpaging (2064-116) | 1.9 | 4.9 | 1.7 | 6.4 | |
| Apache nonpaging (2094-738) | -1.3 | 1.7 | -0.3 | 2.3 | |
| Apache paging Xstor (3G) | -11 | 11 | 22 | 3.5 | |
| Apache paging mixed (5G) | 2.7 | 2.8 | 6.2 | 0.0 | |
| CMS-Intensive (CMS1) | 0.3 | 3.5 | 16 | -0.1 | |
| VSE Guest (PACE) | 0.0 | 2.2 | 12 | 0.0 | |
| Values are expressed as a percentage change from z/VM 5.1.0. Positive numbers in the ETR field mean that z/VM 5.2.0 had a higher transaction rate than z/VM 5.1.0. Positive numbers in the CPU/tx field mean that z/VM 5.2.0 required more processor time than z/VM 5.1.0. | |||||
Regression measurements were completed in a 2064-116 LPAR with 9 dedicated processors, 30G of real storage, and 1G of expanded storage. Regression measurements were also completed in a 2094-738 LPAR with 4 dedicated processors, 5G of real storage, and 4G of expanded storage. z/VM 5.2.0 regression characteristics were better on the 2094-738 than on the 2064-116.
Since these measurements use a 3-way client virtual machine, z/VM 5.2.0 receives some benefit from the Diagnose X'44' (DIAG 44) improvement described in the Extended Diagnose X'44' Fast Path section.
The following table contains selected measurement results for the 2094-738 measurement.
Apache nonpaging workload measurement data
| z/VM Release | 5.1.0 | 5.2.0 |
| Run ID | APS9220 | APT9280 |
| Tx rate | 3528.639 | 3481.151 |
| Total µsec/Tx | 1127 | 1146 |
| CP µsec/Tx | 288 | 287 |
| Emul µsec/Tx | 839 | 858 |
| DIAG 44/sec - Normal | 24514 | 3511 |
| DIAG 44/sec - Fast Path | 0 | 42368 |
| DIAG 44/sec - Total | 24514 | 45879 |
| Resident Pages above 2G | 334800 | 377825 |
| Resident Pages below 2G | 70675 | 475 |
| Steady-State CPU Util | 97.8 | 98.1 |
| 2094-738; 4 dedicated processors, 5G real storage, 4G expanded storage; 10 connections | ||
This is a good regression example of a nonpaging z/VM 5.1.0 MP guest with greater than 2 virtual processors. Although the configuration has 5G of real storage, the resident page count shows that less than 2G are needed for this workload.
The normal-path DIAG 44 rate decreased by 85%, while the DIAG 44 fast-path rate increased from zero to a rate that caused a 87% increase in the overall virtual DIAG 44 rate. This causes a shift of processor time from CP to the virtual machine, resulting in a decrease in CP µsec per transaction but an increase in virtual µsec per transaction. Total µsec per transaction increased by 1.7% and since the base processor utilization was nearly 100%, transaction rate decreased by a similar amount.
Although no run data are included for the 2064-116 measurement, it showed a slight improvement in transaction rate because there were enough idle processor cycles to absorb the increase in total µsec per transaction.
Apache Paging
The Apache workload was used to create a z/VM 5.1.0 storage-constrained workload that was measured in different paging configurations. The following table contains the Apache workload parameter settings.
Apache parameters for paging workload
| 3G | 5G | |
|---|---|---|
| Server virtual machines | 12 | 12 |
| Client virtual machines | 2 | 2 |
| Client connections per server | 1 | 1 |
| Number of 1M files | 600 | 800 |
| Location of the files | Linux cache | Linux cache |
| Server virtual storage | 1024M | 1024M |
| Server virtual processors | 1 | 1 |
| Client virtual processors | 1 | 1 |
The specific paging environment was controlled by the following Xstor values.
- 8G for Xstor paging
- 4G for mixed paging
- 0 for DASD paging
The following table contains selected results between z/VM 5.2.0 and z/VM 5.1.0 for the 3G Xstor paging measurements.
3G Apache Xstor paging workload measurement data
| z/VM Release | 5.1.0 | 5.2.0 |
| Run ID | APXS9220 | APXTA193 |
| Tx rate | 67.860 | 60.564 |
| Below-2G Page Rate | 28 | 0 |
| Xstor Total Rate | 26170 | 22072 |
| Resident Pages above 2G | 253692 | 247390 |
| Resident Pages below 2G | 495504 | 501020 |
| Steady-State CPU Util | 99.8 | 99.8 |
| Total µsec/Tx | 45506 | 50818 |
| CP µsec/Tx | 20018 | 24444 |
| Emul µsec/Tx | 25488 | 26374 |
| 2064-116; 3 dedicated processors, 3G central storage, 8G expanded storage; 24 connections | ||
This workload shows a higher increase in CP µsec per transaction than any other measurement in the regression summary table. This is a storage-constrained workload in a configuration where the number of above-2G pages is not larger than the number of below-2G pages. This causes a large increase in the demand scan activity. The reason for this increase is still under investigation. It also shows an increase in virtual µsec per transaction. Total µsec per transaction increased by 11.7% and since the base processor utilization was nearly 100%, there was a corresponding decrease in the transaction rate.
Although the following 5G Apache paging workload is as storage constrained and has as high a paging rate, it does not have the increased demand scan activity because the number of above-2G pages is much larger than the number of below-2G pages.
Although no run data are included for the 3G mixed paging and DASD paging measurements, they show similar characteristics in CP µsec per transaction and virtual µsec per transaction but show a smaller decrease in transaction rate because they are not limited by 100% processor utilization.
The following table contains selected results between z/VM 5.2.0 and z/VM 5.1.0 for the 5G mixed paging measurements.
5G Apache mixed paging workload measurement data
| z/VM Release | 5.1.0 | 5.2.0 |
| Run ID | APMS9221 | APMTA192 |
| Tx rate | 55.487 | 57.004 |
| Below 2G Page Rate | 29 | 0 |
| Xstor Total Rate | 13787 | 16556 |
| Xstor Migr Rate | 1463 | 2615 |
| Pages Read from DASD | 3749 | 2724 |
| Pages Written to DASD | 3450 | 2602 |
| Resident Pages above 2G | 778626 | 767286 |
| Resident Pages below 2G | 489267 | 497691 |
| Total µsec/Tx | 49855 | 51268 |
| CP µsec/Tx | 22838 | 24258 |
| Emul µsec/Tx | 27016 | 27010 |
| 2064-116; 3 dedicated processors, 5G central storage, 4G expanded storage 24 connections | ||
The 5G measurement showed some different characteristics from the 3G measurements. The transaction rate increased 2.8% instead of decreasing. Virtual µsec per transaction remained nearly identical instead of increasing. Both CP µsec per transaction and total µsec per transaction increased by a smaller percentage. These results demonstrate the expected regression characteristics of z/VM 5.2.0 compared to z/VM 5.1.0 for this workload.
These Apache measurements use guest LAN QDIO connectivity which contains one of the offsetting improvements. Results with vSwitch, real QDIO, or other connectivity methods may show a higher increase in CP µsec per transaction.
All disk I/O is avoided in the Apache measurements because the URL files are preloaded in either a z/VM expanded storage minidisk cache or the Linux page cache. Three separate disk I/O workloads, each exercising very specific system functions, are discussed in CP Disk I/O Performance.
CMS-Intensive
The minidisk version of the CMS1 workload described in CMS-Intensive (CMS1) was measured in a 2064-116 LPAR with 2 dedicated processors, 1G of real storage, and 2G of expanded storage. Results demonstrate expected regression characteristics of z/VM 5.2.0 compared to z/VM 5.1.0.
VSE Guest
The PACE workload described in VSE Guest (DYNAPACE) was measured in a 2064-116 LPAR with 2 dedicated processors, 1G of real storage and no expanded storage. Results demonstrate expected regression characteristics of z/VM 5.2.0 compared to z/VM 5.1.0.
Back to Table of Contents.
CP Disk I/O Performance
Introduction
The purpose of this study was to measure the processor costs of regression disk environments. Simply put, we defined a number of different measurement scenarios that exercise z/VM's ability to do disk I/O. We ran each measurement case on both z/VM 5.1.0 and z/VM 5.2.0 and compared corresponding runs.
For this study, we devised and ran three measurement suites:
- To evaluate guest-initiated I/O (SSCH, Diagnose x'250', and FCP SCSI), we used the Linux disk exerciser IOzone to measure disk performance a Linux guest experiences. We ran IOzone against a wide variety of disk choices a Linux guest might use.
- To evaluate CMS-initiated diagnose I/O, we ran an XEDIT loop that repeatedly read a 400 KB file from a minidisk located on an emulated FBA volume.
- To evaluate CP paging I/O, we ran a CMS-based program designed to induce page faults. We ran this program in a system configuration specifically contrived to be particularly stressful on the Control Program. These stressors included more than just being short on real storage.
We chose these measurements specifically because they exercise disk I/O scenarios present in both z/VM 5.1.0 and z/VM 5.2.0. We need to mention, though, that z/VM 5.2.0 also contains new I/O support. In our Linux Disk I/O Alternatives chapter, we describe 64-bit extensions to Diagnose x'250' and the Linux device driver that exploits them.
In the following sections we describe the results of each of our disk I/O regression experiments.
z/VM 5.3 note: For later information about SCSI performance, see our z/VM 5.3 SCSI study.
Linux IOzone
To measure disk performance with Linux guests, we set up a single Linux guest running the IOzone disk exerciser. IOzone is a file system exercise tool. See our IOzone workload description for details of how we run IOzone.
For this experiment, we used the following configuration:
- 2084-324, two-way dedicated partition, 2 GB central storage, 2 GB expanded storage.
- No activity in the partition being measured, except our Linux guest and the test case driver.
- 2105-F20, 16 GB of cache, FICON and FCP attached.
- z/VM 5.1.0 GA RSU, or z/VM 5.1.0 serviced through mid-October 2005, or z/VM 5.2.0 GA RSU plus certain other PTFs, as called out in the tables below.
- Linux SLES 9 SP 1, 192 MB virtual uniprocessor, ext2 file systems.
The Linux guest is 64-bit in all runs except the Diagnose x'250' runs. In those runs, we used a 31-bit Linux guest. We could not do a regression measurement of 64-bit Diagnose x'250' I/O, because it is not supported on z/VM 5.1.0.
It is important to notice that we chose the ballast file to be about four times larger than the virtual machine. This ensures that the Linux page cache plays little to no role in buffering IOzone's file operations. We wanted to be sure to measure CP I/O processing performance, not the performance of the Linux page cache.
We remind the reader that this chapter studies disk performance from a regression perspective. To see performance comparisons among choices, and to read about new z/VM 5.2.0 disk choices for Linux guests, the reader should refer to our Linux Disk I/O Alternatives chapter.
We also remind the reader that our primary intent in conducting these experiments was to measure the Control Program overhead (processor time per unit of work) associated with these disk I/O methods, so as to determine how said overhead had changed from z/VM 5.1.0 to z/VM 5.2.0. It was not our intent to measure or report on the maximum I/O rate or throughput achievable with z/VM, or with a specific processor, or with a specific type or model of disk hardware.
The disk configurations mentioned in this chapter (e.g., EDED, LNS0, and so on) are defined in our IOzone workload description appendix. For the reader's convenience, we offer here the following brief tips on interpreting the configuration names:
| Name prefix | Name suffix |
|---|---|
| E for ECKD with the Linux ECKD CCW driver. |
|
| F for emulated FBA with the Linux FBA CCW driver. |
|
| D2 for ECKD minidisk with the Linux Diagnose X'250' driver. |
|
| LNS0 for Linux owning an FCP subchannel and using the zFCP driver. | None. |
For each configuration, the tables below show the ratio of the z/VM 5.2.0 result to the corresponding z/VM 5.1.0 result. Each table comments on a particular phase of IOzone.
|
IOzone Initial Write Results (scaled to z/VM 5.1.0) |
||||
| Configuration | KB/sec | Total CPU/KB | CP CPU/KB | Virtual CPU/KB |
| ECKD ccw | ||||
| EDED | 0.963 | 1.01 | 1.09 | 0.997 |
| EMD0 | 1.12 | 1.01 | 1.05 | 1.01 |
| EMD1 | 1.01 | 1.01 | 1.05 | 1.00 |
| Emulated FBA ccw | ||||
| FDED | 0.999 | 1.01 | 1.04 | 1.000 |
| FMD0 | 1.00 | 1.02 | 1.04 | 1.01 |
| FMD1 | 0.998 | 1.01 | 1.03 | 0.994 |
| ECKD Diag X'250' (31-bit) | ||||
| D210 | 1.07 | 1.01 | 1.04 | 1.01 |
| D211 | 0.999 | 1.03 | 1.08 | 1.01 |
| D220 | 2.24 | 0.964 | 0.820 | 0.992 |
| D221 | 1.02 | 1.03 | 1.06 | 1.03 |
| D240 | 2.31 | 0.954 | 0.734 | 0.985 |
| D241 | 1.02 | 1.00 | 0.994 | 1.00 |
| Dedicated FCP | ||||
| LNS0 | 1.00 | 1.01 | 1.03 | 1.01 |
| Notes: 2084-324. Two-way dedicated partition. 2 GB central. 2 GB XSTORE. 2105-F20 16 GB FICON/FCP. z/VM 5.1.0 GA RSU. z/VM 5.2.0 GA RSU + VM63893. Linux SLES 9 SP 1, 192 MB virtual uniprocessor. | ||||
|
IOzone Rewrite Results (scaled to z/VM 5.1.0) |
||||
| Configuration | KB/sec | Total CPU/KB | CP CPU/KB | Virtual CPU/KB |
| ECKD ccw | ||||
| EDED | 0.976 | 1.03 | 1.04 | 1.02 |
| EMD0 | 1.01 | 1.02 | 1.05 | 1.01 |
| EMD1 | 1.00 | 1.01 | 1.01 | 1.00 |
| Emulated FBA ccw | ||||
| FDED | 0.999 | 1.04 | 1.06 | 1.02 |
| FMD0 | 0.999 | 1.04 | 1.04 | 1.04 |
| FMD1 | 0.999 | 1.01 | 1.03 | 0.999 |
| ECKD Diag X'250' (31-bit) | ||||
| D210 | 0.995 | 1.00 | 1.02 | 0.991 |
| D211 | 0.998 | 1.04 | 1.06 | 1.03 |
| D220 | 0.992 | 1.04 | 1.10 | 1.02 |
| D221 | 1.00 | 1.04 | 1.11 | 1.03 |
| D240 | 1.00 | 1.02 | 1.08 | 1.01 |
| D241 | 0.965 | 1.03 | 1.07 | 1.02 |
| Dedicated FCP | ||||
| LNS0 | 0.969 | 1.000 | 0.999 | 1.000 |
| Notes: 2084-324. Two-way dedicated partition. 2 GB central. 2 GB XSTORE. 2105-F20 16 GB FICON/FCP. z/VM 5.1.0 GA RSU. z/VM 5.2.0 GA RSU + VM63893. Linux SLES 9 SP 1, 192 MB virtual uniprocessor. | ||||
|
IOzone Initial Read Results (scaled to z/VM 5.1.0) |
||||
| Configuration | KB/sec | Total CPU/KB | CP CPU/KB | Virtual CPU/KB |
| ECKD ccw | ||||
| EDED | 0.995 | 1.09 | 1.50 | 1.02 |
| EMD0 | 0.995 | 1.07 | 1.40 | 1.01 |
| EMD1 | 0.995 | 1.04 | 1.12 | 0.986 |
| Emulated FBA ccw | ||||
| FDED | 0.994 | 1.05 | 1.06 | 1.03 |
| FMD0 | 0.995 | 1.03 | 1.05 | 1.02 |
| FMD1 | 0.998 | 1.01 | 1.01 | 1.01 |
| ECKD Diag X'250' (31-bit) | ||||
| D210 | 0.999 | 1.04 | 1.09 | 1.01 |
| D211 | 0.999 | 1.07 | 1.09 | 1.05 |
| D220 | 0.999 | 1.04 | 1.11 | 1.02 |
| D221 | 0.998 | 1.04 | 1.05 | 1.02 |
| D240 | 0.998 | 1.00 | 0.994 | 1.01 |
| D241 | 0.996 | 1.06 | 1.14 | 1.01 |
| Dedicated FCP | ||||
| LNS0 | 0.997 | 1.02 | 0.973 | 1.02 |
| Notes: 2084-324. Two-way dedicated partition. 2 GB central. 2 GB XSTORE. 2105-F20 16 GB FICON/FCP. z/VM 5.1.0 GA RSU. z/VM 5.2.0 GA RSU + VM63893. Linux SLES 9 SP 1, 192 MB virtual uniprocessor. | ||||
|
IOzone Reread Results (scaled to z/VM 5.1.0) |
||||
| Configuration | KB/sec | Total CPU/KB | CP CPU/KB | Virtual CPU/KB |
| ECKD ccw | ||||
| EDED | 0.996 | 1.02 | 1.32 | 0.962 |
| EMD0 | 0.995 | 1.06 | 1.41 | 0.999 |
| EMD1 | 0.954 | 1.27 | 1.41 | 1.22 |
| Emulated FBA ccw | ||||
| FDED | 0.994 | 1.03 | 1.06 | 0.994 |
| FMD0 | 0.996 | 1.03 | 1.04 | 1.01 |
| FMD1 | 0.992 | 0.922 | 0.925 | 0.919 |
| ECKD Diag X'250' (31-bit) | ||||
| D210 | 0.999 | 1.03 | 1.09 | 1.000 |
| D211 | 0.954 | 1.16 | 1.18 | 1.14 |
| D220 | 1.000 | 1.04 | 1.10 | 1.02 |
| D221 | 0.975 | 1.03 | 1.05 | 1.01 |
| D240 | 0.998 | 1.02 | 1.08 | 1.01 |
| D241 | 0.954 | 0.988 | 1.09 | 0.952 |
| Dedicated FCP | ||||
| LNS0 | 0.998 | 1.01 | 1.06 | 0.999 |
| Notes: 2084-324. Two-way dedicated partition. 2 GB central. 2 GB XSTORE. 2105-F20 16 GB FICON/FCP. z/VM 5.1.0 GA RSU. z/VM 5.2.0 GA RSU + VM63893. Linux SLES 9 SP 1, 192 MB virtual uniprocessor. | ||||
|
IOzone Overall Results (scaled to z/VM 5.1.0) |
||||
| Configuration | KB/sec | Total CPU/KB | CP CPU/KB | Virtual CPU/KB |
| ECKD ccw | ||||
| EDED | 0.979 | 1.03 | 1.21 | 1.00 |
| EMD0 | 1.04 | 1.03 | 1.20 | 1.01 |
| EMD1 | 1.00 | 1.05 | 1.13 | 1.02 |
| Emulated FBA ccw | ||||
| FDED | 0.997 | 1.03 | 1.05 | 1.01 |
| FMD0 | 0.999 | 1.03 | 1.04 | 1.02 |
| FMD1 | 0.998 | 1.000 | 1.01 | 0.989 |
| ECKD Diag X'250' (31-bit) | ||||
| D210 | 1.02 | 1.02 | 1.06 | 1.00 |
| D211 | 0.998 | 1.06 | 1.10 | 1.04 |
| D220 | 1.37 | 1.01 | 1.01 | 1.01 |
| D221 | 1.00 | 1.04 | 1.06 | 1.03 |
| D240 | 1.42 | 0.990 | 0.942 | 0.998 |
| D241 | 0.993 | 1.02 | 1.09 | 0.999 |
| Dedicated FCP | ||||
| LNS0 | 0.988 | 1.01 | 1.02 | 1.01 |
| Notes: 2084-324. Two-way dedicated partition. 2 GB central. 2 GB XSTORE. 2105-F20 16 GB FICON/FCP. z/VM 5.1.0 GA RSU. z/VM 5.2.0 GA RSU + VM63893. Linux SLES 9 SP 1, 192 MB virtual uniprocessor. | ||||
Discussion
Most of the IOzone cases show regression results consistent with the trends reported in our general discussion of the regression traits of z/VM 5.2.0, namely, that we see some rise in CP CPU/tx but that overall CPU/tx and transaction rate are not changed all that much.
Notable are the Diagnose x'250' initial write cases for block sizes 2048 and 4096, which showed markedly improved data rates and CP CPU times compared to z/VM 5.1. We investigated this for each block size by comparing the z/VM 5.1 initial write pass to its rewrite pass, and by comparing the z/VM 5.2 initial write pass to its rewrite pass. It was our intuition that on a given z/VM release, we should find that the initial write pass had about the same performance as the rewrite pass. On z/VM 5.2, we indeed found what we expected. On z/VM 5.1, however, we found that the initial write pass experienced degraded performance (about 56% drop in throughput and about 43% rise in CP CPU/tx) compared to the rewrite pass. We also found that the rewrite numbers for z/VM 5.1 were about equal to both the initial write and rewrite numbers for z/VM 5.2. Based on these findings, we concluded that z/VM 5.2 must have coincidentally repaired a z/VM 5.1 defect in Diagnose x'250' write processing, and so we studied the anomaly no further.
During z/VM 5.2.0 development, we measured a variety of workloads, some known to be heavily constrained on z/VM 5.1.0, others not. We knew from our measures of unconstrained workloads that they would pay a CPU consumption penalty for the constraint relief technology put into z/VM 5.2.0, even though they would get no direct benefit from those technologies. To compensate, we looked for ways to put in offsetting improvements for such workloads. For work resembling IOzone, we made improvements in CCW translation and in support for emulated FBA volumes. This helped us maintain regression performance for z/VM 5.2.0.
XEDIT Read Loop
In this experiment we gave a CMS guest a 4-KB-formatted minidisk on an emulated FBA volume, MDC OFF. We ran an exec that looped on XEDIT reading a 100-block file from the minidisk. We measured XEDIT file loads per second and total CPU time per XEDIT file load.
In this measurement we specifically confined ourselves to using an emulated FBA minidisk with MDC OFF. We did this because we knew that regression performance of ECKD volumes and of MDC were being covered by the Linux IOzone experiments. We also knew that excessive CPU time per XEDIT file load had been addressed in the z/VM 5.1.0 service stream since GA. We wanted to assess the impact of that service.
As in other experiments, we used the zSeries hardware sampler to measure CPU time consumed.
For this experiment, we used the following configuration:
- 2064-116, three-way dedicated partition, 4 GB central storage, 2 GB expanded storage.
- No activity in the partition being measured, except our CMS guest and the test case driver. All other partitions either shut down or idling.
- 2105-F20, 16 GB of cache, FCP attached.
- z/VM 5.1.0 GA RSU, or z/VM 5.1.0 serviced through mid-October 2005, or z/VM 5.2.0 GA RSU, as called out in the table below.
- CMS minidisk, formatted at 4 KB, MDC OFF.
In the table below, a transaction is one XEDIT load of the 100-block (400 KB) file.
|
XEDIT Results (scaled to 5.1 GA RSU) |
|||
| Run | 5.1 GA RSU | 5.1 Oct 2005 | 5.2 GA RSU |
| Tx/sec | 6.42 | 71.9 | 76.5 |
| scaled | 11.2 | 11.9 | |
| CP/tx (usec) | 24400 | 1980 | 2050 |
| scaled | 0.0809 | 0.0837 | |
| Virt/tx (usec) | 575 | 552 | 548 |
| scaled | 0.961 | 0.954 | |
| Total/tx (usec) | 25000 | 2530 | 2590 |
| scaled | 0.101 | 0.104 | |
| Notes: 2064-116. Three-way dedicated partition. 4 GB central. 2 GB XSTORE. 2105-F20 16 GB FCP. EFBA minidisk with MDC OFF. | |||
Discussion
In these measurements we saw an 1190% improvement in throughput rate and a 91.5% decrease in CPU time per transaction, compared to z/VM 5.1.0 GA RSU. APARs VM63534 and VM63725, available correctively for z/VM 5.1.0 and included in z/VM 5.2.0, contained performance enhancements for I/O to emulated FBA volumes. These changes are especially helpful for applications whose file I/O buffers are not aligned on 512-byte boundaries. They also help applications that tend to issue multi-block I/Os. XEDIT does both of these things and so these changes were effective for it.
Paging
In this experiment we used a CMS Rexx program to induce paging on a z/VM system specifically configured to be storage-constrained. This program used the Rexx storage() function to touch virtual storage pages randomly, with a uniform distribution. By running this program in a storage-constrained environment, we induced page faults.
In this experiment, we measured transaction rate by measuring pages touched per second by the thrasher. Being interested in how Control Program overhead had changed since z/VM 5.1.0, we also measured CP CPU time per page moved. Finally, being interested in the efficacy of CP's storage management logic, we calculated the pages CP moved per page the thrasher touched. Informally, we thought of this metric as commenting on how "smart" CP was being about keeping the "correct" pages in storage for the thrasher. Though this metric isn't directly related to a regression assessment of DASD I/O performance, we are reporting it here anyway as a matter of general interest.
For this experiment, we used the following configuration:
- 2084-324, two-way dedicated partition, 2 GB central storage, 0 GB expanded storage.
- No activity in the partition being measured, except our CMS guest and the test case driver. All other partitions either shut down or idling.
- 2105-F20, 16 GB of cache, FICON or FCP attached.
- z/VM 5.1.0 GA RSU, or z/VM 5.1.0 serviced through mid-October 2005, or z/VM 5.2.0, as called out in the tables below.
- Two 2 GB paging volumes.
- 512 MB CMS guest, configured to use the Rexx storage() function to touch pages randomly within a 480 MB address range of the virtual machine.
- 944 MB of other virtual machines logged on, all with their addresses spaces completely locked into storage via CP LOCK REAL.
- CP SET TRACEFRAMES was set artificially high so that we would end up with about 180 MB of real storage frames available for holding pages of the thrashing CMS guest.
- We ran the thrasher for 20 minutes unmeasured, then collected data for five minutes. Measurements reported here are from the five-minute measured interval.
The net effect of this configuration was that the z/VM Control Program would have about 180 MB of real storage to use to run a CMS guest that was trying to touch about 480 MB worth of its pages. This ratio created a healthy paging rate. Further, the Control Program would have to run this guest while dealing with large numbers of locked user pages and CP trace table frames. This let us exercise real storage management routines that were significantly rewritten for z/VM 5.2.0.
ECKD On All Releases
|
Paging Results (scaled to ECKD 5.1 GA RSU) |
|||
| Run | ECKD 5.1 GA RSU | ECKD 5.1 Oct 2005 | ECKD 5.2 GA RSU + APARs |
| Touches/sec | 1670 | 1620 | 1600 |
| scaled | 0.973 | 0.960 | |
| CP/move (usec) | 9.84 | 9.54 | 11.5 |
| scaled | 0.970 | 1.17 | |
| Moves/touch | 1.38 | 1.43 | 1.45 |
| scaled | 1.04 | 1.05 | |
| Notes: 2084-324. Two-way dedicated partition. 2 GB central. 0 GB XSTORE. 2105-F20 16 GB FICON/FCP. 944 MB of locked users. 180 MB of DPA. RXTHR2 in 512 MB virtual, thrashing randomly in 480 MB. z/VM 5.2.0 includes VM63845, VM63877, and VM63892. | |||
Emulated FBA On All Releases
|
Paging Results (scaled to 2105 5.1 GA RSU) |
|||
| Run | 2105 5.1 GA RSU | 2105 5.1 Oct 2005 | 2105 5.2 GA RSU + APARs |
| Touches/sec | 2150 | 2120 | 2700 |
| scaled | 0.985 | 1.25 | |
| CP/move (usec) | 44.7 | 43.3 | 37.9 |
| scaled | 0.970 | 0.850 | |
| Moves/touch | 1.48 | 1.53 | 1.41 |
| scaled | 1.04 | 0.953 | |
| Notes: 2084-324. Two-way dedicated partition. 2 GB central. 0 GB XSTORE. 2105-F20 16 GB FICON/FCP. 944 MB of locked users. 180 MB of DPA. RXTHR2 in 512 MB virtual, thrashing randomly in 480 MB. z/VM 5.2.0 includes VM63845, VM63877, and VM63892. | |||
Discussion
For ECKD, we saw a small drop in transaction rate and a rise of 17% in CP CPU time per page moved. This is consistent with our general findings for high paging workloads not constrained by the 2 GB line on z/VM 5.1.0. The rise is spread among linkage, dispatcher, address translation, and paging modules in the Control Program. We did find drops in time spent in available list scan and in management of spin locks.
For emulated FBA, we saw a 25% rise in transaction rate and a 15% drop in CP CPU time per page moved. Significant improvements in the Control Program's SCSI modules -- both the generic SCSI modules and the modules associated with paging to SCSI EDEVs -- accounted for most of the reduction. The reductions in spin lock time and available list scan time that we saw in the ECKD case also appeared in the emulated FBA runs, but they did not contribute as much percentage-wise to the drop, owing to the SCSI modules' CPU consumption being the dominant contributor to CP CPU time when z/VM pages to SCSI.
We emphasize that customers must apply VM63845, VM63877, and VM63892 to see correct results in environments having large numbers of locked pages.
Back to Table of Contents.
New Functions
This section contains performance evaluation results for the following new functions:
- Enhanced Large Real Storage Exploitation
- Extended Diagnose X'44' Fast Path
Back to Table of Contents.
Enhanced Large Real Storage Exploitation
This section summarizes the results of a number of new measurements that were designed to demonstrate the performance benefit of the Enhanced Large Real Storage Exploitation support. This support includes:
- The CP virtual address space no longer has a direct identity mapping to real storage
- The CP control block that maps real storage (frame table) was moved above 2G
- Some additional CP modules were changed to 64-bit addressing
- Some CP modules (including those involved in Linux virtual I/Os) were changed to use access registers to reference guest pages that reside above 2G
These changes remove the need for CP to move user pages below the 2G line, thereby providing a large benefit to workloads that were previously constrained below the 2G line. Removing this constraint lets z/VM 5.2.0 use large amounts of real storage.
For more information about these improvements, refer to the Performance Improvements section. For guidelines on detecting a below-2G constraint, refer to the CP Regression section.
The benefit of these enhancements will be demonstrated using three separate sets of measurements. The first set will show the benefit of z/VM 5.2.0 for a below-2G-constrained workload in a small configuration with three processors and 3G of real storage. The second set will show that z/VM 5.2.0 continues to scale as workload, real storage, and processors are increased. The third set will demonstrate that all 128G of supported real storage can be efficiently supported.
Improvements in 3 GB of Real Storage
The Apache workload was used to create a z/VM 5.1.0 below-2G-constrained workload in 3G of real storage and to demonstrate the z/VM 5.2.0 improvements.
The following table contains the Apache workload parameter settings.
Apache workload parameters for measurements in this section
| Server virtual machines | 3 |
| Client virtual machines | 2 |
| Client connections per server | 1 |
| Number of 1M files | 5000 |
| Location of the files | Xstor MDC |
| Server virtual storage | 1024M |
| Server virtual processors | 1 |
| Client virtual processors | 1 |
This is a good example of the basic value of these enhancements and a demonstration of a z/VM 5.1.0 below-2G constraint without a large amount of storage above 2G.
Here is a summary of the z/VM 5.2.0 results compared to the z/VM 5.1.0 measurement.
- Transaction rate increased 13%
- Below-2G paging was eliminated
- Xstor page rate decreased by 89%
- User resident pages above 2G increased by 770%
- CP microseconds (µsec) per transaction decreased by 23%
- Virtual µsec per transaction decreased by 4.6%
- Total µsec per transaction decreased by 12%
The following table compares z/VM 5.1.0 and z/VM 5.2.0 measurements for this workload.
Apache workload selected measurement data
| z/VM Release | 5.1.0 | 5.2.0 |
| Run ID | 3GBS9220 | 3GBTA190 |
| Tx rate | 54.591 | 62.064 |
| Below-2G Page Rate | 83 | 0 |
| Xstor Total Rate | 29327 | 3209 |
| Resident Pages above 2G | 28373 | 246924 |
| Resident Pages below 2G | 503540 | 508752 |
| Total µsec/Tx | 62050 | 54490 |
| CP µsec/Tx | 25674 | 19769 |
| Emul µsec/Tx | 36377 | 34721 |
| 2064-116; 3 dedicated processors; 3G central storage; 8G expanded storage; 6 connections | ||
Scaling by Number of Processors
The Apache workload was used to create a z/VM 5.1.0 below-2G-constrained workload to demonstrate the z/VM 5.2.0 relief and to demonstrate that z/VM 5.2.0 would scale correctly as processors are added.
Since, in this example, the z/VM 5.1.0 below-2G constraint is created by Linux I/O, constraint relief can alternatively be provided by the Linux Fixed I/O Buffers feature. This minimizes the number of guest pages Linux uses for I/O at the cost of additional data moves inside the guest.
z/VM 5.1.0 preliminary experiments, not included in this report, had shown that a 5-way was the optimal configuration for this workload. Since the objective of this study was to show that z/VM 5.2.0 scales beyond z/VM 5.1.0, a 5-way was chosen as the starting point for this processor scaling study. z/VM 5.1.0 measurements of this workload with 9 processors or 16 processors could not be successfully completed because the below-2G-line constraint caused response times greater than the Application Workload Modeler (AWM) timeout value.
The following table contains the Apache workload parameter settings.
Apache workload parameters for measurements in this section
| 5-way | 9-way | 16-way | |
| Client virtual machines | 3 | 6 | 9 |
| Server virtual machines | 10 | 12 | 12 |
| 5000 files; 1 megabyte URL file size; Xstor MDC is primary location of the files; 1024M server virtual storage size; 1 server virtual processor; 1 client virtual processor; 1 client connection per server | |||
Figure 1 shows a graph of transaction rate for all the measurements in this section.
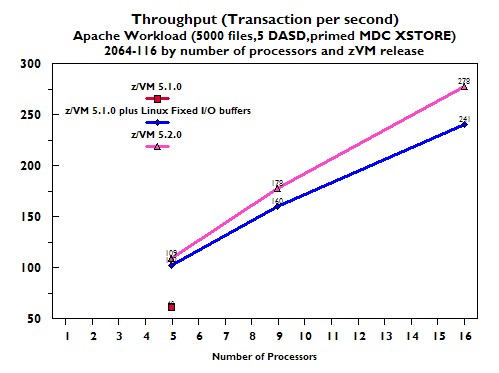 |
Here is a summary of the z/VM 5.2.0 results compared to the z/VM 5.1.0 measurements.
- With 5 processors, z/VM 5.2.0 provided a 73% increase in transaction rate over z/VM 5.1.0 with "Fixed I/O Buffers" OFF
- With 5 processors, z/VM 5.2.0 provided a 6.5% increase in transaction rate over z/VM 5.1.0 with "Fixed I/O Buffers" ON
- With 9 processors, z/VM 5.2.0 provided a 11% increase in transaction rate over z/VM 5.1.0 with "Fixed I/O Buffers" ON
- With 16 processors, z/VM 5.2.0 provided a 15% increase in transaction rate over z/VM 5.1.0 with "Fixed I/O Buffers" ON
On z/VM 5.2.0, as we increased the number of processors in the partition, transaction rate increased appropriately too. When we moved from five processors to nine processors, perfect scaling would have forecast an 80% increase in transaction rate, but we achieved a 72% increase, or a scaling efficiency of 90%. Similarly, when we moved from five processors to sixteen processors, we achieved a scaling efficiency of 73%. Both of these scaling efficiencies are better than the corresponding efficiencies we obtained on z/VM 5.1.0 with fixed Linux I/O buffers.
Here is a summary of the z/VM 5.2.0 results compared to the z/VM 5.1.0 with "Fixed I/O Buffers" OFF measurement.
- Transaction rate increased 73%
- Below-2G paging was eliminated
- Xstor/DASD paging was eliminated
- User resident pages above 2G increased by 3796%
- CP µsec per transaction decreased by 38.2%
- Virtual µsec per transaction decreased by 13.8%
- Total µsec per transaction decreased by 24.1%
Here is a summary of the z/VM 5.2.0 results compared to the z/VM 5.1.0 with "Fixed I/O Buffers" ON measurement.
- Transaction rate increased 6.5%
- Below-2G paging was eliminated
- Xstor/DASD paging was eliminated
- User resident pages above 2G increased by 51%
- CP µsec per transaction decreased by 2.1%
- Virtual µsec per transaction decreased by 7.0%
- Total µsec per transaction decreased by 5.3%
The following table compares z/VM 5.1.0, z/VM 5.1.0 with "Fixed I/O Buffers", and z/VM 5.2.0 for the 5-way measurements.
Apache workload selected measurement data
| z/VM Release | 5.1.0 | 5.1.0 | V.5.2.0 |
| Fixed I/O Buffers | No | Yes | No |
| Fixed I/O Buffers tuning | Na | Default | Na |
| Run ID | FIXS9222 | FIXS9223 | FIXT3290 |
| Tx rate | 62.734 | 102.444 | 109.083 |
| Below-2G Page Rate | 1983 | 118 | 0 |
| Xstor Total Rate | 48970 | 6562 | 0 |
| Xstor Migr Rate | 3604 | 0 | 0 |
| Total Pg to/from DASD | 8578 | 150 | 0 |
| Resident Pages above 2G | 76464 | 1966146 | 2979288 |
| Resident Pages below 2G | 463104 | 457132 | 182 |
| Total µsec/Tx | 70726 | 56676 | 53654 |
| CP µsec/Tx | 30079 | 18993 | 18598 |
| Emul µsec/Tx | 40647 | 37683 | 35055 |
| 2064-116; 5 dedicated processors, 30G central storage, 8G expanded storage; 30 connections | |||
Here is a summary of the z/VM 5.2.0 results compared to the z/VM 5.1.0 with "Fixed I/O Buffers" ON measurement.
- Transaction rate increased 15.3%
- Below-2G paging was eliminated
- Xstor/DASD paging was eliminated
- User resident pages above 2G increased by 57%
- CP µsec per transaction decreased by 9.5%
- Virtual µsec per transaction decreased by 11.2%
- Total µsec per transaction decreased by 10.6%
The following table compares z/VM 5.1.0 and z/VM 5.2.0 for the 16-way measurements.
Apache workload selected measurement data
| z/VM Release | 5.1.0 | 5.2.0 |
| Fixed I/O Buffers | Yes | No |
| Fixed I/O Buffers tuning | Default | Na |
| Run ID | FIXS9229 | FIXT3292 |
| Tx rate | 241.568 | 278.414 |
| Below-2G Page Rate | 933 | 0 |
| Xstor Total Rate | 19078 | 0 |
| Xstor Migr Rate | 0 | 0 |
| Total Pg to/from DASD | 1036 | 0 |
| Resident Pages above 2G | 2473126 | 3890865 |
| Resident Pages below 2G | 431460 | 198 |
| Total µsec/Tx | 73040 | 65291 |
| CP µsec/Tx | 25720 | 23288 |
| Emul µsec/Tx | 47319 | 42003 |
| 2064-116; 16 dedicated processors, 48G central storage, 14G expanded storage; 108 connections | ||
Scaling to 128G of Storage
The Apache workload was used to create a z/VM 5.2.0 storage usage workload and to demonstrate that z/VM 5.2.0 could fully utilize all 128G of supported real storage. Real storage was overcommitted in the 128G measurement and Xstor paging was the factor used to prove that all 128G was actually being used. A base measurement using the same Apache workload parameters was also completed in a much smaller configuration to prove that the transaction rate scaled appropriately. There are no z/VM 5.1.0 measurements of this Apache performance workload scenario.
Since the purpose of this workload is to use real storage, not to create a z/VM 5.1.0 below-2G constraint, the server virtual machines were defined large enough so that nearly all of the URL files could reside in the Linux page cache. The number of servers controlled the amount of real storage used and the number of clients controlled the total number of connections necessary to use all the processors.
The following table contains the Apache workload parameter settings.
Apache workload parameters for measurements in this section
| 22G | 128G | |
| Client virtual machines | 2 | 7 |
| Server virtual machines | 2 | 13 |
| 10000 files; 1 megabyte URL file size; 10240M server virtual storage size; Linux page cache is primary location of the files; 1 server virtual processor; 1 client virtual processor; 1 client connection per server | ||
The results show that all 128G of storage is being used with a lot of Xstor paging and all processors are at 100.0% utilization in the steady state intervals. Xstor paging increased by a higher percentage than other factors because real storage happens to be more overcommitted in the 128G measurement than in the 22G base measurement. Total µsec per transaction remained nearly identical despite a shift of lower CP µsec per transaction and higher virtual µsec per transaction. Transaction rate scaled at 99% efficiency compared to the number of processors and seems sufficient to prove efficient utilization of 128G.
Here is a summary of the 128G results compared to the 22G base results.
- Transaction rate increased 446%
- Xstor page rate increased by 1716%
- User resident pages above 2G increased by 531%
- CP µsec per transaction decreased by 10%
- Virtual µsec per transaction increased by 7%
- Total µsec per transaction remained nearly identical
The following table compares the 22G and the 128G measurements.
Apache storage usage workload selected measurement data
| Processors | 2 | 11 |
| Total Real | 22528 | 131072 |
| Total CP Xstor | 16384 | 31744 |
| Total connections | 4 | 91 |
| Run ID | 128T8157 | 128T8154 |
| Tx rate | 101.291 | 553.336 |
| Xstor Total Rate | 723 | 13139 |
| Resident Pages above 2G | 5187091 | 32755866 |
| Resident Pages below 2G | 6749 | 57618 |
| Total µsec/Tx | 19997 | 19990 |
| CP µsec/Tx | 8267 | 7436 |
| Emul µsec/Tx | 11731 | 12555 |
| PGMBK Frames | 46744 | 282k |
| SXS Available Pages | 516788 | 515725 |
| 2094-738; z/VM 5.2.0 | ||
z/VM 5.2.0 should be able to scale other applications to this level unless limited by some other factor.
Page Management Blocks (PGMBKs) still must reside below 2G and will become a limiting factor prior to using 256G of in-use virtual. For the 128G measurement, about 53% of the below-2G storage is being used for PGMBKs. See the Performance Considerations section for further discussion.
Available pages in the System Execution Space (SXS) do not appear to be approaching any limitation since they did not increase between the 22G and the 128G measurement. In both measurements, more than 90% of the SXS pages are still available.
Back to Table of Contents.
Extended Diagnose X'44' Fast Path
The Apache workload was used to create a z/VM 5.2.0 workload for evaluation of the performance improvement described in the Performance Improvements section.
In addition to the measurements provided in this section, there is a comparison to z/VM 5.1.0 described in Apache Nonpaging where this improvement is one of the contributing factors.
Since there are so many other differences between z/VM 5.1.0 and z/VM 5.2.0, isolating the benefit of this improvement by comparing to a z/VM 5.1.0 base was not possible, so base measurements were on the same z/VM 5.2.0 system with the Diagnose X'44' (DIAG 44) fast path extensions removed.
Comparisons were made on both a 5-way and a 9-way to show that the benefit varies inversely with processor utilization. As utilization increases on the real processors, virtual processors are more likely to be in a real processor queue. If any virtual processor is queued when a DIAG 44 is issued, the fast path conditions are not met and thus it must use the normal path.
An extra 9-way measurement was completed with additional virtual processors to show that the DIAG 44 fast path percentage varies inversely with the number of virtual processors. As the number of virtual processors is increased, more are likely to be in a real processor queue. If any virtual processor is queued when a DIAG 44 is issued, the fast path conditions are not met and thus it must use the normal path. There is no evaluation of the overall benefit with the extra virtual processors.
These three comparisons demonstrate all the following expected results.
- An increase in the total virtual DIAG 44 rate
- A high percentage of the virtual DIAG 44s handled by the fast path
- Increased transaction rate
- Increased virtual microseconds (µsec) per transaction
- Decreased CP µsec per transaction
- Decreased CP system utilization
- Less benefit as the base becomes more processor constrained
- Lower fast path percentage as the number of virtual processors is increased
The following table contains the Apache workload parameter settings.
Apache parameters for DIAG 44 workloads
| Client virtual processors | 3 or 6 |
| Server virtual processors | 1 |
| Client virtual machines | 2 |
| Server virtual machines | 20 |
| Server virtual storage | 1024M |
| Client connections per server | 1 |
| Number of 1M Files | 2000 |
| Location of the file | Xstor MDC |
The following table contains results for the 9-way measurement.
9-way Apache DIAG 44 workload measurement data
| Fast Path Code Enabled | No | Yes |
| Run ID | EXPT5200 | EXPTD440 |
| Tx rate | 76.994 | 82.146 |
| DIAG 44/sec - Normal | 121035 | 8898 |
| DIAG 44/sec - Fast Path | 0 | 487087 |
| DIAG 44/sec - Total | 121035 | 495985 |
| Percent Fast Path | 0 | 98 |
| Total µsec/Tx (h) | 110252 | 103788 |
| CP µsec/Tx (h) | 51515 | 43869 |
| Emul µsec/Tx (h) | 58737 | 59917 |
| Total Util/Proc | 84.7 | 83.6 |
| System Util/Proc | 5.6 | 1.7 |
| 2064-116; 9 dedicated processors, 30G central storage, 8G expanded storage; z/VM 5.2.0; 40 connections; 3 client virtual processors | ||
This comparison demonstrates the DIAG 44 fast path extensions provided the basic expected benefits.
- Total virtual DIAG 44 rate increased by 309%
- 98% of the virtual DIAG 44s were handled by the fast path
- Transaction rate increased by 6.7%
- Virtual µsec per transaction increased by 2.0%
- CP µsec per transaction decreased by 14%
- CP system utilization decreased 69%
The following table contains results for the 5-way measurements.
5-way Apache DIAG 44 workload measurement data
| Fast Path Code Enabled | No | Yes |
| Run ID | EXPT5209 | EXPTD442 |
| Tx rate | 88.949 | 90.232 |
| DIAG 44/sec - Normal | 9056 | 3436 |
| DIAG 44/sec - Fast Path | 0 | 20525 |
| DIAG 44/sec - Total | 9056 | 23961 |
| Percent Fast Path | 0 | 85 |
| Total µsec/Tx | 59893 | 59070 |
| CP µsec/Tx | 22941 | 22646 |
| Emul µsec/Tx | 36952 | 36424 |
| Total Util/Proc | 92.8 | 92.3 |
| System Util/Proc | 0.8 | 0.6 |
| 2064-116; 5 dedicated processors, 30G central storage, 8G expanded storage; z/VM 5.2.0; 40 connections; 3 client virtual processors | ||
Overall processor utilization was 92% compared to 83% for the 9-way measurement. Basic improvements for this 5-way comparison were not as good as the 9-way, thus demonstrating less benefit as the base becomes more processor constrained. As utilization increases on the real processors, virtual processors are more likely to be in a real processor queue. If any virtual processor is queued when a DIAG 44 is issued, the fast path conditions are not met and thus it must use the normal path.
- Total virtual DIAG 44 rate increased by 164%
- 85% of the virtual DIAG 44s were handled by the fast path
- Transaction rate increased by 1.4%
- Virtual µsec per transaction increased by -1.4%
- CP µsec per transaction decreased by 1.3%
- System utilization decreased by 25%
The following table contains results for the 9-way measurements with 3 and 6 virtual processors.
9-way Apache DIAG 44 workload measurement data
| Client virtual processors | 3 | 6 |
| Run ID | EXPTD440 | EXPTD441 |
| Tx rate | 82.146 | 77.751 |
| DIAG 44/sec - Normal | 8898 | 31945 |
| DIAG 44/sec - Fast Path | 487087 | 401210 |
| DIAG 44/sec - Total | 495985 | 433155 |
| Percent Fast Path | 98 | 92 |
| Total µsec/Tx | 103788 | 117033 |
| CP µsec/Tx | 43869 | 51716 |
| Emul µsec/Tx | 59917 | 65317 |
| Total Util/Proc | 83.6 | 91.5 |
| System Util/Proc | 1.7 | 3.6 |
| Sched Spin Lock Rate | 13735 | 28739 |
| Sched Pct Spin Time | 0.373 | 1.234 |
| 2064-116; 9 dedicated processors, 30G central storage, 8G expanded storage; z/VM 5.2.0; 40 connections | ||
This comparison demonstrates lower fast path percentage as the number of virtual processors is increased. Percent of the virtual DIAG 44s handled by the fast path decreased from 98% to 92%. As the number of virtual processors are increased, more are likely to be in a real processor queue. If any virtual processor is queued when a DIAG 44 is issued, the fast path conditions are not met and thus it must use the normal path.
Overall results with 6 virtual processors were not as good as the results with 3 virtual processors. Transaction rate decreased by 4.8% and CP µsec per transaction increased by 12%. The increase in CP µsec per transaction is caused by a 259% increase in the normal-path DIAG 44 rate. Processing a normal-path DIAG 44 requires use of the scheduler lock and this caused the scheduler spin lock rate to increase by 109%. The percent of time spinning on the scheduler lock increased by 230%. This also accounts for the 111% increase in CP system utilization.
Back to Table of Contents.
QDIO Enhanced Buffer State Management
The Queued Direct I/O (QDIO) Enhanced Buffer State Management (QEBSM) facility provides an optimized mechanism for transferring data via QDIO (including FCP, which uses QDIO) to and from virtual machines. Prior to this new facility, z/VM had to mediate between the virtual machine and the OSA Express or FCP adapter during QDIO data transfers. With QEBSM, z/VM is not involved with a typical QDIO data transfer when the guest operating system or device driver supports the facility.
Starting with z/VM 5.2.0 and the z990/z890 with QEBSM Enablement applied (refer to Performance Related APARs for a list of required maintenance), a program running in a virtual machine has the option of using QEBSM when performing QDIO operations. By using QEBSM, the processor millicode performs the shadow-queue processing typically performed by z/VM for a QDIO operation. This eliminates the z/VM and hardware overhead associated with SIE entry and exit for every QDIO data transfer. The shadow-queue processing still requires processor time, but much less than required when done by the software. The net effect is a small increase in virtual CPU time coupled with a much larger decrease in CP CPU time.
This section summarizes measurement results comparing Linux communicating over a QDIO connection under z/VM 5.1.0 with measurement results under z/VM 5.2.0 with QEBSM active.
The Application Workload Modeler (AWM) was used to drive the workload for OSA and HiperSockets. (Refer to AWM Workload for more information.) A complete set of runs was done for RR and STR workloads. IOzone was used to drive the workload for native SCSI (FCP) devices. Refer to Linux IOzone Workload for details.
The measurements were done on a 2084-324 with two dedicated processors in each of the two LPARs used. Running under z/VM, an internal Linux driver at level 2.6.14-16 that supports QEBSM was used.
Two LPARs were used for the OSA and HiperSockets measurements. The AWM client ran in one LPAR and the AWM server ran in the other LPAR. Each LPAR had 2GB of main storage and 2GB of expanded storage. CP Monitor data were captured for one LPAR (client side) during the measurement and were reduced using Performance Toolkit for VM (Perfkit).
One LPAR was used for the FCP measurements. CP Monitor data and hardware instrumentation data were captured.
| Number of | CP CPU | Virtual CPU | Total CPU | Throughput | |
| Comparisons | range | range | range | range | |
| OSA | 9 | -74%/-92% | 25%/-9% | -13%/-29% | 0%/18% |
| HiperSockets | 9 | -70%/-100% | 8%/-1% | -19%/-36% | 1%/50% |
| FCP | 1 | -71% | -8% | -17% | 0%/1% |
The direct effect of QEBSM is to decrease CPU time. This, in turn, increases throughput in cases where it had been limited by CPU usage. This effect is demonstrated in this table for all three cases.
The following tables compare the measurements for OSA, HiperSockets and FCP. The %diff numbers shown are the percent increase (or decrease) between the measurement on 5.1.0 and 5.2.0.
| MTU 1492 | |||
| Number of clients | 01 | 10 | 50 |
| 5.1.0 | |||
| runid | lorn0101 | lorn1001 | lorn5001 |
| trans/sec | 2539.21 | 13756.22 | 28037.86 |
| Total CPU msec/trans | 0.064 | 0.042 | 0.033 |
| Virtual CPU msec/trans | 0.033 | 0.029 | 0.027 |
| CP CPU msec/trans | 0.031 | 0.013 | 0.006 |
| 5.2.0 (QEBSM) | |||
| runid | lorn0101 | lorn1001 | lorn5001 |
| trans/sec | 2672.71 | 14536.72 | 33072.56 |
| Total CPU msec/trans | 0.043 | 0.030 | 0.025 |
| Virtual CPU msec/trans | 0.036 | 0.028 | 0.024 |
| CP CPU msec/trans | 0.007 | 0.002 | 0.001 |
| % diff | |||
| trans/sec | 5% | 6% | 18% |
| Total CPU msec/trans | -33% | -29% | -25% |
| Virtual CPU msec/trans | 8% | -4% | -9% |
| CP CPU msec/trans | -78% | -85% | -92% |
| 2084-324; z/VM 5.2.0; Linux 2.6.14-16 | |||
| MTU 1492 | |||
| Number of clients | 01 | 10 | 50 |
| 5.1.0 | |||
| runid | losn0101 | losn1001 | losn5001 |
| MB/sec | 53.6 | 111.9 | 111.7 |
| Total CPU msec/MB | 7.76 | 5.92 | 6.25 |
| Virtual CPU msec/MB | 5.45 | 4.97 | 5.32 |
| CP CPU msec/MB | 2.31 | 0.95 | 0.93 |
| 5.2.0 (QEBSM) | |||
| runid | losn0101 | losn1001 | losn5001 |
| MB/sec | 55.4 | 111.9 | 111.7 |
| Total CPU msec/MB | 5.81 | 4.84 | 5.14 |
| Virtual CPU msec/MB | 5.38 | 4.68 | 4.96 |
| CP CPU msec/MB | 0.43 | 0.16 | 0.18 |
| % diff | |||
| MB/sec | 3% | 0% | 0% |
| Total CPU msec/MB | -25% | -18% | -18% |
| Virtual CPU msec/MB | -1% | -6% | -7% |
| CP CPU msec/MB | -81% | -83% | -81% |
| MTU 8992 | |||
| Number of clients | 01 | 10 | 50 |
| 5.1.0 | |||
| runid | losj0101 | losj1001 | losj5001 |
| MB/sec | 99.2 | 117.9 | 117.7 |
| Total CPU msec/MB | 4.86 | 3.99 | 4.35 |
| Virtual CPU msec/MB | 2.72 | 2.48 | 2.65 |
| CP CPU msec/MB | 2.14 | 1.51 | 1.70 |
| 5.2.0 (QEBSM) | |||
| runid | losj0101 | losj1001 | losj5001 |
| MB/sec | 102.1 | 117.9 | 117.7 |
| Total CPU msec/MB | 3.64 | 3.48 | 3.52 |
| Virtual CPU msec/MB | 3.17 | 3.09 | 3.13 |
| CP CPU msec/MB | 0.47 | 0.39 | 0.39 |
| % diff | |||
| MB/sec | 3% | 0% | 0% |
| Total CPU msec/MB | -25% | -13% | -19% |
| Virtual CPU msec/MB | 17% | 25% | 18% |
| CP CPU msec/MB | -78% | -74% | -77% |
| 2084-324; z/VM 5.2.0; Linux 2.6.14-16 | |||
| MTU 8192 | |||
| Number of clients | 01 | 10 | 50 |
| 5.1.0 | |||
| runid | lhrj0101 | lhrj1001 | lhrj5001 |
| trans/sec | 8069.87 | 22641.90 | 21692.50 |
| Total CPU msec/trans | 0.052 | 0.044 | 0.045 |
| Virtual CPU msec/trans | 0.031 | 0.030 | 0.030 |
| CP CPU msec/trans | 0.021 | 0.015 | 0.015 |
| 5.2.0 (QEBSM) | |||
| runid | lhrj0101 | lhrj1001 | lhrj5001 |
| trans/sec | 8150.87 | 33662.32 | 32532.32 |
| Total CPU msec/trans | 0.039 | 0.028 | 0.029 |
| Virtual CPU msec/trans | 0.033 | 0.028 | 0.029 |
| CP CPU msec/trans | 0.006 | 0.000 | 0.000 |
| % diff | |||
| trans/sec | 1.0% | 48.7% | 50.0% |
| Total CPU msec/trans | -25.4% | -36.1% | -34.5% |
| Virtual CPU msec/trans | 5.2% | -3.1% | -1.0% |
| CP CPU msec/trans | -70.0% | -100.0% | -100.0% |
| 2084-324; z/VM 5.2.0; Linux 2.6.14-16 | |||
| MTU 8192 | |||
| Number of clients | 01 | 10 | 50 |
| 5.1.0 | |||
| runid | lhsj0101 | lhsj1001 | lhsj5001 |
| MB/sec | 241.4 | 289.6 | 286.9 |
| Total CPU msec/MB | 3.56 | 3.45 | 3.48 |
| Virtual CPU msec/MB | 2.14 | 2.16 | 2.22 |
| CP CPU msec/MB | 1.43 | 1.30 | 1.26 |
| 5.2.0 (QEBSM) | |||
| runid | lhsj0101 | lhsj1001 | lhsj5001 |
| MB/sec | 264.7 | 349.6 | 340.0 |
| Total CPU msec/MB | 2.82 | 2.79 | 2.82 |
| Virtual CPU msec/MB | 2.81 | 2.78 | 2.81 |
| CP CPU msec/MB | 0.01 | 0.01 | 0.01 |
| % diff | |||
| MB/sec | 10% | 21% | 19% |
| Total CPU msec/MB | -21% | -19% | -19% |
| Virtual CPU msec/MB | 31% | 29% | 27% |
| CP CPU msec/MB | -100% | -100% | -100% |
| MTU 56K | |||
| Number of clients | 01 | 10 | 50 |
| 5.1.0 | |||
| runid | lhsh0101 | lhsh1001 | lhsh5001 |
| MB/sec | 294.3 | 452.2 | 436.7 |
| Total CPU msec/MB | 2.30 | 2.21 | 2.22 |
| Virtual CPU msec/MB | 1.52 | 1.59 | 1.60 |
| CP CPU msec/MB | 0.79 | 0.62 | 0.63 |
| 5.2.0 (QEBSM) | |||
| runid | lhsh0101 | lhsh1001 | lhsh5001 |
| MB/sec | 318.7 | 566.2 | 553.5 |
| Total CPU msec/MB | 1.72 | 1.71 | 1.73 |
| Virtual CPU msec/MB | 1.58 | 1.71 | 1.73 |
| CP CPU msec/MB | 0.14 | 0.00 | 0.01 |
| % diff | |||
| MB/sec | 8% | 25% | 27% |
| Total CPU msec/MB | -25% | -23% | -22% |
| Virtual CPU msec/MB | 4% | 7% | 8% |
| CP CPU msec/MB | -83% | -100% | -99% |
| 2084-324; z/VM 5.2.0; Linux 2.6.14-16 | |||
The following table shows the results for FCP. Values are provided for total microseconds (µsec) per transaction, CP (µsec) per transaction, and virtual (µsec) per transaction.
| IOzone | Init Write | Re-write | Init Read | Re-read | Total | CP | Virtual |
| (KB/s) | (KB/s) | (KB/s) | (KB/s) | µsec/tx | µsec/tx | µsec/tx | |
| 5.1.0 | 39954.88 | 35462.16 | 42619.48 | 42848.82 | 1198 | 172 | 1024 |
| 5.2.0 (QEBSM) | 40441.04 | 35527.13 | 43046.18 | 43389.61 | 993 | 50 | 940 |
| % diff | 1% | 0% | 1% | 1% | -17% | -71% | -8% |
| 2084-324; z/VM 5.2.0; Linux 2.6.14-16 | |||||||
Back to Table of Contents.
z/VM PAV Exploitation
Starting in z/VM 5.2.0 with APAR VM63855, z/VM now exploits IBM's Parallel Access Volumes (PAV) technology so as to expedite guest minidisk I/O. In this article we give some background about PAV, describe z/VM's exploitation of PAV, and show the results of some measurements we ran so as to assess the exploitation's impact on minidisk I/O performance.
2007-06-15: With z/VM 5.3 comes HyperPAV support. For performance information about HyperPAV, and for performance management advice about the use of both PAV and HyperPAV, see our HyperPAV chapter.
Introduction
A zSeries data processing machine lets software perform only one I/O to a given device at a time. For DASD, this means zSeries lets software perform only one I/O to a given disk at a time.In some environments, this can have limiting effects. For example, think of a real 3390 volume on z/VM, carved up into N user minidisks, each minidisk being a CMS user's 191 disk. There is no reason why we couldn't have N concurrent I/Os in progress at once, one to each minidisk. There would be no data integrity exposure, because the minidisks are disjoint. As long as there were demand, and as long as the DASD subsystem could keep up, we might experience increased I/O rates to the volume, and thereby increase performance.
Since 1999 zSeries DASD subsystems (such as the IBM TotalStorage Enterprise Storage Server 800) have supported technology called Parallel Access Volumes, or PAV. With PAV, the DASD subsystem can offer the host processor more than one device number per disk volume. For a given volume, the first device number is called the "base" and the rest are called "aliases". If there are N-1 aliases, the host can have N I/Os in progress to the volume concurrently, one to each device number.
DASD subsystems offering PAV do so in a static fashion. The IBM CE or other support professional uses a DASD subsystem configuration utility program to equip selected volumes with selected fixed PAV alias device numbers. The host can sense the aliases' presence when it varies the devices online. In this way, the host operating system can form a representation of the base-alias relationships present in the DASD subsystem and exploit that relationship if it chooses.
z/VM's first support for PAV, shipped as APAR VM62295 on VM/ESA 2.4.0, was to let guests exploit PAV. When real volumes had PAV, and when said volumes were DEDICATEd or ATTACHed to a guest, z/VM could pass its PAV knowledge to the guest, so the guest could exploit it. But z/VM itself did not exploit PAV at all.
With APAR VM63855 to z/VM 5.2.0, z/VM can now exploit PAV for I/O to PERM extents (user minidisks) on volumes attached to SYSTEM. This support lets z/VM exploit a real volume's PAV configuration on behalf of guests doing virtual I/Os to minidisks defined on the real volume. For example, if 20 users have minidisks on a volume, and if the volume has a few PAV aliases associated with it, and if those users generate sufficient I/O demand for the volume, the Control Program will use the aliases to drive more than one I/O to the volume concurrently. This support is not limited to driving one I/O per minidisk. If 20 users are all linked to the same minidisk, and I/O workload to that one minidisk demands it, z/VM will use the real volume's PAV aliases to drive more than one I/O to the single minidisk concurrently.
To measure the effect of z/VM's PAV exploitation, we crafted an I/O-intensive workload whose concurrency level and read-write mix we could control. We shut off minidisk cache and then ran the workload repeatedly, varying its concurrency level, its read-write mix, the PAV configuration of the real volumes, and the kind of DASD subsystem. We looked for changes in three I/O performance metrics -- I/O response time, I/O rate, and I/O service time -- as a function of these variables. This article documents our findings.
Executive Summary
Adding PAV aliases helps improve a real DASD volume's performance only if I/O requests are queueing at the volume. We can tell whether this is happening by comparing the volume's I/O response time to its I/O service time. As long as response time equals service time, adding PAV aliases will not change the volume's performance. However, if I/O response time is greater than I/O service time, queueing is happening and adding some PAV capability for the volume might be helpful.
Results when using PAV will depend on the amount of I/O concurrency in the workload, the fraction of the I/Os that are reads, and the kind of DASD subsystem in use. In our scenarios, workloads with a very low percentage of reads or a very high I/O concurrency level tended not to improve as much as workloads where the concurrency level exactly matched the number of aliases available or the read percentage was high. Also, modern storage subsystems, such as the IBM DS8100, tended to do better with PAV than IBM's older offerings.
Measurement Environment
IO3390 Workload
Our exerciser IO3390 is a CMS application that uses Start Subchannel (SSCH) to perform random one-block I/Os to an 83-cylinder minidisk formatted at 4 KB block size. The random block numbers are drawn from a uniform distribution [0..size_of_minidisk-1].
We organized the IO3390 machines' minidisks onto real volumes so that as we logged on additional virtual machines, we added load to the real volumes equally. For example, with eight virtual machines running, we had one IO3390 instance assigned to each real volume. With sixteen virtual machines we had two IO3390s per real volume. Using this scheme, we ran 1, 2, 3, 4, 5, 10, and 20 IO3390s per volume.
For each number of concurrent IO3390 instances per volume, we varied the aliases per volume in the range [0..4].
For each combination of number of IO3390s and number of aliases, we tried four different I/O mixes: 0% reads, 33% reads, 66% reads, and 100% reads.
The IO3390 agents are CMS virtual uniprocessor machines, 24 MB.
System Configuration
Processor: 2084-C24, model-capacity indicator 322, 2 GB central, 2 GB XSTORE, 2 dedicated processors. Two 3390-3 paging volumes.
IBM TotalStorage ESS F20 (2105-F20) DASD: 2105-F20, 16 GB cache. Two 1 Gb FICON chpids leading to a FICON switch, then two 1 Gb FICON chpids from the switch to the 2105. Four 3390-3 volumes in one LSS and four 3390-3 volumes in a second LSS. Four aliases defined for each volume.
IBM TotalStorage DS8100 (2107-921) DASD: 2107-921, 32 GB cache. Four 1 Gb FICON chpids leading to a FICON switch, then four 1 Gb FICON chpids from the switch to the 2107. Eight 3390-3 volumes in a single LSS. Four aliases defined for each volume.
IBM TotalStorage DS6800 (1750-511) DASD: 1750-511, 4 GB cache. Two 1 Gb FICON chpids leading to a FICON switch, then two 1 Gb FICON chpids from the switch to the 1750. Eight 3390-3 volumes in a single LSS. Four aliases defined for each volume.
With these configurations, each of our eight real volumes has up to four aliases the z/VM Control Program can use to parallelize I/O. By using CP VARY OFF to shut off some of the aliases, we can control the amount of parallelism available for each volume.
We ran all measurements with z/VM 5.2.0 plus APAR VM63855, with CP SET MDCACHE SYSTEM OFF in effect.
Metrics
For each experiment, we measured I/O rate, I/O service time, and I/O response time.
I/O rate is the rate at which I/Os are completing at a volume. For example, a volume might experience an I/O rate of 20 I/Os per second. As long as the size of the I/Os remains constant, using PAV to achieve a higher I/O rate for a volume is a performance improvement, because we move more data each second.
For a PAV volume, we assess the I/O rate for the volume by adding up the I/O rates for the device numbers mapping the volume. For example, if the base device number experiences 50/sec and each of three alias devices experiences 15/sec, the volume experiences 95/sec. Such summing is how we measure the effect of PAV on I/O rate. We always compute the volume's I/O rate by summing the individual rates for the device numbers mapping the volume.
I/O service time is the amount of time it takes for the DASD subsystem to perform the requested operation, once the host system starts the I/O. Factors influencing I/O service time include channel speed, load on the DASD subsystem, amount of data being moved in the I/O, whether the I/O is a read or a write, and the presence or availability of cache memory in the controller, just to name a few.
For a PAV volume, we measure the I/O service time for the volume by computing the average I/O service time for the device numbers mapping the volume. The calculation takes into account the I/O rate at each device number and the I/O service time incurred at each device number, so as to form an estimate (aka expected value) of the I/O service time a hypothetical I/O to the volume would incur. For example, if the base device is doing 100/sec with service time 5 msec, and the lone alias is doing 50/sec with service time 7 msec, the I/O service time for the volume is calculated to be (100*5 + 50*7) / 150, or 5.7 msec.
I/O response time is the total amount of time a guest virtual machine perceives it takes to do an I/O to its minidisk. This comprises I/O service time, explained previously, plus wait time. As a real device becomes busy, guest I/O operations destined for that real volume wait a little while in the real volume's I/O wait queue before they start. Time spent in the wait queue, called I/O wait time, is added to the I/O service time so as to produce the value called I/O response time.
For a PAV volume owned by SYSTEM, I/Os queued to a volume spend their waiting time queued on the base device number. When the I/O gets to the front of the line, it is pulled off the queue by the first device (base or one of its aliases) that becomes free. For a PAV volume, then, I/O response time is equal to the wait time spent in the base device queue plus the expected value of the I/O service time for the volume, the calculation of which was explained previously.
Of these three metrics, the most interesting ones from an application performance perspective are I/O rate and I/O response time. Changes in I/O service time, while indicative of storage server performance, are not too important to the application as long as they do not cause increases in I/O response time.
We ran each configuration for ten minutes, with CP Monitor set to emit sample records at one-minute intervals. To calculate average performance of a volume over the ten-minute interval, we threw away the first minute's and the last minute's values (so as to discard samples possibly affected by the run's startup and shutdown behaviors) and then averaged the remaining eight minutes' worth of samples. We used Performance Toolkit's interim FCX168 reports as the raw input for our calculations.
Tabulated Results
The cells in the tables below state the average values of the three I/O metrics over the eight volumes being exercised.
IBM TotalStorage ESS F20 (2105)
| IO3390 4K 0% reads |
Suite K411 | Aliases per volume | ||||||||||||||||||||||
| Workers per volume |
Metric | 0 | 1 | 2 | 3 | 4 | ||||||||||||||||||
| 1 |
|
|
|
|
|
|
||||||||||||||||||
| 2 |
|
|
|
|
|
|
||||||||||||||||||
| 3 |
|
|
|
|
|
|
||||||||||||||||||
| 4 |
|
|
|
|
|
|
||||||||||||||||||
| 5 |
|
|
|
|
|
|
||||||||||||||||||
| 10 |
|
|
|
|
|
|
||||||||||||||||||
| 20 |
|
|
|
|
|
|
||||||||||||||||||
| Note: 2084-324, 2 dedicated processors, 2 GB central, 2 GB XSTORE. 2105-F20, 16 GB cache, 2 FICON chpids. z/VM 5.2.0 + PAV SPE. ior is I/O rate (/sec). iost is I/O service time (msec). iort is I/O response time (msec). | ||||||||||||||||||||||||
| IO3390 4K 33% reads |
Suite L411 | Aliases per volume | ||||||||||||||||||||||
| Workers per volume |
Metric | 0 | 1 | 2 | 3 | 4 | ||||||||||||||||||
| 1 |
|
|
|
|
|
|
||||||||||||||||||
| 2 |
|
|
|
|
|
|
||||||||||||||||||
| 3 |
|
|
|
|
|
|
||||||||||||||||||
| 4 |
|
|
|
|
|
|
||||||||||||||||||
| 5 |
|
|
|
|
|
|
||||||||||||||||||
| 10 |
|
|
|
|
|
|
||||||||||||||||||
| 20 |
|
|
|
|
|
|
||||||||||||||||||
| Note: 2084-324, 2 dedicated processors, 2 GB central, 2 GB XSTORE. 2105-F20, 16 GB cache, 2 FICON chpids. z/VM 5.2.0 + PAV SPE. ior is I/O rate (/sec). iost is I/O service time (msec). iort is I/O response time (msec). | ||||||||||||||||||||||||
| IO3390 4K 66% reads |
Suite M411 | Aliases per volume | ||||||||||||||||||||||
| Workers per volume |
Metric | 0 | 1 | 2 | 3 | 4 | ||||||||||||||||||
| 1 |
|
|
|
|
|
|
||||||||||||||||||
| 2 |
|
|
|
|
|
|
||||||||||||||||||
| 3 |
|
|
|
|
|
|
||||||||||||||||||
| 4 |
|
|
|
|
|
|
||||||||||||||||||
| 5 |
|
|
|
|
|
|
||||||||||||||||||
| 10 |
|
|
|
|
|
|
||||||||||||||||||
| 20 |
|
|
|
|
|
|
||||||||||||||||||
| Note: 2084-324, 2 dedicated processors, 2 GB central, 2 GB XSTORE. 2105-F20, 16 GB cache, 2 FICON chpids. z/VM 5.2.0 + PAV SPE. ior is I/O rate (/sec). iost is I/O service time (msec). iort is I/O response time (msec). | ||||||||||||||||||||||||
| IO3390 4K 100% reads |
Suite N411 | Aliases per volume | ||||||||||||||||||||||
| Workers per volume |
Metric | 0 | 1 | 2 | 3 | 4 | ||||||||||||||||||
| 1 |
|
|
|
|
|
|
||||||||||||||||||
| 2 |
|
|
|
|
|
|
||||||||||||||||||
| 3 |
|
|
|
|
|
|
||||||||||||||||||
| 4 |
|
|
|
|
|
|
||||||||||||||||||
| 5 |
|
|
|
|
|
|
||||||||||||||||||
| 10 |
|
|
|
|
|
|
||||||||||||||||||
| 20 |
|
|
|
|
|
|
||||||||||||||||||
| Note: 2084-324, 2 dedicated processors, 2 GB central, 2 GB XSTORE. 2105-F20, 16 GB cache, 2 FICON chpids. z/VM 5.2.0 + PAV SPE. ior is I/O rate (/sec). iost is I/O service time (msec). iort is I/O response time (msec). | ||||||||||||||||||||||||
IBM TotalStorage DS8100 (2107)
| IO3390 4K 0% reads |
Suite O411 | Aliases per volume | ||||||||||||||||||||||
| Workers per volume |
Metric | 0 | 1 | 2 | 3 | 4 | ||||||||||||||||||
| 1 |
|
|
|
|
|
|
||||||||||||||||||
| 2 |
|
|
|
|
|
|
||||||||||||||||||
| 3 |
|
|
|
|
|
|
||||||||||||||||||
| 4 |
|
|
|
|
|
|
||||||||||||||||||
| 5 |
|
|
|
|
|
|
||||||||||||||||||
| 10 |
|
|
|
|
|
|
||||||||||||||||||
| 20 |
|
|
|
|
|
|
||||||||||||||||||
| Note: 2084-324, 2 dedicated processors, 2 GB central, 2 GB XSTORE. 2107-921, 32 GB cache, 4 FICON chpids. z/VM 5.2.0 + PAV SPE. ior is I/O rate (/sec). iost is I/O service time (msec). iort is I/O response time (msec). | ||||||||||||||||||||||||
| IO3390 4K 33% reads |
Suite P411 | Aliases per volume | ||||||||||||||||||||||
| Workers per volume |
Metric | 0 | 1 | 2 | 3 | 4 | ||||||||||||||||||
| 1 |
|
|
|
|
|
|
||||||||||||||||||
| 2 |
|
|
|
|
|
|
||||||||||||||||||
| 3 |
|
|
|
|
|
|
||||||||||||||||||
| 4 |
|
|
|
|
|
|
||||||||||||||||||
| 5 |
|
|
|
|
|
|
||||||||||||||||||
| 10 |
|
|
|
|
|
|
||||||||||||||||||
| 20 |
|
|
|
|
|
|
||||||||||||||||||
| Note: 2084-324, 2 dedicated processors, 2 GB central, 2 GB XSTORE. 2107-921, 32 GB cache, 4 FICON chpids. z/VM 5.2.0 + PAV SPE. ior is I/O rate (/sec). iost is I/O service time (msec). iort is I/O response time (msec). | ||||||||||||||||||||||||
| IO3390 4K 66% reads |
Suite Q411 | Aliases per volume | ||||||||||||||||||||||
| Workers per volume |
Metric | 0 | 1 | 2 | 3 | 4 | ||||||||||||||||||
| 1 |
|
|
|
|
|
|
||||||||||||||||||
| 2 |
|
|
|
|
|
|
||||||||||||||||||
| 3 |
|
|
|
|
|
|
||||||||||||||||||
| 4 |
|
|
|
|
|
|
||||||||||||||||||
| 5 |
|
|
|
|
|
|
||||||||||||||||||
| 10 |
|
|
|
|
|
|
||||||||||||||||||
| 20 |
|
|
|
|
|
|
||||||||||||||||||
| Note: 2084-324, 2 dedicated processors, 2 GB central, 2 GB XSTORE. 2107-921, 32 GB cache, 4 FICON chpids. z/VM 5.2.0 + PAV SPE. ior is I/O rate (/sec). iost is I/O service time (msec). iort is I/O response time (msec). | ||||||||||||||||||||||||
| IO3390 4K 100% reads |
Suite R411 | Aliases per volume | ||||||||||||||||||||||
| Workers per volume |
Metric | 0 | 1 | 2 | 3 | 4 | ||||||||||||||||||
| 1 |
|
|
|
|
|
|
||||||||||||||||||
| 2 |
|
|
|
|
|
|
||||||||||||||||||
| 3 |
|
|
|
|
|
|
||||||||||||||||||
| 4 |
|
|
|
|
|
|
||||||||||||||||||
| 5 |
|
|
|
|
|
|
||||||||||||||||||
| 10 |
|
|
|
|
|
|
||||||||||||||||||
| 20 |
|
|
|
|
|
|
||||||||||||||||||
| Note: 2084-324, 2 dedicated processors, 2 GB central, 2 GB XSTORE. 2107-921, 32 GB cache, 4 FICON chpids. z/VM 5.2.0 + PAV SPE. ior is I/O rate (/sec). iost is I/O service time (msec). iort is I/O response time (msec). | ||||||||||||||||||||||||
IBM TotalStorage DS6800 (1750)
| IO3390 4K 0% reads |
Suite S411 | Aliases per volume | ||||||||||||||||||||||
| Workers per volume |
Metric | 0 | 1 | 2 | 3 | 4 | ||||||||||||||||||
| 1 |
|
|
|
|
|
|
||||||||||||||||||
| 2 |
|
|
|
|
|
|
||||||||||||||||||
| 3 |
|
|
|
|
|
|
||||||||||||||||||
| 4 |
|
|
|
|
|
|
||||||||||||||||||
| 5 |
|
|
|
|
|
|
||||||||||||||||||
| 10 |
|
|
|
|
|
|
||||||||||||||||||
| 20 |
|
|
|
|
|
|
||||||||||||||||||
| Note: 2084-324, 2 dedicated processors, 2 GB central, 2 GB XSTORE. 1750-511, 4 GB cache, 2 FICON chpids. z/VM 5.2.0 + PAV SPE. ior is I/O rate (/sec). iost is I/O service time (msec). iort is I/O response time (msec). | ||||||||||||||||||||||||
| IO3390 4K 33% reads |
Suite T411 | Aliases per volume | ||||||||||||||||||||||
| Workers per volume |
Metric | 0 | 1 | 2 | 3 | 4 | ||||||||||||||||||
| 1 |
|
|
|
|
|
|
||||||||||||||||||
| 2 |
|
|
|
|
|
|
||||||||||||||||||
| 3 |
|
|
|
|
|
|
||||||||||||||||||
| 4 |
|
|
|
|
|
|
||||||||||||||||||
| 5 |
|
|
|
|
|
|
||||||||||||||||||
| 10 |
|
|
|
|
|
|
||||||||||||||||||
| 20 |
|
|
|
|
|
|
||||||||||||||||||
| Note: 2084-324, 2 dedicated processors, 2 GB central, 2 GB XSTORE. 1750-511, 4 GB cache, 2 FICON chpids. z/VM 5.2.0 + PAV SPE. ior is I/O rate (/sec). iost is I/O service time (msec). iort is I/O response time (msec). | ||||||||||||||||||||||||
| IO3390 4K 66% reads |
Suite U411 | Aliases per volume | ||||||||||||||||||||||
| Workers per volume |
Metric | 0 | 1 | 2 | 3 | 4 | ||||||||||||||||||
| 1 |
|
|
|
|
|
|
||||||||||||||||||
| 2 |
|
|
|
|
|
|
||||||||||||||||||
| 3 |
|
|
|
|
|
|
||||||||||||||||||
| 4 |
|
|
|
|
|
|
||||||||||||||||||
| 5 |
|
|
|
|
|
|
||||||||||||||||||
| 10 |
|
|
|
|
|
|
||||||||||||||||||
| 20 |
|
|
|
|
|
|
||||||||||||||||||
| Note: 2084-324, 2 dedicated processors, 2 GB central, 2 GB XSTORE. 1750-511, 4 GB cache, 2 FICON chpids. z/VM 5.2.0 + PAV SPE. ior is I/O rate (/sec). iost is I/O service time (msec). iort is I/O response time (msec). | ||||||||||||||||||||||||
| IO3390 4K 100% reads |
Suite V411 | Aliases per volume | ||||||||||||||||||||||
| Workers per volume |
Metric | 0 | 1 | 2 | 3 | 4 | ||||||||||||||||||
| 1 |
|
|
|
|
|
|
||||||||||||||||||
| 2 |
|
|
|
|
|
|
||||||||||||||||||
| 3 |
|
|
|
|
|
|
||||||||||||||||||
| 4 |
|
|
|
|
|
|
||||||||||||||||||
| 5 |
|
|
|
|
|
|
||||||||||||||||||
| 10 |
|
|
|
|
|
|
||||||||||||||||||
| 20 |
|
|
|
|
|
|
||||||||||||||||||
| Note: 2084-324, 2 dedicated processors, 2 GB central, 2 GB XSTORE. 1750-511, 4 GB cache, 2 FICON chpids. z/VM 5.2.0 + PAV SPE. ior is I/O rate (/sec). iost is I/O service time (msec). iort is I/O response time (msec). | ||||||||||||||||||||||||
Discussion
Expectations
In general, we expected that as we added aliases to a configuration, we would experience improvement in one or more I/O metrics, provided enough workload existed to exploit the aliases, and provided no other bottleneck limited the workload. For example, with only one IO3390 worker per volume, we would not expect adding aliases to help anything. However, as we increase IO3390 workers per volume, we would expect adding aliases to help matters, if the configuration is not otherwise limited. We also expected that adding aliases would help only up to the workload's ability to drive I/Os concurrently. For example, with only three workers per volume, we would not expect four exposures (one base plus three aliases) to perform better than three exposures.
We also expected that when the number of exposures was greater than or equal to the concurrency level, I/O response time would equal I/O service time. In other words, in such configurations, we expected device wait queues to disappear.
IBM ESS F20 (2105)
For the 2105, we saw that adding aliases did not appreciably change I/O rate or I/O response time. The 100%-read workloads were the exception to this. For those runs, we did notice that adding aliases did improve I/O rate and I/O response time. However, there was little improvement beyond adding one alias, that is, two or more aliases offered about the same performance as one alias.
We also noticed that as we added aliases to a workload, I/O service time increased. However, we almost always saw offsetting reductions in wait time, so I/O response time remained about flat. We believe this suggests that this workload drives the 2105 intensely enough that some bottleneck within it comes into play. Because adding aliases did not increase I/O rate or decrease I/O response time, we believe that by adding aliases, all we did was move the I/O queueing from z/VM to inside the 2105. To investigate our suspicion, we spot-checked the components of I/O service time (pending time, disconnect time, connect time) for some configurations. Generally we found that increases in I/O service time were due to increases in disconnect time. We believe this suggests queueing inside the 2105. We did not check every case, nor did we tabulate our findings.
IBM DS8100 (2107)
For the 2107, we saw that adding aliases definitely caused improvements in I/O rate and I/O response time. In some cases, the improvements were dramatic.
Like the 2105, we saw that for the 2107, adding aliases to a workload tended to increase I/O service time. However, for the 2107, the increase in service time was more than offset by a decrease in wait time, so I/O response time decreased. This was true in all but the most extreme workloads (100% writes or large numbers of users). In those extreme cases, we believe we hit a 2107 limit, just as we did in most of the 2105 runs.
IBM DS 6800 (1750)
The 1750, like the 2107, showed improvements in many workloads as we added aliases. However, the 1750 struggled with the 0%-read workload, and it did not do well with small numbers of users per volume. As workers per volume increased and as the fraction of reads increased, the effect of PAV became noticable and positive.
Conclusions
For the DS8100 and the DS6800, we can recommend PAV when the workload contains enough concurrency, especially for workloads that are not 100% writes. We expect customers to see decreases in I/O response time and increases in I/O rate per volume. Exact results will depend heavily on the customer's workload.
For the ESS F20, we can recommend PAV only when the customer's workload has a high read percentage. For low and moderate read percentages, neither I/O rate nor I/O response time improves as we add aliases.
Workloads that might benefit from adding PAV aliases are characterized by I/O response time being greater than I/O service time -- in other words, a wait queue forming. Customers considering adding PAV aliases can add an alias or two to volumes showing this trait. A second measurement will confirm whether I/O rate or I/O response time improved.
We do not recommend adding PAV aliases past the point where the wait queue disappears.
A guest that does its own I/O scheduling, such as Linux or z/OS, might be maintaining device wait queues on its own. Such queues would be invisible to z/VM and to performance management products that consider only CP real device I/O. If your analysis of what's happening inside your guest shows you that wait queues are forming inside your guest, you might consider exploring whether your guest can exploit PAV (sometimes we call this being PAV-aware). If it does, you can use the new z/VM minidisk PAV support to give your guest more than one virtual I/O device number for the minidisk on which the guest is doing its own queueing. We did not do any measurements of such configurations, but we would expect to see some queueing relief like what we observed in the configurations we measured.
Back to Table of Contents.
Additional Evaluations
This section includes results from additional z/VM and z/VM platform performance measurement evaluations that have been conducted during the z/VM 5.2.0 time frame.
Back to Table of Contents.
Linux Disk I/O Alternatives
Introduction
With z/VM 5.2.0, customers have a number of choices for the technology they use to perform disk I/O with Linux guest systems. In this chapter, we compare and contrast the performance of several alternatives for Linux disk I/O as a guest of z/VM. The purpose is to provide insight into the z/VM alternatives that may yield the best performance for Linux guest application workloads that include heavy disk I/O. This study does not explore Linux-specific alternatives.
The evaluated disk I/O choices are:
- Dedicated Extended Count Key Data (ECKD) on an ESS 2105-F20, via FICON channel
- Minidisks on ECKD on ESS 2105-F20, via FICON channel
- Dedicated emulated Fixed Block Architecture (FBA) on ESS 2105-F20, via Fibre Channel Protocol (FCP)
- Minidisks on emulated FBA on ESS 2105-F20, via FCP
- Linux-owned FCP subchannel to an ESS 2105-F20, via FCP
- Linux Diagnose X'250' Block I/O to minidisks on ECKD on ESS 2105-F20, via FICON channel
The Diagnose X'250' evaluation was done with an internal Diagnose driver for 64-bit Linux. This driver is not yet available in any Linux distributions. It is expected to be available in distributions sometime during 2006.
Absent from this study is an evaluation of Diagnose X'250' with emulated FBA DASD. The version of the internal Diagnose driver that we used has a kernel level dependency that is not met with SLES 9 SP 1. We expect to include this choice in future Linux disk I/O evaluations.
For this study, we used the Linux disk exerciser IOzone to measure disk performance a Linux guest experiences. We ran IOzone against the disk choices listed above. In the following sections we discuss the results of the experiments using these choices.
Method
To measure disk performance with Linux guests, we set up a single Linux guest running the IOzone disk exerciser with an 800 MB file. IOzone is a file system exercise tool. See our IOzone workload description for details about how we run IOzone.
For this experiment, we used the following configuration:
- 2084-324, two-way dedicated partition, 2 GB central storage, 2 GB expanded storage
- No activity in the partition being measured, except our Linux guest and the test case driver
- 2105-F20, 16 GB of cache, FICON and FCP attached
- z/VM 5.2.0 GA RSU
- One VM virtual machine, 192 MB virtual uniprocessor, running 64-bit Linux SLES 9 SP 1, Linux ext2 file systems
Notes:
- A 31-bit Linux SLES 9 SP 1 system was also used with the ECKD Diagnose X'250' cases. The results were very similar to the 64-bit Linux cases presented here.
- A virtual machine size of 192 MB was used to ensure that a significant portion of the 800 MB ballast file did not fit into Linux page cache. If the file does fit into the page cache, few if any disk I/Os will be done.
- Native SCSI allows more data to be moved in a single I/O request with the FCP subchannel than traditional ECKD, FBA, and Diagnose X'250'. With the large ballast file used in this study (800 MB), this creates an advantage for native SCSI over other disk I/O alternatives.
- The 2105-F20 had multiple FICON chpids attaching it to the 2084. The Linux guest had one FCP device attached to it, so it was not doing any nontrivial path selection activity. Note also that the IOzone workload we ran was serial and single-threaded.
This chapter compares disk I/O choices with Linux as a guest virtual machine on z/VM 5.2.0. To view performance comparisons from a regression perspective (z/VM 5.2.0 compared with z/VM 5.1.0), refer to the CP Disk I/O Performance chapter.
The disk configurations mentioned in this chapter (e.g., EDED, LNS0, and so on) are defined in detail in our IOzone workload description appendix. The configuration naming conventions used in the tables in this chapter include some key indicators that help the reader to decode the configuration without the need to refer to the appendix:
| Name prefix | Name suffix |
|---|---|
| E for ECKD with the Linux ECKD CCW driver. |
|
| F for emulated FBA on 2105-F20 with the Linux FBA CCW driver. |
|
| D2 for ECKD minidisk with the Linux Diagnose X'250' driver. |
|
| LNS0 for Linux owning an FCP subchannel and using the zFCP driver. | None. |
Summary of Results
While this study of performance shows native SCSI (Linux-owned FCP subchannel) is the best performing choice for Linux disk I/O, customers should also consider the challenges associated with managing the different disk I/O configurations as part of their system. This evaluation of Linux disk I/O alternatives as a z/VM guest system considers performance characteristics only. It is also important to keep in mind that this evaluation was done with FCP and FICON channels, which have comparable bandwidth characteristics. If ESCON channels had been used for the ECKD configuration, the throughput results would be significantly different.
The results of this study show that native SCSI outperforms all of the other choices evaluated in this experiment when considering reads and writes. It combines high levels of throughput with efficient use of CPU capacity. That said, there may be other I/O choices that provide favorable throughput and efficient use of CPU capacity based on the I/O characteristics of customer application workloads.
For application workloads that are predominantly read I/O with many rereads (for example, in cases where shared, read only DASD is used), there are other attractive choices. While the Linux-owned FCP subchannel is a good choice, there are other good choices when minidisk cache is exploited. ECKD minidisk, Diagnose X'250' ECKD minidisk (with block sizes of 2K or 4K), and emulated FBA on ESS 2105-F20 are all good choices with MDC ON. They all provide impressive throughput rates with efficient use of CPU capacity.
For application workloads that are predominantly write I/O, Linux-owned FCP subchannel is the best choice. It provides the best throughput rates with the most efficient use of CPU time. However, customers may want to consider other choices that yield improvements in throughput and use less CPU time when compared to the baseline dedicated ECKD case.
Customers should consider the characteristics of their environment when considering which disk I/O configuration to use for Linux guest systems on z/VM. Characteristics such as systems management and disaster recovery should be considered along with application workload characteristics.
Discussion of Results
For each configuration, the tables show the configuration values as a ratio scaled to the dedicated ECKD case. The tables are organized to show the KB per second ratio (KB/sec), total CPU time per KB ratio (Total CPU/KB), the VM Control Program CPU per KB ratio (CP CPU/KB), and the virtual CPU per KB ratio (Virtual CPU/KB). There are five tables in all included in this chapter. This allows us to compare the data rates and CPU consumptions for each of the four IOzone phases:
- Initial write phase
- Rewrite phase
- Initial Read phase
- Reread phase
The last table is a summary table that shows the average of the ratios that are shown in the four IOzone phases. For customers that have applications that result in a mixture of writes and reads where the percentage of each is similar or the percentages have not been determined, this table can be valuable as a summary of overall performance. For customers with applications that are heavily skewed to read or write I/O operations, the other four tables will provide valuable insight as to the best choices and acceptable alternatives.
IOzone Initial Write Results
|
IOzone Initial Write Results (scaled to EDED) |
||||
| Configuration | KB/sec | Total CPU/KB | CP CPU/KB | Virtual CPU/KB |
| ECKD ccw | ||||
| EDED | 1.00 | 1.00 | 1.00 | 1.00 |
| EMD0 | 1.12 | 0.996 | 0.946 | 1.00 |
| EMD1 | 1.12 | 0.989 | 0.961 | 0.993 |
| ECKD Diag X'250' (64-bit) | ||||
| D210 | 0.245 | 1.27 | 2.89 | 1.06 |
| D211 | 0.452 | 1.18 | 2.38 | 1.03 |
| D220 | 0.354 | 1.10 | 1.68 | 1.02 |
| D221 | 0.800 | 1.04 | 1.30 | 1.00 |
| D240 | 0.467 | 1.03 | 1.16 | 1.02 |
| D241 | 0.965 | 0.969 | 0.866 | 0.982 |
| EFBA ccw (2105-F20) | ||||
| FDED | 1.24 | 1.57 | 5.44 | 1.06 |
| FMD0 | 1.24 | 1.58 | 5.46 | 1.07 |
| FMD1 | 1.24 | 1.57 | 5.45 | 1.06 |
| Dedicated FCP (2105-F20) | ||||
| LNS0 | 1.54 | 0.952 | 0.674 | 0.988 |
| Notes: 2084-324. Two-way dedicated partition. 2 GB central. 2 GB XSTORE. 2105-F20 16 GB FICON/FCP. z/VM 5.2.0 GA RSU + VM63893. Linux SLES 9 SP 1, 192 MB virtual uniprocessor. | ||||
The IOzone initial write results show that the native SCSI case (Linux-owned FCP subchannel) is the best performer. It provides a 54% improvement in throughput over the benchmark dedicated ECKD case and a savings of 4.8% in total CPU time per KB moved.
The ECKD Diagnose X'250' cases show that throughput is the best at the 4K block size.
The emulated FBA cases on the 2105-F20 show much higher CPU time per transaction to achieve their throughput. Much of this can be attributed to the additional processing required in the VM Control Program to emulate FBA.
IOzone Rewrite Results
|
IOzone Rewrite Results (scaled to EDED) |
||||
| Configuration | KB/sec | Total CPU/KB | CP CPU/KB | Virtual CPU/KB |
| ECKD ccw | ||||
| EDED | 1.00 | 1.00 | 1.00 | 1.00 |
| EMD0 | 1.08 | 0.992 | 1.01 | 0.989 |
| EMD1 | 1.09 | 0.986 | 0.960 | 0.991 |
| ECKD Diag X'250' (64-bit) | ||||
| D210 | 0.454 | 1.27 | 2.37 | 1.05 |
| D211 | 0.448 | 1.29 | 2.50 | 1.05 |
| D220 | 0.787 | 1.07 | 1.29 | 1.03 |
| D221 | 0.781 | 1.08 | 1.43 | 1.02 |
| D240 | 1.10 | 0.946 | 0.799 | 0.975 |
| D241 | 1.08 | 0.961 | 0.868 | 0.979 |
| EFBA ccw (2105-F20) | ||||
| FDED | 1.23 | 1.93 | 6.12 | 1.12 |
| FMD0 | 1.23 | 1.95 | 6.11 | 1.14 |
| FMD1 | 1.22 | 1.93 | 6.06 | 1.13 |
| Dedicated FCP (2105-F20) | ||||
| LNS0 | 1.46 | 0.915 | 0.628 | 0.971 |
| Notes: 2084-324. Two-way dedicated partition. 2 GB central. 2 GB XSTORE. 2105-F20 16 GB FICON/FCP. z/VM 5.2.0 GA RSU + VM63893. Linux SLES 9 SP 1, 192 MB virtual uniprocessor. | ||||
For the rewrite phase, we see similar results to the write phase.
IOzone Initial Read Results
|
IOzone Initial Read Results (scaled to EDED) |
||||
| Configuration | KB/sec | Total CPU/KB | CP CPU/KB | Virtual CPU/KB |
| ECKD ccw | ||||
| EDED | 1.00 | 1.00 | 1.00 | 1.00 |
| EMD0 | 1.00 | 0.998 | 0.997 | 0.998 |
| EMD1 | 0.539 | 1.34 | 2.65 | 1.02 |
| ECKD Diag X'250' (64-bit) | ||||
| D210 | 0.380 | 1.34 | 2.38 | 1.08 |
| D211 | 0.206 | 1.72 | 4.85 | 0.946 |
| D220 | 0.656 | 1.08 | 1.36 | 1.01 |
| D221 | 0.357 | 1.49 | 4.09 | 0.846 |
| D240 | 0.976 | 0.905 | 0.711 | 0.954 |
| D241 | 0.546 | 1.36 | 2.76 | 1.01 |
| EFBA ccw (2105-F20) | ||||
| FDED | 0.950 | 2.31 | 6.73 | 1.21 |
| FMD0 | 0.950 | 2.29 | 6.60 | 1.21 |
| FMD1 | 0.771 | 2.64 | 9.17 | 1.01 |
| Dedicated FCP (2105-F20) | ||||
| LNS0 | 1.64 | 0.852 | 0.515 | 0.936 |
| Notes: 2084-324. Two-way dedicated partition. 2 GB central. 2 GB XSTORE. 2105-F20 16 GB FICON/FCP. z/VM 5.2.0 GA RSU + VM63893. Linux SLES 9 SP 1, 192 MB virtual uniprocessor. | ||||
For the initial read phase, the native SCSI case (Linux-owned FCP subchannel) is the best performer once again. It provides a 64% improvement in throughput over the baseline dedicated ECKD case, along with a 14.8% savings in total CPU time per KB moved.
The ECKD minidisk cases illustrate the cost in throughput and CPU time per transaction when MDC is ON. Comparing the EMD0 and EMD1 runs, there is a 46% loss in throughput and a 34% increase in total CPU time per KB moved with MDC ON. These costs are the result of populating the minidisk cache. When we look at the reread phase, we should find that there is a significant benefit with MDC ON as the read is done from the cache (i.e., no I/O is performed from the disk).
The ECKD Diagnose X'250' cases show a similar trend to the write and rewrite phases in terms of block size. The 4K block size results in the best throughput. Comparing the 4K block size cases (D240 and D241), we find a similar trend to the ECKD minidisk runs related to MDC. The cost of MDC ON is paid in terms of throughput and CPU time per transaction. As mentioned above in the ECKD minidisk discussion, we should find that there is a significant benefit with MDC ON in the reread phase.
The emulated FBA cases on the 2105-F20 show much higher CPU time per transaction, as is the case in the write and rewrite phases. A difference in the read phase is that the throughput in 2105-F20 cases is less than the dedicated ECKD baseline case. In the write and rewrite phases we saw that there was a significant increase in throughput at the cost of high CPU time per transaction.
IOzone Reread Results
|
IOzone Reread Results (scaled to EDED) |
||||
| Configuration | KB/sec | Total CPU/KB | CP CPU/KB | Virtual CPU/KB |
| ECKD ccw | ||||
| EDED | 1.00 | 1.00 | 1.00 | 1.00 |
| EMD0 | 0.999 | 1.03 | 1.03 | 1.03 |
| EMD1 | 10.9 | 0.783 | 1.09 | 0.706 |
| ECKD Diag X'250' (64-bit) | ||||
| D210 | 0.380 | 1.35 | 2.37 | 1.09 |
| D211 | 9.49 | 0.929 | 2.29 | 0.588 |
| D220 | 0.656 | 1.10 | 1.29 | 1.05 |
| D221 | 10.2 | 0.929 | 2.25 | 0.598 |
| D240 | 0.975 | 0.973 | 0.785 | 1.02 |
| D241 | 11.0 | 0.642 | 0.918 | 0.573 |
| EFBA ccw (2105-F20) | ||||
| FDED | 0.947 | 2.35 | 6.78 | 1.25 |
| FMD0 | 0.948 | 2.35 | 6.78 | 1.24 |
| FMD1 | 9.07 | 0.901 | 2.20 | 0.576 |
| Dedicated FCP (2105-F20) | ||||
| LNS0 | 1.64 | 0.951 | 0.609 | 1.04 |
| Notes: 2084-324. Two-way dedicated partition. 2 GB central. 2 GB XSTORE. 2105-F20 16 GB FICON/FCP. z/VM 5.2.0 GA RSU + VM63893. Linux SLES 9 SP 1, 192 MB virtual uniprocessor. | ||||
For the reread phase, the native SCSI case (Linux-owned FCP subchannel) is the best performer as it is in the other three phases (write, rewrite, and read phases). It provides a 64% improvement in throughput over the baseline dedicated ECKD case, along with a 4.9% savings in total CPU time per KB moved.
As expected, the ECKD minidisk case with MDC ON yields a very large benefit in throughput and a significant savings in CPU time per KB moved of 21.7%. As discussed in the read phase, this benefit is achieved because the reread phase performs the reread using the minidisk cache, so there is no I/O performed with the disk. The benefit of MDC is even more substantial when you consider z/VM environments with multiple Linux guest systems sharing read only minidisks as part of their application workload. Please note, however, that in cases where the Linux page cache is made large enough to achieve a high hit ratio, you should consider turning off MDC because it is redundant.
The ECKD Diagnose X'250' cases with MDC ON all show large improvements in throughput ratios, similar to what we see with the ECKD minidisk cases, along with significant savings in CPU time per transaction. As in the other three IOzone phases, ECKD Diagnose X'250' shows the most benefit using a block size of 4K. In this case, the throughput is improved by 1000%, and the total CPU time per KB moved is reduced by 35.8% over the baseline dedicated ECKD case. For the MDC OFF cases, the 4K block size case yields the best throughput.
The emulated FBA cases on the 2105-F20 show much higher CPU time per transaction as is the case in the write and rewrite phases, with one exception. The emulated FBA case for the 2105-F20 with MDC ON shows a reduction in total CPU time of 9.9% along with more than 800% increase in throughput. All other cases have a very high CPU time per transaction.
Overall IOzone Results
|
IOzone Overall Results (scaled to EDED) |
||||
| Configuration | KB/sec | Total CPU/KB | CP CPU/KB | Virtual CPU/KB |
| ECKD ccw | ||||
| EDED | 1.00 | 1.00 | 1.00 | 1.00 |
| EMD0 | 1.06 | 1.00 | 0.994 | 1.00 |
| EMD1 | 1.07 | 1.02 | 1.40 | 0.944 |
| ECKD Diag X'250' (64-bit) | ||||
| D210 | 0.337 | 1.30 | 2.51 | 1.07 |
| D211 | 0.432 | 1.27 | 2.99 | 0.938 |
| D220 | 0.535 | 1.09 | 1.41 | 1.03 |
| D221 | 0.752 | 1.12 | 2.24 | 0.903 |
| D240 | 0.739 | 0.975 | 0.871 | 0.995 |
| D241 | 1.03 | 0.980 | 1.34 | 0.911 |
| EFBA ccw (2105-F20) | ||||
| FDED | 1.12 | 1.95 | 6.25 | 1.14 |
| FMD0 | 1.12 | 1.95 | 6.22 | 1.14 |
| FMD1 | 1.29 | 1.74 | 5.72 | 0.979 |
| Dedicated FCP (2105-F20) | ||||
| LNS0 | 1.55 | 0.923 | 0.608 | 0.983 |
| Notes: 2084-324. Two-way dedicated partition. 2 GB central. 2 GB XSTORE. 2105-F20 16 GB FICON/FCP. z/VM 5.2.0 GA RSU + VM63893. Linux SLES 9 SP 1, 192 MB virtual uniprocessor. | ||||
The overall IOzone results table summarizes the performance of disk I/O choices across all four IOzone phases (initial write, rewrite, initial read, reread). This table characterizes the performance that can be expected for each choice for customers that have workloads that are not predominantly write or predominantly read.
As in the four phase discussions, the native SCSI case (Linux-owned FCP subchannel) is the clear winner. It outperforms all other choices with a 55% improvement in throughput, with a 7.7% savings in total CPU time per KB moved in comparison to the dedicated ECKD baseline case.
The ECKD minidisk cases show an increase in throughput over the dedicated ECKD case with little change in CPU cost.
The ECKD Diagnose X'250' cases show that throughput is best at the 4K block size. Minidisk cache (MDC) ON shows some improvement over MDC OFF in both throughput and total CPU time.
The emulated FBA cases on the 2105-F20 show very high CPU time per transaction to achieve their throughput.
Back to Table of Contents.
Dedicated OSA vs. VSWITCH
There are several connectivity options available for Linux guests running under z/VM. Two of them are direct connection to OSA and virtual switch. There are advantages to each choice. This section will show a comparison of key measurement points and list some of the reasons for choosing one over the other.
The Application Workload Modeler (AWM) product was used to drive request-response (RR) and streaming (STR) workloads over OSA cards directly attached to the Linux guests and over a virtual switch. The RR workoad consisted of the client sending 200 bytes to the server and the server responding with 1000 bytes. This interaction was repeated for 200 seconds. The STR workload consisted of the client sending 20 bytes to the server and the server responding with 20MB. This sequence was repeated for 400 seconds.
These workloads were run for both link layer (Layer 2) and IP layer (Layer 3) transport modes. Both Linux and virtual switch require specific configuration options which determine whether Layer 2 or Layer 3 is in effect.
A complete set of runs, consisting of 3 trials for each case, for 1, 10 and 50 client-server pairs, was done with the maximum transmission unit (MTU) set to 1492 (for RR and STR) and 8992 (for STR only).
The measurements were done on a 2084-324 with 2 dedicated processors in each LPAR used. Connectivity between the two LPARs was over an OSA-Express2 1GbE card. The OSA level was 0016. The software used includes:
- z/VM 5.2.0
- TCP/IP 5.2.0
- Linux SuSe SLES8 kernel levels 2.4.21-251 with qeth module dated 20041104
Figure 1. Virtual Switch Environment
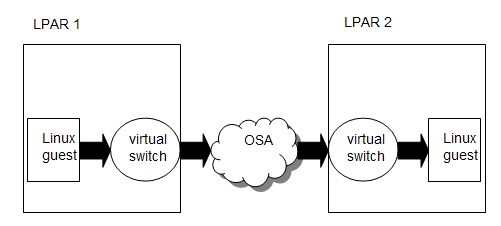
|
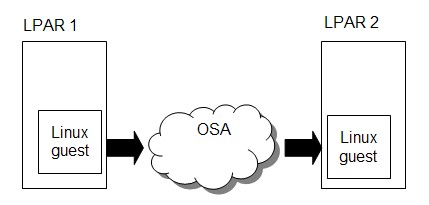
|
The server Linux guest ran in LPAR 2 and the client Linux guest ran in LPAR 1. 1, 10 or 50 sessions ran in the Linux guest for each measurement. Each LPAR had 2GB of central storage and 2GB expanded storage. CP monitor data was captured for one LPAR (client side) during the measurement and reduced using Performance Toolkit for VM (Perfkit).
The following tables compare the average of 3 trials for each measurement between virtual switch and OSA for Layer3 and for Layer2. The % diff numbers shown are the percent increase (or decrease) comparing OSA to the virtual switch. For example, if the number is positive, OSA was that percent greater than virtual switch. Note that the workloads used for these measurements are atomic in nature.
In general, OSA directly connected to the Linux guest gets higher throughput and uses less CPU time than when a Linux guest is connected through a virtual switch. However, this must be balanced against advantages gained using the virtual switch, such as:
- ease of network design
- ability to share network resources (OSA card)
- management of the network including security and capabilites available to the z/VM guest on the LAN
- less storage required below z/VM's 2G line (prior to z/VM 5.2.0)
- layer 3 bridge
- less overhead than using a router stack
| Case | Layer3 | Layer3 | Layer3 | Layer2 | Layer2 | Layer2 |
| Number of clients | 01 | 10 | 50 | 01 | 10 | 50 |
| VSwitch | ||||||
| runid | vl4rn013 | vl4rn101 | vl4rn503 | vl5rn013 | vl5rn102 | vl5rn502 |
| trans/sec | 2127.32 | 13823.21 | 31914.04 | 2184.09 | 14335.22 | 32523.27 |
| Total CPU msec/trans | 0.065 | 0.043 | 0.034 | 0.063 | 0.043 | 0.034 |
| Emul CPU msec/trans | 0.026 | 0.022 | 0.020 | 0.025 | 0.022 | 0.020 |
| CP CPU msec/trans | 0.039 | 0.021 | 0.014 | 0.038 | 0.021 | 0.014 |
| OSA | ||||||
| runid | lorn0101 | lorn1001 | lorn5003 | lorn0101 | lorn1002 | lorn5003 |
| trans/sec | 2539.11 | 14341.54 | 31966.42 | 2568.81 | 14681.64 | 32793.54 |
| Total CPU msec/trans | 0.0559 | 0.0347 | 0.0245 | 0.0561 | 0.0347 | 0.0243 |
| Emul CPU msec/trans | 0.0244 | 0.0205 | 0.0187 | 0.0241 | 0.0204 | 0.0185 |
| CP CPU msec/trans | 0.0315 | 0.0142 | 0.0058 | 0.0320 | 0.0143 | 0.0058 |
| % diff | ||||||
| trans/sec | 19% | 4% | 0% | 18% | 2% | 1% |
| Total CPU msec/trans | -14% | -19% | -28% | -11% | -19% | -28% |
| Emul CPU msec/trans | -4% | -7% | -6% | -4% | -7% | -7% |
| CP CPU msec/trans | -21% | -32% | -59% | -16% | -32% | -59% |
| 2084-324; z/VM 5.2.0; TCP/IP 520; Linux SLES8 | ||||||
Throughput is higher for OSA and it takes less CPU time per transaction.
| Case | Layer3 | Layer3 | Layer3 | Layer2 | Layer2 | Layer2 |
| Number of clients | 01 | 10 | 50 | 01 | 10 | 50 |
| VSwitch | ||||||
| runid | vl4sn013 | vl4sn102 | vl4sn503 | vl5sn012 | vl5sn101 | vl5sn501 |
| MB/sec | 44.6 | 92.5 | 93.3 | 44.8 | 91.3 | 92.4 |
| Total CPU msec/MB | 7.13 | 6.98 | 6.95 | 6.97 | 6.78 | 6.80 |
| Emul CPU msec/MB | 3.27 | 3.37 | 3.39 | 3.35 | 3.43 | 3.44 |
| CP CPU msec/MB | 3.86 | 3.61 | 3.56 | 3.62 | 3.36 | 3.36 |
| OSA | ||||||
| runid | losn0102 | losn1002 | losn5001 | losn0101 | losn1001 | losn5001 |
| MB/sec | 54.5 | 112.0 | 112.0 | 54.6 | 112.0 | 112.0 |
| Total CPU msec/MB | 5.58 | 4.82 | 4.79 | 5.64 | 4.93 | 4.98 |
| Emul CPU msec/MB | 3.52 | 3.71 | 3.68 | 3.59 | 3.79 | 3.84 |
| CP CPU msec/MB | 2.06 | 1.11 | 1.11 | 2.05 | 1.14 | 1.14 |
| % diff | ||||||
| MB/sec | 22% | 21% | 20% | 22% | 23% | 21% |
| Total CPU msec/MB | -22% | -30% | -21% | -19% | -27% | -16% |
| Emul CPU msec/MB | 7% | 10% | 27% | 8% | 10% | 30% |
| CP CPU msec/MB | -47% | -69% | -68% | -43% | -66% | -65% |
| 2084-324; z/VM 5.2.0; TCP/IP 520; Linux SLES8 | ||||||
The same is true for the streaming case. Throughput is higher and CPU time per MB is less.
| Case | Layer3 | Layer3 | Layer3 | Layer2 | Layer2 | Layer2 |
| Number of clients | 01 | 10 | 50 | 01 | 10 | 50 |
| VSwitch | ||||||
| runid | vl4sj013 | vl4sj102 | vl4sj503 | vl5sj012 | vl5sj101 | vl5sj501 |
| MB/sec | 36.4 | 118.0 | 118.0 | 36.7 | 118.0 | 118.0 |
| Total CPU msec/MB | 4.18 | 4.24 | 4.56 | 3.92 | 4.10 | 4.37 |
| Emul CPU msec/MB | 1.54 | 1.75 | 1.85 | 1.53 | 1.75 | 1.80 |
| CP CPU msec/MB | 2.64 | 2.49 | 2.71 | 2.40 | 2.36 | 2.58 |
| OSA | ||||||
| runid | losj0102 | losj1002 | losj5001 | losn0102 | losn1001 | losn5001 |
| MB/sec | 64.7 | 118.0 | 118.0 | 67.3 | 118.0 | 118.0 |
| Total CPU msec/MB | 4.70 | 4.20 | 4.31 | 4.87 | 4.48 | 4.54 |
| Emul CPU msec/MB | 2.13 | 2.10 | 2.22 | 2.20 | 2.17 | 2.25 |
| CP CPU msec/MB | 2.57 | 2.10 | 2.09 | 2.68 | 2.31 | 2.29 |
| % diff | ||||||
| MB/sec | 78% | 0% | 0% | 83% | 0% | 0% |
| Total CPU msec/MB | 12% | -1% | -8% | 23% | 9% | 4% |
| Emul CPU msec/MB | 35% | 20% | 17% | 43% | 25% | 26% |
| CP CPU msec/MB | -1% | -16% | -25% | 10% | -3% | -11% |
| 2084-324; z/VM 5.2.0; TCP/IP 520; Linux SLES8 | ||||||
Except for the single client-server case, throughput is essentially the same for OSA and virtual switch when MTU is 8992. Overall, CPU time is higher for OSA. Emulation time increased for the Linux guest when connected directly to OSA, offsetting the higher CP time when going through a virtual switch. It should be noted that our throughput is limited by the OSA card when we reach 118 MB/sec.
Back to Table of Contents.
Layer 3 and Layer 2 Comparisons
In addition to the measurements described in the z/VM 5.1.0 report section Virtual Switch Layer 2 Support, similar measurements were also done for:
- Virtual switch on z/VM 5.2.0
- Linux directly attached to an OSA-Express2 1 Gigabit Ethernet (GbE) card
- Linux directly attached to an OSA-Express2 10 GbE card
The 10 GbE information is provided in cooperation with IBM's STG OSA Performance Analysis & Measurement teams.
The Application Workload Modeler (AWM) product was used to drive request-response (RR) and streaming (STR) workloads with IPv4 layer 3 and layer 2. Refer to AWM workload for a description of the workload used for the virtual switch and for the 1 GbE (real QDIO) measurements. The workload for the 10 GbE measurement was the same with the exception of the duration and the number of client-server pairs. For this measurement the requests were repeated for 600 seconds.
CP monitor data was captured for the LPAR and reduced using Performance Toolkit for VM. The results shown here are for the client side only. The following table shows any differences in the environments for the three measurements discussed here.
Table 1. Environment Differences
| Measurement | z/VM | processor | # of real | # of virt | # of |
|---|---|---|---|---|---|
| level | type | CPUs | CPUs | LPARs | |
| Virtual Switch 1 GbE | 5.2.0 | 2084-324 | 2 | 1 | 2 |
| Direct OSA 1 GbE | 5.2.0 | 2084-324 | 2 | 1 | 2 |
| Direct OSA 10 GbE | 5.1.0 | 2084-B16 | 8 | 3 | 1 |
In general, Layer 2 has higher throughput (between 0.2% and 4.0%) than Layer 3. When using virtual switch, CPU time is less for Layer 2 (between -4.7% and 0%). When going directly through OSA, CPU time for Layer 2 was between -0.6% and 7.3% compared to Layer 3 for the 1 GbE card. For the 10 GbE card, Layer 2 throughput was between 0% and 10% higher than Layer 3, and CPU time was between −75% and 1%. Results can vary based on the level of z/VM, the OSA card, and the workload.
For virtual switch, Layer 2 performance improved dramatically on z/VM 5.2.0 relative to z/VM 5.1.0 (throughput increased between 2.2% and 54.8% and CPU time decreased between -3.1% and -30.1%) while Layer 3 performance was essentially unchanged. As a result, the relative performance of Layer 2 and Layer 3 changed significantly. This was not the case when going directly to OSA because both Layer 2 and Layer 3 showed little change in performance when going from z/VM 5.1.0 to z/VM 5.2.0.
The following three tables are included for background information. They show a comparison between z/VM 5.1.0 and z/VM 5.2.0 for both Layer 2 and Layer 3 for all three virtual switch workloads. This information is then used to better understand changes in results when comparing Layer 2 and Layer 3. Improvements in z/VM 5.2.0 for guest LAN, mentioned in CP Regression Measurements, are apparent in the results. Note that measurements going directly to OSA are not affected much by going to z/VM 5.2.0 since guest LAN is not involved.
Table 2. VSwitch base - 1 GbE - RR - 1492
| Layer 3 | |||
| Number of clients | 01 | 10 | 50 |
| %diff 5.1.0 to 5.2.0 | |||
| trans/sec | -3.8% | -2.4% | -0.1% |
| Total CPU msec/trans | 3.2% | 2.4% | 0.0% |
| Emul CPU msec/trans | 0.0% | 0.0% | 0.0% |
| CP CPU msec/trans | 5.3% | 5.0% | 0.0% |
| Layer 2 | |||
| Number of clients | 01 | 10 | 50 |
| %diff 5.1.0 to 5.2.0 | |||
| trans/sec | 54.8% | 31.7% | 25.4% |
| Total CPU msec/trans | -3.1% | -6.5% | -5.6% |
| Emul CPU msec/trans | -7.4% | -4.3% | -4.8% |
| CP CPU msec/trans | 0.0% | -8.7% | -6.7% |
| 2084-324; Linux SLES8; 2 LPARs; 2 CPUs each; 1 virtual CPU | |||
Table 3. VSwitch Base - 1 GbE - STR - 1492
| Layer 3 | |||
| Number of clients | 01 | 10 | 50 |
| %diff 5.1.0 to 5.2.0 | |||
| MB/sec | -0.7% | 0.3% | -0.2% |
| Total CPU msec/MB | 0.7% | 0.3% | 2.8% |
| Emul CPU msec/MB | 0.7% | -0.9% | 1.5% |
| CP CPU msec/MB | 0.7% | 1.5% | 4.0% |
| Layer 2 | |||
| Number of clients | 01 | 10 | 50 |
| %diff 5.1.0 to 5.2.0 | |||
| MB/sec | 4.4% | 28.1% | 3.0% |
| Total CPU msec/MB | -28.9% | -18.0% | -13.6% |
| Emul CPU msec/MB | -21.1% | -15.5% | -11.7% |
| CP CPU msec/MB | -34.8% | -20.3% | -15.5% |
| 2084-324; Linux SLES8; 2 LPARS; 2 CPUs each; 1 virtual CPU | |||
Table 4. VSwitch base - 1 GbE - STR - 8992
| Layer 3 | |||
| Number of clients | 01 | 10 | 50 |
| %diff 5.1.0 to 5.2.0 | |||
| MB/sec | 0.3% | 0.0% | 0.0% |
| Total CPU msec/MB | -3.5% | 2.0% | 8.7% |
| Emul CPU msec/MB | -14.5% | -12.6% | -9.8% |
| CP CPU msec/MB | 4.7% | 15.8% | 26.0% |
| Layer 2 | |||
| Number of clients | 01 | 10 | 50 |
| %diff 5.1.0 to 5.2.0 | |||
| MB/sec | 18.4% | 6.2% | 2.2% |
| Total CPU msec/MB | -30.7% | -13.0% | -9.4% |
| Emul CPU msec/MB | -32.4% | -17.8% | -16.9% |
| CP CPU msec/MB | -29.6% | -9.1% | -3.4% |
| 2084-324; Linux SLES8; 2 LPARS; 2 CPUs each; 1 virtual CPU | |||
The following tables compare each measurement using layer 3 against the same measurement using layer 2. The table includes a percentage difference section which shows the percent increase (or decrease) for layer 2.
Table 5. VSwitch - 1 GbE - RR - 1492
| Number of clients | 01 | 10 | 50 |
| runid (layer3) | vl4rn012 | vl4rn101 | vl4rn503 |
| trans/sec | 2124.07 | 13823.21 | 31914.04 |
| Total CPU msec/trans | 0.065 | 0.043 | 0.034 |
| Emul CPU msec/trans | 0.025 | 0.022 | 0.020 |
| CP CPU msec/trans | 0.040 | 0.021 | 0.014 |
| runid (layer2) | vl5rn012 | vl5rn101 | vl5rn503 |
| trans/sec | 2183.77 | 14336.50 | 32521.90 |
| Total CPU msec/trans | 0.063 | 0.043 | 0.034 |
| Emul CPU msec/trans | 0.025 | 0.022 | 0.020 |
| CP CPU msec/trans | 0.038 | 0.021 | 0.014 |
| z/VM 5.2.0 | |||
| %diff layer3 to layer2 | |||
| trans/sec | 2.8% | 3.7% | 1.9% |
| Total CPU msec/trans | -3.1% | 0.0% | 0.0% |
| Emul CPU msec/trans | 0.0% | 0.0% | 0.0% |
| CP CPU msec/trans | -5.0% | 0.0% | 0.0% |
| z/VM 5.1.0 | |||
| %diff layer3 to layer2 | |||
| trans/sec | -35.9% | -23.2% | -19.0% |
| Total CPU msec/trans | 3.2% | 9.5% | 4.9% |
| Emul CPU msec/trans | 8.0% | 4.5% | 5.0% |
| CP CPU msec/trans | 0.0% | 15.0% | 4.8% |
| 2084-324; Linux SLES8; 2 LPARS; 2 CPUs each; 1 virtual CPU | |||
When traffic goes through a virtual switch to the 1 GbE card, layer 2 gets higher throughput. CPU time is the same except for the one client-server pair where layer 2 uses less CPU time. Notice the marked improvement for layer 2 when using z/VM 5.2.0 over z/VM 5.1.0. This is true for this workload and for both streaming workloads that follow.
Table 6. VSwitch - 1 GbE - STR - 1492
| Number of clients | 01 | 10 | 50 |
| runid (layer 3) | vl4sn013 | vl4sn103 | vl4sn502 |
| MB/sec | 44.6 | 92.4 | 93.3 |
| Total CPU msec/MB | 7.13 | 6.93 | 6.95 |
| Emul CPU msec/MB | 3.27 | 3.38 | 3.39 |
| CP CPU msec/MB | 3.86 | 3.55 | 3.56 |
| runid (layer2 ) | vl5sn013 | vl5sn103 | vl5sn502 |
| MB/sec | 44.8 | 91.3 | 92.2 |
| Total CPU msec/MB | 6.96 | 6.86 | 6.88 |
| Emul CPU msec/MB | 3.35 | 3.48 | 3.51 |
| CP CPU msec/MB | 3.62 | 3.37 | 3.36 |
| z/VM 5.2.0 | |||
| %diff layer3 to layer2 | |||
| MB/sec | 0.4% | -1.2% | -1.2% |
| Total CPU msec/MB | -2.3% | -1.0% | -1.0% |
| Emul CPU msec/MB | 2.3% | 3.1% | 3.7% |
| CP CPU msec/MB | -6.2% | -4.9% | -5.5% |
| z/VM 5.1.0 | |||
| %diff layer3 to layer2 | |||
| MB/sec | -4.5% | -22.6% | -4.3% |
| Total CPU msec/MB | 38.2% | 21.0% | 17.7% |
| Emul CPU msec/MB | 30.4% | 20.9% | 19.2% |
| CP CPU msec/MB | 44.9% | 21.1% | 16.2% |
| 2084-324; Linux SLES8; 2 LPARS; 2 CPUs each; 1 virtual CPU | |||
In the virtual switch environment, the STR workload gets slightly less throughput and uses slightly less CPU msec/MB when using layer 2.
Table 7. VSwitch - 1 GbE - STR - 8992
| Number of clients | 01 | 10 | 50 |
| runid (layer3) | vl4sj011 | vl4sj103 | vl4sj502 |
| MB/sec | 36.4 | 118.0 | 118.0 |
| Total CPU msec/MB | 4.18 | 4.25 | 4.68 |
| Emul CPU msec/MB | 1.59 | 1.76 | 1.88 |
| CP CPU msec/MB | 2.58 | 2.49 | 2.80 |
| runid (layer2) | vl5sj011 | vl5sj103 | vl5sj502 |
| MB/sec | 36.7 | 118.0 | 118.0 |
| Total CPU msec/MB | 3.98 | 4.12 | 4.39 |
| Emul CPU msec/MB | 1.53 | 1.75 | 1.81 |
| CP CPU msec/MB | 2.45 | 2.37 | 2.58 |
| z/VM 5.2.0 | |||
| %diff layer3 to layer2 | |||
| MB/sec | 0.8% | 0.0% | 0.0% |
| Total CPU msec/MB | -4.7% | -3.2% | -6.2% |
| Emul CPU msec/MB | -4.2% | -1.0% | -3.6% |
| CP CPU msec/MB | -5.1% | -4.7% | -7.9% |
| z/VM 5.1.0 | |||
| %diff layer3 to layer2 | |||
| MB/sec | -15.2% | -5.8% | -2.1% |
| Total CPU msec/MB | 35.1% | 13.6% | 14.1% |
| Emul CPU msec/MB | 23.8% | 4.7% | 5.8% |
| CP CPU msec/MB | 43.6% | 21.8% | 22.0% |
| 2084-324; Linux SLES8; 2 LPARS; 2 CPUs each; 1 virtual CPU | |||
When the large MTU size is used, throughput is the same for layer 2 and layer 3, and CPU msec/MB is less for layer 2.
Table 8. OSA - 1 GbE - RR - 1492
| Number of clients | 01 | 10 | 50 |
| run ID (layer 3) | lorn0102 | lorn1002 | lorn5001 |
| trans/sec | 2538.62 | 14340.35 | 31996.02 |
| Total CPU msec/trans | .0559 | .0349 | .0244 |
| Emul CPU msec/trans | .0244 | .0206 | .0187 |
| CP CPU msec/trans | .0315 | .0143 | .0057 |
| run ID (layer 2) | lorn0102 | lorn1002 | lorn5001 |
| trans/sec | 2567.58 | 14681.64 | 32797.35 |
| Total CPU msec/trans | .0561 | .0347 | .0245 |
| Emul CPU msec/trans | .0249 | .0204 | .0187 |
| CP CPU msec/trans | .0312 | .0143 | .0058 |
| %diff layer 3 to layer 2 | |||
| trans/sec | 1.1% | 2.4% | 2.5% |
| Total CPU msec/trans | 0.4% | -0.6% | 0.4% |
| Emul CPU msec/trans | 2.0% | -1.0% | 0.0% |
| CP CPU msec/trans | -1.0% | 0.0% | 1.8% |
| 2084-324; Linux SLES 8; 2 LPARs; 2 CPUs each; 1 virtual CPU | |||
Over the 1 GbE card, layer2 gets better throughput and CPU time is very close to the same as layer 3.
Table 9. OSA - 1 GbE - STR - 1492
| Number of clients | 01 | 10 | 50 |
| run ID (layer 3) | losn0101 | losn1002 | losn5001 |
| MB/sec | 54.5 | 112.0 | 112.1 |
| Total CPU msec/MB | 5.58 | 4.82 | 5.41 |
| Emul CPU msec/MB | 3.52 | 3.71 | 4.30 |
| CP CPU msec/MB | 2.06 | 1.11 | 1.11 |
| run ID (layer 2) | losn0101 | losn1002 | losn5001 |
| MB/sec | 54.6 | 112.0 | 112.0 |
| Total CPU msec/MB | 5.64 | 4.95 | 5.64 |
| Emul CPU msec/MB | 3.59 | 3.80 | 4.45 |
| CP CPU msec/MB | 2.05 | 1.14 | 1.20 |
| %diff layer 3 to layer 2 | |||
| MB/sec | 0.2% | 0.0% | -0.1% |
| Total CPU msec/MB | 1.1% | 2.6% | 4.4% |
| Emul CPU msec/MB | 1.9% | 2.4% | 3.4% |
| CP CPU msec/MB | -0.2% | 3.2% | 8.2% |
| 2084-324; Linux SLES 8; 2 LPARs; 2 CPUs each; 1 virtual CPU | |||
With the streaming workload, throughput was the same, but layer 2 had a higher CPU msec/MB than layer 3. The difference increased as the workload increased. This was true for both MTU sizes.
Table 10. OSA - 1 GbE - STR - 8992
| Number of clients | 01 | 10 | 50 |
| run ID (layer 3) | losj0102 | losj1003 | losj5001 |
| MB/sec | 64.7 | 118.0 | 118.0 |
| Total CPU msec/MB | 4.70 | 4.19 | 4.27 |
| Emul CPU msec/MB | 2.13 | 2.10 | 2.17 |
| CP CPU msec/MB | 2.57 | 2.08 | 2.10 |
| run ID (layer 2) | losj0102 | losj1003 | losj5001 |
| MB/sec | 67.3 | 118.0 | 118.0 |
| Total CPU msec/MB | 4.87 | 4.49 | 4.56 |
| Emul CPU msec/MB | 2.20 | 2.19 | 2.27 |
| CP CPU msec/MB | 2.68 | 2.31 | 2.29 |
| %diff layer 3 to layer 2 | |||
| MB/sec | 4.0% | 0.0% | 0.0% |
| Total CPU msec/MB | 3.7% | 7.3% | 6.7% |
| Emul CPU msec/MB | 3.1% | 4.0% | 4.7% |
| CP CPU msec/MB | 4.2% | 10.7% | 8.8% |
| 2084-324; Linux SLES 8; 2 LPARs; 2 CPUs each; 1 virtual CPU | |||
When the MTU size is larger, layer 2 shows slightly higher throughput than layer 3 for one client-server pair.
Table 11. OSA - 10 GbE - RR - 1492
| Number of clients | 01 | 10 | 50 | 100 | 200 | 300 | 400 | 500 |
| run ID (layer 3) | ror001 | ror010 | ror050 | ror100 | ror200 | ror300 | ror400 | ror500 |
| trans/sec | 2429.0 | 14916.0 | 34774.0 | 47574.0 | 58185.0 | 64578.0 | 69523.0 | 70533.0 |
| Total CPU msec/trans | 2.40 | 0.62 | 0.31 | 0.24 | 0.22 | 0.21 | 0.22 | 0.23 |
| Emul CPU msec/trans | 0.76 | 0.13 | 0.05 | 0.03 | 0.03 | 0.02 | 0.02 | 0.02 |
| CP CPU msec/trans | 1.65 | 0.49 | 0.26 | 0.21 | 0.20 | 0.19 | 0.20 | 0.21 |
| run ID (layer 2) | ro2001 | r02010 | r02050 | r02100 | r02200 | r02300 | r02400 | r02500 |
| trans/sec | 2513.0 | 14951.0 | 36000.0 | 49579.0 | 60733.0 | 67568.0 | 72512.0 | 75060.0 |
| Total CPU msec/trans | 0.60 | 0.40 | 0.27 | 0.23 | 0.21 | 0.21 | 0.21 | 0.22 |
| Emul CPU msec/trans | 0.25 | 0.13 | 0.06 | 0.04 | 0.03 | 0.02 | 0.02 | 0.02 |
| CP CPU msec/trans | 0.38 | 0.27 | 0.21 | 0.19 | 0.19 | 0.18 | 0.19 | 0.20 |
| %diff layer 3 to layer 2 | ||||||||
| trans/sec | 3% | 0% | 4% | 4% | 4% | 5% | 4% | 6% |
| Total CPU msec/trans | -75% | -35% | -14% | -4% | -4% | 1% | -4% | -3% |
| Emul CPU msec/trans | -66% | 0% | 10% | 10% | 6% | 6% | 7% | 5% |
| CP CPU msec/trans | -77% | -45% | -20% | -7% | -6% | 6% | -5% | -4% |
| 2084-B16; Linux SLES 8; z/VM 5.1.0; 10 GbE card with feature 3368; 1 LPAR; 8 CPUs; 3 virtual CPUs | ||||||||
As workload increases, throughput is higher for Layer 2 than Layer 3 and CPU time is somewhat less. For the lighter workloads, the CPU time for Layer 2 is considerably less than for Layer 3. We plan on investigating why CPU time is so much less for this workload, as well as for the STR workload following.
Table 12. OSA - 10 GbE - STR - 1492
| Number of clients | 01 | 08 | 16 | 32 |
| run ID (layer 3) | sor001 | sor010 | sor016 | sor032 |
| MB/sec | 72.0 | 145.0 | 144.0 | 136.0 |
| Total CPU msec/MB | 88.89 | 45.24 | 49.44 | 55.88 |
| Emul CPU msec/MB | 14.44 | 7.17 | 7.78 | 8.82 |
| CP CPU msec/MB | 74.44 | 37.52 | 41.67 | 47.06 |
| run ID (layer 2) | so2001 | s02008 | s02016 | s02032 |
| MB/sec | 74.0 | 157.0 | 156.0 | 149.0 |
| Total CPU msec/MB | 55.14 | 45.86 | 46.67 | 52.08 |
| Emul CPU msec/MB | 16.22 | 7.64 | 7.69 | 8.05 |
| CP CPU msec/MB | 40.00 | 38.22 | 38.97 | 44.03 |
| %diff layer 3 to layer 2 | ||||
| MB/sec | 3% | 8% | 8% | 10% |
| Total CPU msec/MB | -38% | 1% | -6% | -7% |
| Emul CPU msec/MB | 12% | 7% | -1% | -9% |
| CP CPU msec/MB | -46% | 2% | -6% | -6% |
| 2084-B16; Linux SLES 8; z/VM 5.1.0; 10 GbE card with feature 3368; 1 LPAR; 8 CPUs; 3 virtual CPUs | ||||
The same trend seen for this card and the RR workload is true for streaming, with throughput being higher for Layer 2, heavy workloads showing somewhat less CPU time and lighter workloads showing significantly less CPU time.
Back to Table of Contents.
Guest Cryptographic Enhancements
This section summarizes the results of a number of new measurements that were designed to understand the performance characteristics of the enhanced cryptographic support provided in z/VM 5.2.0.
Introduction
z/VM 5.2.0 extended the existing shared and dedicated cryptographic queue support to include the Cryptographic Express2 coprocessor (CEX2C) on the z990 and z9 processors and the Cryptographic Express2 Accelerator coprocessor (CEX2A) on the z9 processor.
Support of the CEX2C card is also available in z/VM 5.1.0 and support of the CEX2A card was provided on z/VM 5.1.0 via APAR VM63646.
The existing z/VM 5.1.0 support, component terminology, and measurement methodology are described in z990 Guest Crypto Enhancements.
z/VM 5.2.0 also provided support for the CHSC Store Crypto-Measurement data command. This Crypto-Measurement data along with z/VM internal data are now included in z/VM monitor data. See Monitor Enhancements for details.
In addition to these z/VM enhancements, z/OS provided support for additional features of the CP Assist for Cryptographic Functions (CPACF) that are available on the z9.
Summary of Results
The results of individual measurements are affected by the cryptographic card configuration, processor configuration, cryptographic sharing configuration, cryptographic operations, the guest operating system, and the cipher for the SSL workloads.
For dedicated cryptographic cards, both z/OS and Linux will route cryptographic operations to all available cards and each can use the full capacity of the encryption facilities unless limited by processor utilization or other serialization. z/VM guest measurements are generally limited by the same factor as a native measurement. All of the Linux guest SSL measurements with dedicated cryptographic cards are limited by processor utilization. The z/OS guest SSL measurements are limited by some undetermined serialization. The z/OS guest ICSF measurements are nearly identical to the native z/OS measurement and each is limited by same factor as the native measurement.
For shared cryptographic cards, z/VM routes cryptographic operations to all available real cryptographic cards. For a single guest, the external throughput rate is determined by the amount that can be obtained through the 8 virtual queues, the maximum capacity of the encryption facilities, processor utilization, or other serialization. Examples of external throughput rates limited by the 8 virtual queues and by the maximum throughput rate of the real cryptographic cards are included in the detailed measurement section. Processor time per transaction is higher with shared cryptographic cards than with dedicated cryptographic cards.
With a sufficient number of Linux guests, the shared cryptographic support will reach 100% utilization of the real cryptographic configuration unless processor utilization or other serialization becomes the limiting factor. All of the multiple guest measurements included in the detailed measurement section are limited by processor utilization.
Results for measurements of the SSL workload vary by SSL cipher. For the SSL workload, CEX2C and CEX2A cards are used only for the SSL handshake. Data encryption using the specified cipher is handled by software encryption routines or by CPACF. The detail measurement section contains both z/OS and Linux results by SSL cipher. Ratios between ciphers vary depending on the guest operating system and the processor model.
Linux Guest Crypto on z990 and z9
The z/VM 4.3.0 section titled Linux Guest Crypto Support describes the original cryptographic support and the original methodology. The z/VM 4.4.0 section titled Linux Guest Crypto on z990 and the z/VM 5.1.0 section titled Linux Guest Crypto on z990 describe additional cryptographic support and methodology.
Measurements were completed using the Linux OpenSSL Exerciser Performance Workload described in Linux OpenSSL Exerciser. Specific parameters used can be found in the common items table, various table columns, or table footnotes.
Items common to the measurements in this section are
summarized
in Table 1.
Table 1. Common items for measurements in this section
| Client Authentication | No |
| Server SID Cache | Disabled |
| Client SID Cache | 0 |
| Client SID Timeout | 180 |
| Connections | 1 |
| Packets | 1 |
| Send Bytes | 2048 |
| Receive Bytes | 2048 |
| Key Size | 1024 |
| z/VM System Level | 5.2.0 GA |
| Linux System Level | SLES9 SP2 |
| Linux Kernel Level | 2.6.13-14 |
| OpenSSL Code Level | 0.9.7C |
| z90Crypt Level | 1.2.2 |
| Real Connectivity (1 Guest) | Linux TCP/IP |
| Real Connectivity (30 Guests) | z/VM TCP/IP |
| Virtual Connectivity | Guest LAN QDIO |
| TCP/IP Virt Mach Size | 256M |
| TCP/IP Virt Mach Mode | UP |
| Guest Type | V=V |
| Linux Kernel Mode | MP |
| Linux Kernel Size | 64-bit |
| Linux Virt Mach Size (1 Guest) | 2G |
| Linux Virt Mach Size (30 Guests) | 128M |
| Linux Virt Processors (1 Guest) | 4 |
| Linux Virt Processors (30 Guests) | 1 |
| Servers | 100-280 |
| Server Threads | 100-280 |
| Client Threads | 100-280 |
| Client Machines | 1-2 |
| Server Model | z990,z9 dedicated LPAR |
| Client Model | z990 |
| Connective Paths | CTCs |
Dedicated and Shared CEX2C cards on z990:
Table 2 contains a summary of the results from measurements using 6 CEX2C cards including dedicated cards for a single guest, shared cards for a single guest, and shared cards for 30 guests.
For dedicated CEX2C cards, a single Linux guest routes cryptographic operations to all dedicated cards. A single guest can obtain the maximum throughput rate of the real cards unless processor utilization becomes a limit. The measurement with 6 dedicated CEX2C cards is limited by nearly 100% processor utilization while the utilization of the CEX2C cards was only 80%.
For shared CEX2C cards, z/VM routes cryptographic operations to all available real cards. For a single guest, the total external throughput rate is determined by the amount that can be obtained through the 8 virtual queues or the maximum throughput rate of the real cards. The single user measurement with 6 shared CEX2C cards is limited by the 8 virtual queues with processor utilization of 74% and CEX2C utilization of 54%.
Processor time per transaction is higher for shared cards than with dedicated cards. In the single users measurements with 6 CEX2C cards, processor time per transaction with shared cards increased 23% from the measurement with dedicated cards.
With a sufficient number of Linux guests, the shared cryptographic support will reach 100% utilization of the real CEX2C cards unless 100% processor utilization becomes the limiting factor. The 30 user measurement with 6 shared CEX2C cards is limited by nearly 100% processor utilization while the utilization of the CEX2C cards was only 56%.
Processor time per transaction is higher with 30 guests than with a single guest. In the measurements with 6 CEX2C cards, processor time per transaction with 30 guests increased 16% from the measurement with a single guest.
Table 2. Dedicated and Shared CEX2C cards by number of Linux guests
| Dedicated CEX2C cards | 6 | 0 | 0 |
| Shared CEX2C cards | 0 | 6 | 6 |
| No. Linux Guest | 1 | 1 | 30 |
| Run ID | E5723BV3 | E5724BV1 | E5727BV1 |
| Tx/sec (w) | 4574.52 | 2805.18 | 3205.70 |
| Total Util/Proc (p) | 99.2 | 74.6 | 99.2 |
| Total msec/Tx (p) | 0.867 | 1.064 | 1.238 |
| CEX2C Utilization (m) | 80 | 54 | 56 |
| Notes: z/VM 520 GA; 2084-324; 4 dedicated processors; 4G central storage; no expanded storage; workload: SSL Exerciser; RC4 MD5 US cipher; no session id caching; (w) = test case; (p) = z/VM Performance Toolkit (Perfkit) (m) = z/VM Monitor | |||
Shared CEX2C cards on z990 with 30 Linux guests by SSL cipher:
Table 3 contains a summary of the results from measurements using 6 CEX2C shared cards for 30 guests and various SSL ciphers.
With 6 CEX2C cards, measurements for all five ciphers are limited by nearly 100% processor utilization. The external throughput rates vary by more than 40%, with the DES SHA cipher providing the highest rate and the AES-256 SHA US cipher providing the lowest rate. The AES-256 SHA US cipher achieved an external throughput rate of 0.71 times the external throughput rate achieved with the DES SHA cipher.
Results with a RC4 MD5 US and DES SHA cipher are nearly identical to results for similar measurements using PCIXCC cards shown in table Shared PCIXCC and PCICA cards with 30 Linux guest by SSL cipher of the z/VM 5.1.0 section titled z990 Guest Crypto Enhancements.
Table 3. Six shared CEX2C cards with 30 Linux guests by cipher
| cipher | RC4 MD5 US | DES SHA | AES-128 SHA US | AES-256 SHA US |
| Run ID | E5727BV1 | E5728BV1 | E5731BV1 | E5731BV2 |
| Tx/sec (w) | 3205.70 | 3632.55 | 2783.58 | 2576.08 |
| Total Util/Proc (p) | 99.2 | 98.9 | 99.2 | 99.4 |
| Total Msec/Tx (p) | 1.238 | 1.089 | 1.426 | 1.543 |
| Notes: z/VM 520 GA 2084-324; 4 dedicated processors; 4G central storage; no expanded storage; Workload: SSL exerciser; no session id caching; (w) = Workload, (p) = z/VM Perfkit | ||||
Dedicated and Shared CEX2A cards on z9:
Table 4 contains a summary of the results from z9 measurements using CEX2A cards including 3 dedicated cards for a single guest, 1 shared card for a single guest, 3 shared cards for a single guest, and 3 shared cards for 30 guests.
For dedicated CEX2A cards, a single Linux guest routes cryptographic operations to all dedicated cards. A single guest can obtain the maximum throughput rate of the real cards unless processor utilization becomes a limit. The measurement with 3 dedicated CEX2A cards is limited by nearly 100% processor utilization while the utilization of the CEX2A cards was only 60%.
For shared CEX2A cards, z/VM routes cryptographic operations to all available real cards. For a single guest, the total external throughput rate is determined by the amount that can be obtained through the 8 virtual queues or the maximum throughput rate of the real cards.
The single user measurement with 1 shared CEX2A card is limited by the CEX2A utilization of 97% while processor utilization was 70%. The single user measurement with 3 shared CEX2A cards is limited by the 8 virtual queues with processor utilization of 92% and CEX2A utilization of 50%.
Processor time per transaction is higher for shared cards than with dedicated cards. In the single user measurements with 3 CEX2A cards, processor time per transaction with shared cards increased 25% from the measurement with dedicated cards.
With a sufficient number of Linux guests, the shared cryptographic support will reach 100% utilization of the real CEX2A cards unless 100% processor utilization becomes the limiting factor. The 30 user measurement with 3 shared CEX2A cards is limited by nearly 100% processor utilization while the utilization of the CEX2A cards was only 45%.
Processor time per transaction is higher with 30 guests than with a single guest. In the measurements with 3 CEX2A cards, processor time per transaction with 30 guests increased 16% from the measurement with a single guest.
Table 4. Dedicated and Shared CEX2A cards on z9 by number of Linux guests
| Dedicated CEX2A cards | 3 | 0 | 0 | 0 |
| Shared CEX2A cards | 0 | 1 | 3 | 3 |
| No. Linux Guest | 1 | 1 | 1 | 30 |
| Run ID | E5B09BV1 | E6114BV1 | E6118BV3 | E6128BV5 |
| Tx/sec (w) | 5584.15 | 3141.89 | 4657.00 | 4305.92 |
| Total Util/Proc (p) | 99.1 | 70.2 | 92.6 | 99.2 |
| Total msec/Tx (p) | 0.710 | 0.894 | 0.795 | 0.922 |
| CEX2A Utilization (m) | 60 | 97 | 50 | 45 |
| Notes: z/VM 520 GA; 2094-734; 4 dedicated processors; 5G central storage; 4G expanded storage; workload: SSL Exerciser; RC4 MD5 US cipher; no session id caching; (w) = workload, (p) = z/VM Perfkit, (m) = z/VM Monitor | ||||
Shared CEX2A cards on z9 with 30 Linux guests by SSL cipher:
Table 5 contains a summary of the results from z9 measurements using 3 CEX2A shared cards for 30 guests and various SSL ciphers.
With 3 CEX2A cards, measurements for all five ciphers are limited by nearly 100% processor utilization and the external throughput rates vary by more than 31% with the DES SHA cipher providing the highest rate and the AES-256 SHA US cipher providing the lowest rate. The AES-256 SHA US cipher achieved an external throughput rate of 0.76 times the external throughput rate achieved with the DES SHA cipher.
All results are higher than the z990 measurements with CEX2C cards because of the faster processor.
Table 5. Three shared CEX2A cards with 30 Linux guests by cipher
| cipher | RC4 MD5 US | DES SHA | TDES SHA US | AES-128 SHA US | AES-256 SHA US |
| Run ID | E6128BV5 | E6128BV6 | E6129BV1 | E6129BV2 | E6130BV1 |
| Tx/sec (w) | 4305.92 | 4805.16 | 4704.17 | 3867.81 | 3671.86 |
| Total Util/Proc (p) | 99.2 | 98.9 | 99.0 | 99.4 | 99.5 |
| Total msec/Tx (p) | 0.922 | 0.823 | 0.842 | 1.028 | 1.084 |
| Notes: z/VM 520 GA 2094-734; 4 dedicated processors; 5G central storage; 4G expanded storage; workload: SSL Exerciser; no session id caching; (w) = workload; (p) = z/VM Perfkit | |||||
z/OS Guest with CEX2A on z9
The z/VM 5.1.0 section titled z/OS Guest Crypto on z990 describes the original cryptographic support and the original methodology.
Guest versus native for z/OS ICSF with 1 dedicated CEX2A card on a z9
Measurements were completed using the z/OS ICSF Performance Workload PCXA sweep described in z/OS Integrated Cryptographic Service Facility (ICSF) Performance Workload . ICSF test cases developed for the PCICA card will execute on the CEX2A card and ICSF test cases developed for the PCIXCC card will execute on the CEX2C card.
The external throughput rates achieved by a z/OS guest using the z/VM dedicated cryptographic support are nearly identical to z/OS native for all measured test cases. Of the 56 individual test case comparisons, all of the guest rates were within 3% of the native measurement.
The 56 individual test cases produced far too much data to include in this report but Table 6 has a summary of guest to native throughput ratios for all measurements.
Multiple jobs provided a higher external throughput rate than a single job for all test case. Specific ratios varied dramatically by test case. The number of jobs in the multiple job measurements is enough to reach full capacity of the specified encryption facility.
Table 6. Guest to Native Throughput Ratio for z/OS ICSF PCXA Sweep
| CEX2A | 8 | 8 |
| Jobs | 1 | 8 |
| PCXA Sweep (28 test cases) | ||
| Run ID (Native) | E5831IW1 | E5901IW1 |
| Run ID (Guest) | E5905IV1 | E5905IV2 |
| Ratio (Average) | 0.990 | 0.985 |
| Ratio (Minimum) | 0.988 | 0.974 |
| Ratio (Maximum) | 0.992 | 1.000 |
| 2094-738; 1 dedicated processor, 4G central storage, no expanded storage; workload: z/OS ICSF Sweeps; Ratios are calculated from workload data | ||
Guest versus native for z/OS SSL with 8 dedicated CEX2A cards on a z9
Measurements were completed for a data exchange test case with both servers and clients on the same z/OS system using the z/OS SSL Performance Workload described in z/OS Secure Sockets Layer (System SSL) Performance Workload. Specific parameters used can be found in the various table columns or table footnotes.
Table 7 contains a summary of results for the dedicated guest cryptographic support and native z/OS measurements.
With 8 dedicated CEX2A cards, the native measurement is limited by nearly 100% processor utilization. The guest measurement achieved only 90% processor utilization and 14% CEX2A utilization and appears to be limited by some undetermined system serialization. The guest measurement achieved an external throughput rate of 0.83 times the native measurement. Processor time per transaction for the guest measurement is 8% higher than the native measurement.
Table 7. Guest versus native for z/OS System SSL
| Type | Native | Guest |
| Dedicated CEX2A cards | 8 | 8 |
| Run ID | E5831BE3 | E5904VE5 |
| Tx/sec (w) | 2575.58 | 2149.50 |
| Total Util/Proc (f) | 99.93 | na |
| Total Util/Proc (p) | na | 90.0 |
| Total msec/Tx (u) | 1.55 | na |
| Total msec/Tx (p) | na | 1.675 |
| CEX2A Utilization (f) | 16 | na |
| CEX2A Utilization (m) | na | 14 |
| Tx/sec Ratio (Guest/Native) | - | 0.835 |
| Notes: zVM 5.2.0 GA; z/OS V1R6 with update ICSF code; 2094-738; 4 dedicated processors, 4G central storage, no expanded storage; workload: SSL Exerciser, no client authentication, 1 connection, 1 packet, 2048 bytes each way, 1024 bit keys, AES-256 SHA US cipher, no session id caching; 2 servers, 40 server threads, 40 client threads; server SID cache = 16000, client SID cache = 0, server SID timeout = 180, client SID timeout = 180; (w) = workload, (u) = z/OS RMF & workload RUN-DATA, (f) = z/OS RMF, (p) = z/VM Perfkit, (m) = z/VM Monitor | ||
Dedicated CEX2A cards on a z9 with z/OS by SSL cipher:
Table 8 contains a summary of the results from z9 measurements using 3 CEX2A dedicated cards for a z/OS guest and various SSL ciphers.
With 8 CEX2A cards, measured external throughput rates for all five ciphers varied by less than 6% with the DES SHA cipher providing the highest rate and the RC4 MD5 US cipher providing the lowest rate. Native z/OS measurements, not included in this report, showed up to 50% improvement using the new CPACF support for the AES ciphers. The AES-256 SHA US cipher achieved an external throughput rate of 0.96 times the external throughput rate achieved with the DES SHA cipher. This ratio is much better than the ones reported in the Linux section, thus demonstrates that the z/OS guest receives a benefit similar to native z/OS from the new CPACF support provided by z/OS.
Neither processor utilization nor CEX2A utilization are 100% so all of these measurements are limited by the undetermined system serialization.
Table 8. Eight dedicated CEX2A cards with one z/OS guest by cipher
| cipher | RC4 MD5 US | DES SHA | TDES SHA US | AES-128 SHA US | AES-256 SHA US |
| Run ID | E5904VE1 | E5904VE2 | E5904VE3 | E5904VE4 | E5904VE5 |
| Tx/sec (w) | 2101.33 | 2224.92 | 2202.33 | 2221.92 | 2149.50 |
| Total Util/Proc (p) | 92.7 | 82.8 | 83.9 | 83.2 | 90.0 |
| Total msec/Tx (p) | 1.765 | 1.489 | 1.524 | 1.498 | 1.675 |
| Notes: z/VM 520 GA 2094-734; 4 dedicated processors; 5G central storage; 4G expanded storage; workload: SSL Exerciser; no session id caching; (w) = Workload, (p) = z/VM Perfkit | |||||
Back to Table of Contents.
z/VM Version 5 Release 1.0
This section discusses the performance characteristics of z/VM 5.1.0 and the results of the z/VM 5.1.0 performance evaluation.
Back to Table of Contents.
Summary of Key Findings
This section summarizes the performance evaluation of z/VM 5.1.0. For further information on any given topic, refer to the page indicated in parentheses.
z/VM 5.1.0 includes a number of performance improvements, performance considerations, and changes that affect VM performance management (see Changes That Affect Performance):
- Performance Improvements
- Contiguous Frame Management Improvements
- Improved Management of Idle Guests with Pending Network I/O
- No Pageable CP Modules
- Performance Considerations
- Preferred Guest Support
- 64-bit Support
- FBA-emulation SCSI DASD CPU Usage
- TCP/IP VM IPv6 Performance
- Performance Management
- Monitor Enhancements
- Effects on Accounting Data
- VM Performance Products
Migration from z/VM 4.4.0: Regression measurements comparing z/VM 4.4.0 and z/VM 5.1.0 showed performance results that are equivalent within run variability. The following environments were evaluated: CMS (CMS1 workload), Linux connectivity, and TCP/IP VM connectivity.
z/VM 5.1.0 now supports up to 24 processors. CP's ability to effectively utilize additional processors is highly workload dependent. For example, CMS-intensive workloads typically cannot make effective use of more than 8-12 processors before master processor serialization becomes a bottleneck. A Linux webserving workload was used to see how well CP can handle a workload that causes little master processor serialization as the number of real processors is increased to 24. LPAR processor capping was used to hold total processing power constant so as to be able to observe just n-way effects rather than a combination of n-way and large system effects. The results show that, for this workload, CP can make effective use of all 24 processors. The usual decrease in efficiency with increasing processors due to increased MP locking was observed. On a 24-way, for example, total CPU time per transaction increased 32% relative to the corresponding 16-way measurement (see 24-Way Support).
The FBA-emulation Small Computer System Interface (SCSI) support provided by z/VM 5.1.0 has much higher CPU requirements than either dedicated Linux SCSI I/O or traditional ECKD DASD I/O. This should be taken into account when deciding when to use this support (see Performance Considerations and Emulated FBA on SCSI).
Measurement results indicate that there are some cases where performance can be degraded when communicating between TCP/IP VM stack virtual machines using Internet Protocol Version 6 (IPv6), or using IPv4 over IPv6-capable devices, as compared to IPv4 (see Performance Considerations and Internet Protocol Version 6 Support). Similarly, some reduction in performance was observed for IPv6 relative to IPv4 for the case of Linux-to-Linux connectivity via the z/VM Virtual Switch using the Layer2 transport mode (see Virtual Switch Layer 2 Support).
The z/VM Virtual Switch now supports the Layer2 transport mode. 1 The new Layer2 support shows performance results that are similar to the Layer3 support that was provided in z/VM 4.4.0. In most measured cases, throughput was slightly improved, while total CPU usage was slightly degraded (see Virtual Switch Layer 2 Support).
A series of measurements was obtained to evaluate a number of z990 guest crypto enhancements. These results provide insight into the performance of 1) the PCIXCC card relative to the PCICA card, 2) VM's shared cryptographic support for Linux guests compared to the new dedicated cryptographic support, 3) the effect of multiple Linux guests on cryptographic performance with shared queues, 4) the effect of different ciphers on Linux SSL performance, and 5) guest versus native performance for ICSF testcases and an SSL workload on z/OS. For all measurements with multiple guests, throughput was limited by either total system processor utilization or the capacity of the available cryptographic cards (see z990 Guest Crypto Enhancements).
Footnotes:
- 1
- Requires z/VM 5.1.0 with APAR VM63538 and TCP/IP 5.1.0 with PQ98202, running on z890 or z990.
Back to Table of Contents.
Changes That Affect Performance
This chapter contains descriptions of various changes in z/VM 5.1.0 that affect performance. It is divided into three sections -- Performance Improvements, Performance Considerations, and Performance Management.
Back to Table of Contents.
Performance Improvements
The following items improve performance:
- Contiguous Frame Management Improvements
- Improved Management of Idle Guests with Pending Network I/O
- No Pageable CP Modules
Contiguous Frame Management Improvements
The use of the 64-bit architecture by CP results in a greater demand for data structures that require contiguous frames, particularly those associated with dynamic address translation. This line item involves various algorithmic changes to improve the management of contiguous frames. These changes have the potential to improve system performance and avoid potential system hangs when memory is constrained and/or fragmented. While very few field problems have been identified in existing releases, these improvements help ensure that systems will continue to run well as memory usage increases.
Improved Management of Idle Guests with Pending Network I/O
A problem was found on previous VM releases where guests were not being dropped from the dispatch list when they went idle. This was because those guests had network I/O outstanding even though network I/O is often long-term. Such guests appeared runnable with high I/O active wait state percentages.
APAR VM63282 addresses this problem for fully simulated network devices. 1 Guests that have outstanding network I/O to such devices but are otherwise idle are now considered to be idle. This causes applicable guests to be appropriately dropped from the dispatch list, allowing their storage to be more effectively identified as available for other purposes. It also causes their user state sampling to shift from I/O active wait state to idle or test idle state. This APAR has been integrated into z/VM 5.1.0. The integrated version has been extended so that it also applies to real devices that are attached to a virtual machine and that have the same device codes as those supported by the APAR.
No Pageable CP Modules
With z/VM 5.1.0, all CP modules now reside in fixed storage. Measurement results indicate that this has resulted in a small net performance improvement in most situations due to reduced module linkage overhead. Years ago, when real storage sizes were much smaller, the ability to make infrequently used CP modules pageable provided a meaningful performance advantage but now storage sizes are so large that this design is no longer necessary.
Footnotes:
- 1
-
VM63282 is available for z/VM 4.3.0 (PTF UM30888) and z/VM 4.4.0 (PTF UM30889). It applies to virtual (simulated) devices with the following properties:
VDEVCLAS=CLASSPEC VDEVTYPE=TYPOSA   OSA2 / OSA-E QDIO / HiperSockets
VDEVCLAS=CLASSPEC VDEVTYPE=TYPFCP   FCP subchannel
VDEVCLAS=CLASSPEC VDEVTYPE=TYPCTCA  CTCA / 3088 / ESCON / FICON
VDEVCLAS=CLASSVCM VDEVTYPE=TYPMSGF  Msg Facility device
Virtual devices are those created by CP DEFINE commands, SPECIAL directory statements and NICDEF directory statements.
Back to Table of Contents.
Performance Considerations
These items warrant consideration since they have potential for a negative impact to performance.
- Preferred Guest Support
- 64-bit Support
- FBA-emulated SCSI DASD CPU Usage
- TCP/IP VM IPv6 Performance
Preferred Guest Support
Starting with z/VM 5.1.0, z/VM no longer supports V=R and V=F guests. Accordingly, if you currently run with preferred guests and will be migrating to z/VM 5.1.0, you will need to estimate and plan for a likely increase in processor requirements as those preferred guests become V=V guests as part of the migration. Refer to Preferred Guest Migration Considerations for assistance and background information.
64-bit Support
z/VM 4.4.0 and earlier releases provided both 31-bit and 64-bit versions of CP. Starting with z/VM 5.1.0, only the 64-bit build is provided. This is not expected to result in any significant adverse performance effects because performance measurements have indicated that both builds have similar performance characteristics.
It is important to bear in mind that much of the code in the 64-bit build still runs in 31-bit mode and therefore requires that the data it uses to reside below the 2G line. This is usually not a problem. However, on very large systems this can result in degraded performance due to a high rate of pages being moved below 2G. For further background information, how to tell if this is a problem, and tuning suggestions, see Understanding Use of Memory below 2 GB .
FBA-emulation SCSI DASD CPU Usage
The FBA-emulation SCSI support provided by z/VM 5.1.0 is much less efficient than either dedicated Linux SCSI I/O or traditional ECKD DASD I/O. For example: CP CPU time required to do paging I/O to FBA-emulated SCSI devices is about 19-fold higher than the CP CPU time required to do paging I/O to ECKD devices. As another example, CP CPU time to do Linux file I/O using VM's FBA-emulation SCSI support is about ten-fold higher than doing the same I/O to SCSI devices that are dedicated to the Linux guest, while total CPU time is about twice as high. These impacts can be reduced in cases (such as in the second example) where minidisk caching can be used to reduce the number of real DASD I/Os that need to be issued. These performance effects should be taken into account when deciding appropriate use of the FBA-emulation SCSI support. See Emulated FBA on SCSI for measurement results and further discussion.
TCP/IP VM IPv6 Performance
Measurement results indicate that there are some cases where performance can be degraded when communicating between TCP/IP VM stack virtual machines using Internet Protocol Version 6 (IPv6), or using IPv4 over IPv6-capable devices, as compared to IPv4. The most unfavorable cases were observed for bulk data transfer across a Gigabit Ethernet connection using an MTU size of 1492. For those cases, throughput decreased by 10% to 25% while CPU usage increased by 10% to 40%. For VM Guest LAN (QDIO simulation), throughput and CPU usage were within 3% of IPv4 for all measured cases. See Internet Protocol Version 6 Support for measurement results.
Back to Table of Contents.
Performance Management
These changes affect the performance management of z/VM and TCP/IP VM.
- Monitor Enhancements
- Effects on Accounting Data
- VM Performance Products
Monitor Enhancements
There were several areas of enhancements affecting the monitor data for z/VM 5.1.0 involving both system configuration information and improvements in data collection. As a result of these changes, there are eight new monitor records and several changed records. The detailed monitor record layouts are found on our control blocks page.
Minor changes were made to several monitor records to clarify field values and to enhance data collection. Documentation-only changes were made to the following three records: Domain 0 Record 9 (Physical Channel Path Contention Data), Domain 1 Record 7 (Memory Configuration Data), and Domain 3 Record 15 (NSS/DCSS/SSP Loaded into Storage). The User Partition ID was added to Domain 0 Record 16 (CPU Utilization Data in a Logical Partition) and the Channel Path ID type as found in the Store Channel-Path Description was added to Domain 0 Record 20 (Extended Channel Measurement Data (Per Channel)). Finally, additional data fields for minidisk caching were added to Domain 0 Record 14 (Expanded Storage Data (Global)).
Native SCSI disk support is provided in z/VM 5.1.0, allowing SCSI disk storage to appear as FBA DASD. Several monitor records were updated to allow monitor data to be captured for these new devices. They include: Domain 1 Record 6 (Device Configuration Data), Domain 1 Record 8 (Paging Configuration Data), Domain 3 Record 7 (Page/Spool Area of a CP Volume), Domain 3 Record 11 (Auxiliary Shared Storage Management), Domain 6 Record 1 (Vary on Device), Domain 6 Record 2 (Vary off Device), Domain 6 Record 3 (Device Activity), Domain 6 Record 6 (Detach Device), and Domain 7 Record 1 (Seek Data). In addition a new record, Domain 6 Record 24 (SCSI Device Activity) was created to record device activity on a SCSI device.
Starting with the z990, some of the zSeries processors will be able to change their CPU clock speed dynamically in certain circumstances. To monitor any CPU clock speed changes, the Domain 0 Record 19 (Global System Data) and the Domain 1 Record 4 (System Configuration Data) records have been updated. Also a new record, Domain 1 Record 18 (Record of CPU Capability Change) will be created whenever a change in the CPU clock speed is recognized.
Virtual IP switch (VSwitch) has been improved in z/VM 5.1.0 to provide enhanced failover support for less disruptive recovery for some common network failures. Two new monitor records have been created, Domain 6 Record 22 (Virtual Switch Failover) and Domain 6 Record 23 (Virtual Switch Recovery), to record when VSwitch failure and recovery occur.
A monitoring facility for real Queued Direct I/O (QDIO) devices (ie: OSA Direct Express, FCP SCSI and HiperSockets) is added to z/VM 5.1.0 with updates to Domain 4 Record 2 (User Logoff Data), Domain 4 Record 3 (User Activity Data) and Domain 4 Record 9 (User Activity Data at Transaction End). There is a new configuration monitor record: Domain 1 Record 19 (indicates configuration of a QDIO device). Three new records have been added to the I/O Domain: Domain 6 Record 25 (indicates that a QDIO device has been activated), Domain 6 Record 26 (indicates activity on a QDIO device), and Domain 6 Record 27 (indicates deactivation of a QDIO device). Note that none of these changes apply to virtual machines such as the TCP/IP VM stack that use Diagnose X'98' to lock their QDIO buffers in real storage.
Linux guests can now contribute performance data to CP monitor using the APPLDATA (domain 10) interface. See the chapter entitled "Linux monitor stream support for z/VM" in Device Drivers and Installation Commands for information on how to build a Linux kernel that is enabled for monitoring and other details.
Effects on Accounting Data
None of the z/VM 5.1.0 performance changes are expected to have a significant effect on the values reported in the virtual machine resource usage accounting record.
VM Performance Products
This section contains information on the support for z/VM 5.1.0 provided by the Performance Toolkit for VM. Introduced in z/VM 4.4.0, Performance Toolkit for VM is a replacement for VMPRF and RTM, which have been discontinued starting with z/VM 5.1.0. Performance Toolkit for VM provides enhanced capabilities for a z/VM systems programmer, operator, or performance analyst to monitor and report performance data. The toolkit is an optional, per-engine-priced feature derived from the FCON/ESA program (5788-LGA) providing:
Full-screen mode system console operation and management of multiple z/VM systems
Post-processing of Performance Toolkit for VM history files and of VM monitor data captured by the MONWRITE utility
Viewing of performance monitor data using either web browsers or PC-based 3270 emulator graphics
TCP/IP performance reporting
Viewing of Linux performance data
Performance Toolkit for VM has been enhanced in z/VM 5.1.0 in a number of respects:
functional equivalence to VMPRF
batch processing of monitor data files, including a VMPRF migration aid mode
new Linux reports based on application domain monitor data
two new reports for SCSI DASD
These enhancements are discussed in What's New in Performance Toolkit for VM in Version 5.1.0 located here. For general information about Performance Toolkit for VM and considerations for migrating from VMPRF and RTM, refer to our Performance Toolkit page.
Back to Table of Contents.
New Functions
This section contains performance evaluation results for the following new functions:
- 24-Way Support
- SCSI DASD
- Internet Protocol Version 6 Support
- Virtual Switch Layer 2 Support
Back to Table of Contents.
24-Way Support
Prior to z/VM 5.1.0, the VM Control Program (CP) supported up to 16 processor engines for a single z/VM image. With z/VM 5.1.0, CP can support up to 24 processors per image in a zSeries LPAR configuration.
This section summarizes the results of a performance evaluation that was done to verify that z/VM 5.1.0 can support an LPAR configuration with up to 24 CPUs with a suitable workload. This was accomplished using a Linux webserving workload that was driven to fully utilize the processing capacity of the LPAR in which it was running, resulting in a CPU-intensive workload. The measurements captured included the external throughput rate (ETR), CP CPU time per transaction (CP Msec/Tx), and time spent spinning, to wait on CP locks.
All performance measurements were done on a z990 system. A 2084-C24 system was used to conduct experiments in an LPAR configured with 6.5GB of central storage and 0.5GB of expanded storage. 1
The LPAR processor configuration was varied for the evaluation. The hardware configuration included shared processors and processor capping for all measurements. The 16-way measurement was used as the baseline for comparison as this was the previous maximum number of supported CPUs in an LPAR with z/VM. The comparison measurements were conducted with the LPAR configured with shared processors as an 18-way, 20-way, 22-way, and 24-way. Processor capping was active at a processing capacity of 4.235 processors for all measurements in order to hold the system capacity constant.
Processor capping creates a maximum limit for system processing power allocated to an LPAR. Using a workload that fully utilizes the maximum processing power for the LPAR allows the system load to remain constant at the LPAR processing capacity. Then, any effects that are measured as the number of processors (or n-way) is varied can be attributed to the n-way changes (since the processing capacity of the LPAR remains constant).
The software configuration for this experiment used a z/VM 4.4.0 system. However, 24-way support is provided with z/VM 5.1.0; all functional testing for up to 24 CPUs was performed using z/VM 5.1.0.
The application workload consisted of:
- 100 Linux guest virtual machines performing HTTP web serving (these servers were constantly busy serving web pages).
- 2 Linux guest virtual machines acting as clients constantly sending requests for web pages (with zero think time) to the 100 Linux guest webservers.
An internal version of Application Workload Modeler (AWM) was used to drive the application workload measurement for each n-way configuration. Hardware instrumentation data, CP monitor data, and Performance Toolkit data were collected for each measurement.
The application workload used for this experiment kept the webservers constantly busy serving web pages, which enabled full utilization of the LPAR processing power. Because of this, the External Throughput Rate (ETR) and Internal Throughput Rate (ITR) are essentially the same for this experiment.
Figure 1 shows the ETR and ITR as the number of processors is increased.
Figure 1. Large N-Way Software Effects on ETR & ITR
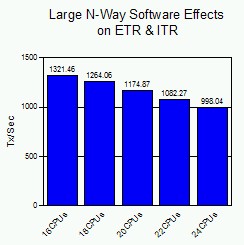 |
When system efficiency is not affected by n-way changes, the expected result is that the ETR and ITR remain constant as the number of processors increases. Even though the number of available CPUs is being increased, processor capping holds the total processing power available to the LPAR constant. This chart illustrates that there is a decrease in the transaction rate which indicates a decrease in system efficiency as the number of processors increases.
In a typical customer production environment where processor capping is not normally enabled, the result would be an increase in the transaction rate as the n-way increases. However, the expected increase in the transaction rate would be somewhat less than linear, since the results of our experiment show that there is a decrease in system efficiency with larger n-way configurations.
Figure 2 shows the effect of increasing the number of processors on CPU time per transaction for CP and emulation.
Figure 2. Large N-Way Software Effects on Msec/Tx
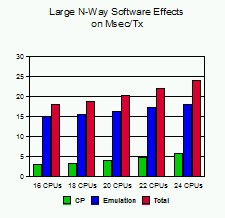 |
This chart shows measurements of CPU time per transaction for CP and the Linux guests (represented by emulation) as the n-way increases. Notice that both CP and emulation milliseconds per transaction (Msec/tx) increase with the number of processors. So, both CP and the Linux guests are contributing to decreased efficiency of the system.
The increase in emulation Msec/tx can be attributed to two primary causes. First, the Linux guest virtual MP client machines are spinning on locks within the Linux system. Second, these Linux guest client machines are generating Diagnose X'44's. Diagnose X'44's are generated to signal CP that the Linux machine is going to spin on an MP lock, allowing CP to consider dispatching another user. The diagnose rate and diagnoses per transaction data contained in Table 1 is almost all Diagnose X'44's.
Figure 3 shows the breakout of CP CPU Time per transaction (CP Msec/tx).
Figure 3. Breakout of CP Msec/Tx
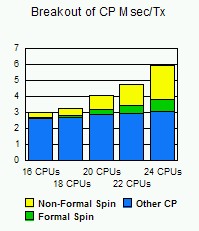 |
This chart shows the elements that make up the CP CPU Time per transaction bar from the previous chart. It is broken out into the following elements:
- Formal spin time is the time spent spinning waiting for CP locks that is captured in CP Monitor records.
- Non-formal spin time is time spent spinning waiting for CP locks that is not captured in CP Monitor records.
- Other CP is base CPU time (unrelated to MP lock contention).
Both the formal and non-formal spin time increase as the n-way increases. This is expected since lock contention will generally increase with more processors doing work and, as a result, competing for locks. Note that the non-formal spin time is much larger than the formal spin time and becomes more pronounced as the number of processors increases.
The rate of increase of the formal spin time is similar to the rate at which the non-formal spin time increases (as the size of the n-way is increased). This information can provide some insight regarding the amount of non-formal spin time that is incurred, since it is not captured in the monitor records.
Table 1 shows a summary of the data collected for
the 16-way, 18-way, 20-way, 22-way and 24-way measurements.
Table 1. Comparison of System Efficiency with Increasing N-Way
|
|
|
|
|
|
Tx/sec (n) ITR (h) | 1321.46 1321.99 | 1264.06 1264.57 | 1174.87 1175.34 | 1082.27 1082.81 | 998.04 998.54 |
Total Util/Proc (h) CP Util/Proc (h) Emul Util/Proc (h) | 99.96 16.80 83.17 | 99.96 17.35 82.62 | 99.96 20.01 79.95 | 99.95 21.63 78.32 | 99.95 24.80 75.15 |
Percent CP (h) | 16.8 | 17.4 | 20.0 | 21.6 | 24.8 |
Total msec/Tx (h) CP msec/Tx (h) Emul msec/Tx (h) | 18.155 3.050 15.104 | 18.979 3.293 15.686 | 20.419 4.088 16.331 | 22.165 4.797 17.367 | 24.034 5.963 18.070 |
Pct Spin Time (p) Sched Pct Spin Time (p) TRQ Pct Spin Time (p) | 5.721 4.854 0.827 | 6.041 5.178 0.798 | 7.826 6.901 0.874 | 7.414 6.522 0.848 | 6.733 5.928 0.754 |
Diagnose Rate (p) Diagnoses/Tx (p) | 25141 19.025 | 23847 18.865 | 22763 19.375 | 23885 22.069 | 23486 23.532 |
RATIOS |
|
|
|
|
|
Tx/sec (n) ITR (h) | 1.000 1.000 | 0.957 0.957 | 0.889 0.889 | 0.819 0.819 | 0.755 0.755 |
Total Util/Proc (h) CP Util/Proc (h) Emul Util/Proc (h) | 1.000 1.000 1.000 | 1.000 1.033 0.993 | 1.000 1.191 0.961 | 1.000 1.288 0.942 | 1.000 1.476 0.904 |
Percent CP (h) | 1.000 | 1.036 | 1.190 | 1.286 | 1.476 |
Total msec/Tx (h) CP msec/Tx (h) Emul msec/Tx (h) | 1.000 1.000 1.000 | 1.045 1.080 1.039 | 1.125 1.340 1.081 | 1.221 1.573 1.150 | 1.324 1.955 1.196 |
Pct Spin Time (p) Sched Pct Spin Time (p) TRQ Pct Spin Time (p) | 1.000 1.000 1.000 | 1.056 1.067 0.965 | 1.368 1.422 1.057 | 1.296 1.344 1.025 | 1.177 1.221 0.912 |
Diagnose Rate (p) Diagnoses/Tx (p) | 1.000 1.000 | 0.949 0.992 | 0.905 1.018 | 0.950 1.160 | 0.934 1.237 |
| Note: These measurements were done on a z990 machine in a non-paging environment with processor capping in effect to maintain processing capacity constant. The workload consisted of 100 zLinux guests performing Apache web serving. (h) = hardware instrumentation, (p) = Performance Toolkit | |||||
While the workload used for this evaluation resulted in a gradual decrease in system efficiency as the number of processors increased from 16 to 24 CPUs, the specific workload will have a significant effect on the efficiency with which z/VM can employ large numbers of processor engines.
As a general trend (not a conclusion from this evaluation), when z/VM is running in LPAR configurations with large numbers of CPUs, VM overhead will be lower for workloads with fewer, more CPU-intensive guests than for workloads with many, lightly loaded guests. Some workloads (such as CMS workloads) require master processor serialization. Workloads of this type will not be able to fully utilize large numbers of CPUs because of the bottleneck caused by the master processor serialization requirement. Also, application workloads that use virtual machines that are not capable of using multiple processors, such as DB2, SFS, and security managers (such as RACF), may be limited by one of those virtual machines before being able to fully utilize a large n-way configuration.
This evaluation focused on analyzing the effects of increasing the n-way configuration while holding processing power constant. In production environments, n-way increases will typically also result in processing capacity increases. Before exploiting large n-way configurations (more than 16 CPUs), the specific workload characteristics should be considered in terms of how it will perform with work dispatched across more CPUs as well as utilizing the larger processing capacity.
Footnotes:
- 1
- The breakout of central storage and expanded storage for this evaluation was arbitrary. Similar results are expected with other breakouts because the measurements were obtained in a non-paging environment.
Back to Table of Contents.
Emulated FBA on SCSI
Introduction
In z/VM 5.1.0, IBM introduced native z/VM support for SCSI disks. In this chapter of our report, we illustrate the performance of z/VM-owned SCSI disks as compared to other zSeries disk choices.
Prior to z/VM 5.1.0, z/VM let a guest operating system use SCSI disks in a manner that IBM has come to describe as guest native SCSI. In this technique, the system programmer attaches a Fibre Channel Protocol (FCP) device to the guest operating system. The guest then uses QDIO operations to communicate with the FCP device and thereby transmit orders to the SCSI disk subsystem. When it is using SCSI disks in this way, the guest is wholly responsible for managing its relationship with the SCSI hardware. z/VM perceives only that the guest is conducting QDIO activity with an FCP adapter.
In z/VM 5.1.0, z/VM itself supports SCSI volumes as emulated FBA disks. These emulated FBA disks can be attached to virtual machines, can hold user minidisks, or can be given to the Control Program for system purposes (e.g., paging). In all cases, the device owner uses traditional z/VM or zSeries DASD I/O techniques, such as Start Subchannel or one of the Diagnose instructions, to perform I/O to the emulated FBA volume. The Control Program intercepts these traditional I/O calls, uses its own FCP adapter to perform the corresponding SCSI I/O, and reflects I/O completion to the device owner. This is similar to what CP does for Virtual Disk in Storage (aka VDISK).
To measure the performance of emulated FBA devices, we crafted three experiments that put these disks to work in three distinct workloads.
- We gave a Linux guest a minidisk residing on an emulated FBA volume. We put an ext2 file system on the minidisk. We ran a publicly-available disk exerciser, iozone, against the ext2 file system. We compared the performance results to those achieved for other Linux disk choices, such as guest native SCSI, dedicated ECKD, and minidisk on ECKD.
- We gave a CMS guest a minidisk residing on an emulated FBA volume. We put a CMS file system on the minidisk. We ran an XEDIT loop that read a file from the minidisk over and over again. We compared the performance results to those achieved for running the XEDIT loop against a similar CMS file system on ECKD.
- We attached an emulated FBA volume to CP as paging space. We ran a z/VM workload that induced paging. We compared the performance results to those achieved for an ECKD paging volume.
Measurement Environment
All experiments were run on the same basic test environment, which was configured as follows:
- LPAR of 2064-109, 2 GB real, 0 GB XSTORE, one engine dedicated, all other LPARs idling.
- z/VM 5.1.0 Control Program module.
- ECKD volumes were on an ESCON-attached 2105-F20.
- SCSI volumes were on an FCP-attached 2105-F20.
Linux iozone Experiment
In this experiment, we set up a Linux virtual machine on z/VM. We attached an assortment of disk volumes to the Linux virtual machine. We ran the disk exerciser iozone on each volume. We compared key performance metrics across volume types. When applicable, runs were done with minidisk caching (MDC) on and off.
The configuration was:
- 192 MB Linux guest, virtual uniprocessor, V=V.
- Linux SLES 8 SP 3, 31-bit, ext2 file systems.
- Minidisks and ext2 file systems were formatted with 4 KB blocks.
- We used iozone 3.217 with the following parameters:
- Ballast file 819200 KB.
- Record size 64 KB.
- Processor cache size set to 1024 Kbytes.
- Processor cache line size set to 256 bytes.
- File stride size set to 17 * record size.
- Throughput test with 1 process.
- Include fsync in write timing.
A "transaction" was defined as all four iozone phases combined, done over 1% of ballast file size (in other words, by definition, we did 8192 transactions in each iozone run).
For each run, we assessed performance using the following metrics:
Metric | Meaning |
IW | iozone "initial write" data rate (KB/sec). |
RW | iozone "rewrite" data rate (KB/sec). |
IR | iozone "initial read" data rate (KB/sec). |
RR | iozone "reread" data rate (KB/sec). |
CP/tx | CP processor time per transaction (microseconds (usec), obtained via zSeries hardware instrumentation). |
Virt/tx | Virtual machine processor time per transaction (microseconds (usec), obtained via zSeries hardware instrumentation). |
Total/tx | Total machine processor time per transaction (microseconds (usec), sum of CP/tx and virt/tx). |
Vio/tx | Virtual I/Os per transaction (obtained via CP INDICATE USER * EXP). |
CP/vio | CP processor time per virtual I/O (quotient CP/tx / Vio/tx). |
Virt/vio | Virtual machine processor time per virtual I/O (quotient Virt/tx / Vio/tx). |
Total/vio | Total machine processor time per virtual I/O (microseconds (usec), sum of CP/vio and virt/vio). |
Table 1 cites the results.
Figure 1 and Figure 2 chart key
measurements.
| Run Name | SLN9 | SFB9 | SFB0 | ECKD | EMDK | EMD0 |
| Run Type | Native SCSI | Minidisk on emulated FBA on SCSI, MDC | Minidisk on emulated FBA on SCSI, no MDC | Dedicated ECKD | Minidisk on ECKD, MDC | Minidisk on ECKD, no MDC |
| IW (KB/s) | 40038.83 | 16305.67 | 16341.82 | 9773.91 | 9688.77 | 9734.89 |
| RW (KB/s) | 40163.31 | 16299.17 | 16308.30 | 9769.19 | 9775.33 | 9758.36 |
| IR (KB/s) | 57217.09 | 17441.24 | 16159.12 | 11670.38 | 8225.54 | 11670.25 |
| RR (KB/s) | 57426.30 | 163776.33 | 16157.78 | 11670.32 | 220806.83 | 11670.66 |
| CP/tx (usec) | 345.64 | 2329.99 | 2950.21 | 289.29 | 403.23 | 289.89 |
| Virt/tx (usec) | 2797.47 | 2605.88 | 2714.83 | 2479.79 | 2492.53 | 2474.17 |
| Total/tx (usec) | 3143.11 | 4935.87 | 5665.04 | 2769.08 | 2895.76 | 2764.06 |
| Vio/tx | na | 3.56 | 3.62 | 0.87 | 0.94 | 0.86 |
| CP/vio (usec) | na | 658.24 | 818.69 | 348.27 | 438.45 | 347.84 |
| Virt/vio (usec) | na | 732.68 | 750.41 | 2866.44 | 2638.09 | 2869.66 |
| Total/vio (usec) | na | 1390.92 | 1569.1 | 3214.71 | 3076.54 | 3217.5 |
| Note: 2064-109, z/VM 5.1.0, Linux SLES 8 SP3, iozone. See text for additional configuration details. | ||||||
Figure 1. Linux iozone CPU Consumption. CP and virtual time per transaction for Linux iozone workloads. SLN9 is native Linux SCSI. SFB9 is emulated FBA, MDC. SFB0 is emulated FBA, no MDC. ECKD is dedicated ECKD. EMDK is ECKD minidisk, MDC. EMD0 is ECKD minidisk, no MDC.
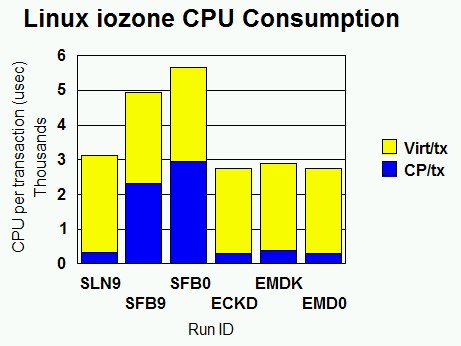 |
Figure 2. Linux iozone CPU Consumption. CP and virtual time per virtual I/O for Linux iozone workloads. SLN9 is native Linux SCSI. SFB9 is emulated FBA, MDC. SFB0 is emulated FBA, no MDC. ECKD is dedicated ECKD. EMDK is ECKD minidisk, MDC. EMD0 is ECKD minidisk, no MDC.
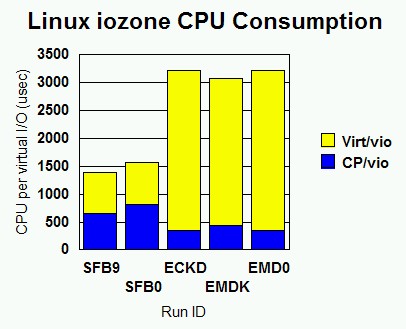 |
For the SLN9 run, the VIO metrics are marked "na" because Linux's interaction with its FCP adapter does not count as virtual I/O. (QDIO activity to the FCP adapter does not count as virtual I/O. Only Start Subchannel and diagnose I/O count as virtual I/O.)
The Linux FBA driver does about 4 times as many virtual I/Os per transaction as the Linux ECKD driver does. This suggests opportunity for improvement in the Linux FBA driver.
The ECKD runs tend to show about 8% less virtual time per transaction than the emulated FBA runs and the native SCSI runs. The Linux ECKD driver seems to be the most efficient device driver for this workload. We did not profile the Linux guest so as to investigate this further.
The MDC ON runs (SFB9 and EMDK) show interesting results as regards CP processor time. For emulated FBA, MDC ends up saving CP time per transaction. In other words, MDC is a processing shortcut compared to the normal emulated FBA path. For an ECKD minidisk, MDC uses a little extra CP time per transaction. This shows how well optimized CP is for ECKD I/O and echoes previous assessments of MDC. Note both run pairs show MDC's benefit as regards data rate on re-read.
Sanity checks: ECKD compared to EMD0 should be nearly dead-even, and it is. EMDK shows a little higher CP time per transaction than ECKD and EMD0. This makes sense given the overhead of maintaining the minidisk cache.
Comparing SLN9 to SFB0 shows the cost of the z/VM FBA emulation layer and its imported SCSI driver. When z/VM manages the SCSI disk, data rates drop off dramatically and CP time per transaction rises substantially.
Per amount of data moved, emulated FBA is expensive in terms of Control Program (CP) CPU time. We see a ratio of 9.87, comparing SFB0 to EMD0. Keep in mind that some of this expense comes from the base cost of doing a virtual I/O. Compared to EMD0, SFB0 incurs four times as much of this base cost, because Linux emits four times as many virtual I/Os to move a given amount of data. But even per virtual I/O, emulated FBA is still expensive in CP processor time. SFB0 used 2.35 times as much CP time per virtual I/O as EMD0 did.
Keep in mind that it is not really fair to use these measurements to compare ECKD data rates to SCSI data rates. The ECKD volumes we used are ESCON-attached whereas the SCSI volumes are FCP-attached. The FCP channel offers a much higher data rate (100 MB/sec) than the ESCON channel (17 MB/sec). Because the 2105-F20 is heavily cached, channel speed does make a difference in net data rate.
XEDIT Loop Experiment
In this experiment, we set up a CMS virtual machine on z/VM. We attached a minidisk to the virtual machine. The minidisk was either ECKD or emulated FBA on SCSI. We ran a Rexx exec that contained an XEDIT command inside a loop. The XEDIT command read our ballast file.
The configuration was:
- 64 MB CMS guest, virtual uniprocessor, V=V.
- CMS file system, formatted in 4 KB blocks.
- Ballast file is 5110 F-80 records (100 4 KB blocks).
A "transaction" was defined as stacking a QQUIT and then issuing the CMS XEDIT command so as to read the ballast file into memory.
We varied MDC settings across different runs so that we could see the effect of MDC on key performance metrics. Settings we used were:
- MDC OFF for the minidisk.
- MDC ON for the minidisk.
- MDC ON for the minidisk, but we issued CP SET MDC FLUSH for the minidisk immediately after each CMS XEDIT command, so as to ensure an MDC miss the next time XEDIT tried to read our file.
For each run, we assessed performance using the following metrics:
Metric | Meaning |
Tx/sec | Transactions per second |
CP/tx | CP processor time per transaction (microseconds (usec), obtained via zSeries hardware instrumentation). |
Virt/tx | Virtual machine processor time per transaction (microseconds (usec), obtained via zSeries hardware instrumentation). |
Total/tx | Total machine processor time per transaction (microseconds (usec), sum of CP/tx and virt/tx). |
Vio/tx | Virtual I/Os per transaction (obtained via CP monitor data). |
CP/vio | CP processor time per virtual I/O (quotient CP/tx / Vio/tx). |
Virt/vio | Virtual machine processor time per virtual I/O (quotient Virt/tx / Vio/tx). |
Total/vio | Total machine processor time per virtual I/O (microseconds (usec), sum of CP/vio and virt/vio). |
Table 2 cites the results.
Figure 3
charts key findings.
| Run Name | SCSI4KXI | 33904KX5 | SCSI4KXK | 33904KX7 | SCSI4KXJ | 33904KX6 |
| Run Type | Emulated FBA on SCSI, MDC ON. | ECKD, MDC ON. | Emulated FBA on SCSI, MDC ON, forced MDC miss. | ECKD, MDC ON, forced MDC miss. | Emulated FBA on SCSI, MDC OFF. | ECKD, MDC OFF. |
| Tx/sec | 476.82 | 474.86 | 34.75 | 428.84 | 6.38 | 27.74 |
| CP/tx (usec) | 1460.91 | 1474.56 | 6202.66 | 1663.23 | 22457.69 | 1199.68 |
| Virt/tx (usec) | 635 | 630.14 | 706.48 | 667.06 | 728.84 | 645.28 |
| Total/tx (usec) | 2095.91 | 2104.7 | 6909.14 | 2330.29 | 23186.53 | 1844.96 |
| Vio/tx | 2 | 2 | 2 | 2 | 2 | 2 |
| CP/vio (usec) | 730.455 | 737.28 | 3101.33 | 831.615 | 11228.845 | 599.84 |
| Virt/vio (usec) | 317.5 | 315.07 | 353.24 | 333.53 | 364.42 | 322.64 |
| Total/vio (usec) | 1047.955 | 1052.35 | 3454.57 | 1165.145 | 11593.265 | 922.48 |
| Note: 2064-109, z/VM 5.1.0, XEDIT reads. See text for additional configuration details. | ||||||
Figure 3. XEDIT Loop CPU Consumption. CP and virtual time per transaction for the XEDIT loops. SCSI4KXI is emulated FBA, MDC ON. 33904KX5 is ECKD MDC ON. SCSI4KXK is emulated FBA, MDC ON, forced MDC miss. 33904KX7 is ECKD MDC ON, forced MDC miss. SCSI4KXJ is emulated FBA, MDC OFF. 33904KX6 is ECKD MDC OFF.
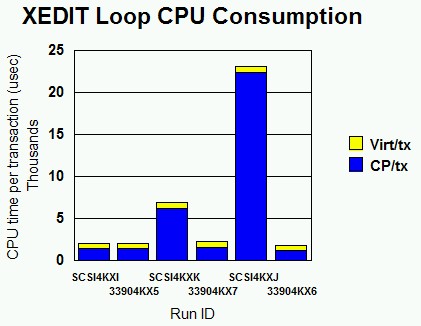 |
Runs SCSI4KXJ and 33904KX6 (MDC OFF) illustrate the raw performance difference between ECKD and emulated FBA on SCSI in this workload. Since MDC is OFF in these runs, what we are seeing is the difference in overhead between CP's driving of the SCSI LUN and its driving of an ECKD device using conventional zSeries I/O. For SCSI, the CP time per transaction is about 18.7 times that of ECKD. Transaction rate suffers accordingly, experiencing a 77% drop. Emulated FBA would be a poor choice for CMS data storage in situations where MDC offers no leverage, unless I/O rates were low.
The SCSI4KXI and 33904KX5 runs (MDC ON) illustrate the benefit of MDC for both kinds of minidisks. Transaction rates are high and about equal, which is what we would expect. Similarly, processor times per transaction are low and about equal. This experiment implies that emulated FBA might be a good choice for large minidisk volumes that are very read-intensive, such as tools disks or document libraries. Such applications would take advantage of the large volume sizes possible with emulated FBA while letting MDC cover for the long path lengths associated with the actual I/O to the 2105.
Paging Experiment
In this experiment, we set up a single CMS guest running a Rexx exec. This exec, RXTHRASH, used the Rexx storage() function to write virtual machine pages in a random fashion. We used CP LOCK to lock other virtual machines' frames into real storage, so as to leave a controlled number of real frames for pages being touched by the thrasher. In this way, we induced paging in a controlled fashion. We paged either to ECKD or to emulated FBA on SCSI.
The configuration was:
- 2048 MB CMS guest, virtual uniprocessor, V=V.
- RXTHRASH program, writing randomly over 486000 pages.
- Storage constrained via CP LOCK of other guests' pages, same CP LOCK configuration for each experiment.
- All other guests quiesced.
A "transaction" was defined as a CP paging operation. Thus, transaction rate is just the CP paging rate.
For each run, we assessed performance using the following metrics:
Metric | Meaning |
Tx/sec | Transactions per second |
CP/tx | CP processor time per transaction (microseconds (usec), obtained via zSeries hardware instrumentation). |
Virt/tx | Virtual machine processor time per transaction (microseconds (usec), obtained via zSeries hardware instrumentation). |
Total/tx | Total machine processor time per transaction (microseconds (usec), sum of CP/tx and virt/tx). |
Table 3 cites the results.
Figure 4 charts key findings.
| Run Name | SCSIPG04 | 3390PG02 |
| DASD Type | Emulated FBA on SCSI | ECKD |
| Paging rate | 564 | 1376 |
| CP/tx (usec) | 217.02 | 11.55 |
| Virt/tx (usec) | 38.26 | 32.87 |
| Total/tx (usec) | 255.28 | 44.42 |
| Note: 2064-109, z/VM 5.1.0, RXTHRASH paging inducer. See text for additional configuration details. | ||
Figure 4. RXTHRASH CPU Consumption. Processor time per page fault for the RXTHRASH experiments. SCSIPG04 is emulated FBA. 3390PG02 is ECKD.
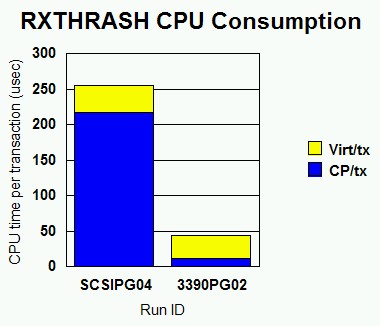 |
Like the XEDIT-with-MDC-OFF experiment, this measurement shows how expensive emulated FBA on SCSI truly is in terms of CP processor time per transaction. In this paging experiment, SCSI page faults cost 18.8 times as much in CPU as ECKD faults did. This result aligns very closely with the 18.7 ratio we saw in the XEDIT MDC OFF runs.
Because of this high processor cost, we can recommend emulated FBA as a paging volume only in situations where the z/VM system can absorb the high processor cost. If processor utilization were very low, or if paging rates were very low, emulated FBA might be a good choice for a paging volume. Note that the potential for emulated FBA volumes to be very large is not necessarily a good reason to employ them for paging. For the sake of I/O parallelism it is usually better to have several small paging volumes (3390-3s, at about 2 GB each) rather than one large one (a 3390-9 or a large emulated FBA volume). Customers contemplating SCSI-only environments will need to think carefully about processor sizings and paging volume configurations prior to running memory-constrained workloads.
Conclusions
Emulated FBA on SCSI is a good data storage choice in situations where the amount of data to be stored is large and processor time used per actual I/O is not critical. Emulated FBA minidisks can be very large, up to 1024 GB in size. This far exceeds the size of the largest ECKD volumes. High processor cost might be of no consequence to the customer if the CPU is currently lightly utilized or if the I/O rate to the emulated FBA volumes is low. Document libraries, tools disks, and data archives come to mind as possible applications of emulated FBA. If the data are read frequently, Minidisk Cache (MDC) can help reduce the processor cost of I/O by avoiding I/Os.
Customers for whom processor utilization is already an issue, or for whom high transaction rates are required, need to think carefully about using emulated FBA. z/VM Control Program (CP) processor time per I/O is much greater for emulated FBA than it is for ECKD. This gulf causes corresponding drops in achievable transaction rate.
Linux customers having large read-only ext2 file systems (tools repositories) would do well to put them on a read-only shared minidisk that resides on an emulated FBA volume. This approach lets the Linux systems share a large amount (1024 GB) of data on a single volume and lets z/VM minidisk cache guard against excessive processor consumption. Customers taking this approach will want to configure enough storage for z/VM so that its minidisk cache will be effective.
Linux customers wishing to get the very best performance from their SCSI volumes should consider assigning FCP devices to their Linux guests and letting Linux do the SCSI I/O. This configuration offers the highest data rates to the disks at processor consumption costs comparable to ECKD. Unfortunately, this configuration requires that each SCSI LUN be wholly dedicated to a single Linux guest. The 2105's LUN configuration capabilities do ease this situation somewhat.
The workloads we used to measure the performance difference between ECKD and SCSI are specifically crafted so that they are very intensive on disk I/O and very light on all other kinds of work. A more precise way to say this is that per transaction, the fraction of CPU time consumed for actually driving the disk approaches 100% of all the CPU time used. Such a workload is necessary so as to isolate the performance differences in these two kinds of disk technologies. Workloads that contain significant burden in other functional areas (for example, networking, thread switching, or memory management) will not illustrate disk I/O performance differences quite as vividly as workloads specifically designed to measure only the cost of the disk technology. In fact, workloads that do very little disk I/O will not illustrate disk I/O performance differences much at all, and more important, such workloads will not benefit from changing the disk technology they use. In considering whether to move his workload from ECKD to SCSI, the customer must evaluate the degree to which his workload's transaction rate (or transaction cost) is dependent on the disk technology employed. He must then use his own judgment about whether changing the disk technology will result in an overall performance improvement that is worth the migration cost.
Back to Table of Contents.
Internet Protocol Version 6 Support
z/VM V4.4 provided Internet Protocol Version 6 (IPv6) support, in CP, for OSA-Express guest LANs operating in QDIO mode. (Note that this support does not apply to guest LANs operating in HIPER mode.) z/VM V5.1 enhances its IPv6 support, in TCP/IP, by allowing the stack to be configured for IPv6 networks connected through OSA-Express operating in QDIO mode. The stack can be configured to provide static routing of IPv6 packets and to send IPv6 router advertisements.
This section summarizes measurement results comparing IPv6 to IPv4 and comparing IPv4 to IPv4 over devices defined as IPv6 capable. Measurements were done using guest LAN and using OSA-Express Gigabit Ethernet cards. Additional IPv6 to IPv4 comparisons for the case of communication between Linux systems via z/VM Virtual Switch using the Layer2 transport mode are provided in Virtual Switch Layer 2 Support.
Methodology: An internal version of the Application Workload Modeler (AWM) was used to drive request-response (RR), connect-request-response (CRR) and streaming (STR) workloads. The request-response workload consisted of the client sending 200 bytes to the server and the server responding with 1000 bytes. This interaction was repeated for 200 seconds. The connect-request-response workload had the client connecting, sending 64 bytes to the server, the server responding with 8K and the client then disconnecting. This same sequence was repeated for 200 seconds. The streaming workload consisted of the client sending 20 bytes to the server and the server responding with 20MB. This sequence was repeated for 400 seconds.
A complete set of runs, consisting of 3 trials for each case, for 1, 10, 20 and 50 client-server pairs, was done with the maximum transmission unit (MTU) set to 1492 and 8992.
The measurements were done on a 2064-109 with 3 dedicated processors in each LPAR used. Each LPAR had 1GB of central storage and 2GB expanded storage. CP monitor data was captured for one LPAR (client side) during the measurement and reduced using the Performance Toolkit (Perfkit).
Figure 1. Guest LAN Environment
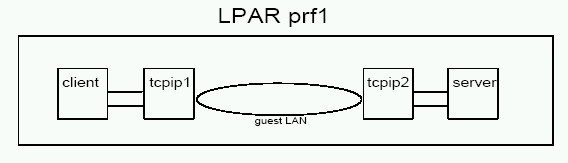 |
Figure 2. OSA QDIO Environment
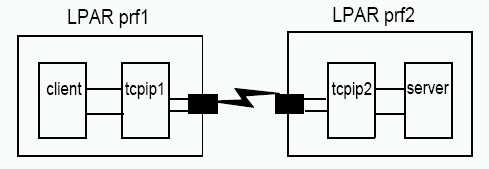 |
Figure 1 shows the measurement environment for guest LAN where the client communicates with its stack (tcpip1), the client stack sends the request over a guest LAN to the server stack (tcpip2), which then sends the request to the server. Figure 2 shows the measurement environment for OSA-Express where the client communicates with its stack (tcpip1), the client stack sends the request over the OSA-Express card to the server stack (tcpip2) in another LPAR, and the server stack then sends the request to the server.
Results: The following tables compare the average of 3 trials for each measurement between IPv4 and IPv4 over IPv6 capable devices (noted as v5 in the tables), and between IPv4 and IPv6. The numbers shown are the percent increase (or decrease) relative to IPv4. A positive number for throughput (either MB/sec or trans/sec) is good and a negative number for CPU time is good. Our target was for IPv6 to be within 3% of the throughput and CPU time for IPv4. For guest LAN, this was true for all workloads. For the OSA Express GigaBit Ethernet card (noted as QDIO in the tables) this is not true for the STR and CRR workloads when the MTU size is 1492.
- For streaming, throughput was 10% to 19% less for IPv4 over IPv6 capable devices and 12% to 25% less for IPv6. CPU time was 10% to 40% higher for IPv4 over IPv6 and 11% to 40% higher for IPv6.
- For CRR, throughput for both IPv4 over IPv6 capable devices and for IPv6 met our target overall. However, CPU time was 3% to 5% higher for IPv4 over IPv6 capable and 12% to 13% higher for IPv6.
Number of clients | 1 | 10 | 20 | 50 |
MTU 1492 runid V4 MB/sec Total CPU msec/MB Emul CPU msec/MB CP CPU msec/MB |
|
|
|
|
runid V5 MB/sec Total CPU msec/MB Emul CPU msec/MB CP CPU msec/MB | vg5sn01 77.23 24.78 13.28 11.50 | vg5sn10 57.97 31.14 17.48 13.66 | vg5sn20 48.03 37.20 21.34 15.86 | vg5sn50 37.97 48.31 27.68 20.63 |
runid V6 MB/sec Total CPU msec/MB Emul CPU msec/MB CP CPU msec/MB | vg6sn01 75.10 24.48 12.98 11.49 | vg6sn10 56.57 31.38 17.45 13.93 | vg6sn20 47.77 37.56 21.35 16.20 | vg6sn50 38.50 47.97 27.53 20.44 |
%diff V4 to V5 |
|
|
|
|
MB/sec Total CPU msec/MB Emul CPU msec/MB CP CPU msec/MB | 0% 0% 0% 0% | 3% -1% -1% -1% | 1% -1% -1% 0% | -1% 0% 0% 1% |
%diff V4 to V6 |
|
|
|
|
MB/sec Total CPU msec/MB Emul CPU msec/MB CP CPU msec/MB | -3% -2% -3% 0% | 0% 0% -1% 1% | 0% 0% -1% 2% | 1% 0% -1% 0% |
MTU 8992 runid V4 MB/sec Total CPU msec/MB Emul CPU msec/MB CP CPU msec/MB |
|
|
|
|
runid V5 MB/sec Total CPU msec/MB Emul CPU msec/MB CP CPU msec/MB | vg5sj01 103.93 19.35 9.38 9.97 | vg5sj10 111.43 23.33 11.44 11.89 | vg5sj20 93.63 27.11 13.61 13.50 | vg5sj50 74.90 32.00 16.10 15.90 |
runid V6 MB/sec Total CPU msec/MB Emul CPU msec/MB CP CPU msec/MB | vg6sj01 104.53 18.80 8.91 9.89 | vg6sj10 114.83 22.52 10.82 11.70 | vg6sj20 95.10 26.72 13.21 13.51 | vg6sj50 75.50 31.83 15.89 15.93 |
% diff V4 to V5 |
|
|
|
|
MB/sec Total CPU msec/MB Emul CPU msec/MB CP CPU msec/MB | 0% 2% 2% 2% | -1% 2% 2% 2% | 0% 1% 1% 1% | 0% 0% 0% 0% |
% diff V4 to V6 |
|
|
|
|
MB/sec Total CPU msec/MB Emul CPU msec/MB CP CPU msec/MB | 1% 1% 0% 3% | 2% -2% -4% 0% | 1% -1% -2% 1% | 1% -1% -1% 0% |
| Note: 2064-109; z/VM 5.1.0; TCP/IP 510; V5 denotes IPv4 over IPv6 capable | ||||
Number of clients | 1 | 10 | 20 | 50 |
|---|---|---|---|---|
MTU 1492 runid V4 trans/sec Total CPU msec/trans Emul CPU msec/trans CP CPU msec/trans |
|
|
|
|
runid V5 trans/sec Total CPU msec/trans Emul CPU msec/trans CP CPU msec/trans | vg5cn01 164.23 6.25 5.08 1.17 | vg5cn10 421.82 4.54 3.49 1.05 | vg5cn20 475.38 4.10 3.09 1.02 | vg5cn50 571.86 3.97 2.86 1.11 |
runid V6 trans/sec Total CPU msec/trans Emul CPU msec/trans CP CPU msec/trans | vg6cn01 208.06 4.91 3.74 1.17 | vg6cn10 433.58 4.48 3.42 1.06 | vg6cn20 485.52 4.08 3.05 1.02 | vg6cn50 582.96 3.95 2.85 1.10 |
% diff V4 to V5 |
|
|
|
|
trans/sec Total CPU msec/trans Emul CPU msec/trans CP CPU msec/trans | 1% -1% -1% 0% | 0% 0% 0% 0% | 0% 0% 0% 0% | 0% 0% 0% 1% |
% diff V4 to V6 |
|
|
|
|
trans/sec Total CPU msec/trans Emul CPU msec/trans CP CPU msec/trans | 28% -22% -27% 0% | 3% -1% -2% 1% | 2% -1% -1% 1% | 2% -1% -1% 0% |
MTU 8992 runid V4 trans/sec Total CPU msec/trans Emul CPU msec/trans CP CPU msec/trans |
|
|
|
|
runid V5 trans/sec Total CPU msec/trans Emul CPU msec/trans CP CPU msec/trans | vg5cj01 168.00 6.09 5.07 1.02 | vg5cj10 442.18 4.72 3.80 0.91 | vg5cj20 501.64 3.95 3.08 0.87 | vg5cj50 574.22 3.83 2.86 0.97 |
runid V6 trans/sec Total CPU msec/trans Emul CPU msec/trans CP CPU msec/trans | vg6cj01 216.95 4.72 3.70 1.02 | vg6cj10 479.68 4.01 3.10 0.91 | vg6cj20 529.28 3.64 2.76 0.87 | vg6cj50 615.28 3.45 2.50 0.95 |
% diff V4 to V5 |
|
|
|
|
trans/sec Total CPU msec/trans Emul CPU msec/trans CP CPU msec/trans | 0% 0% 1% -1% | 1% 0% 0% 0% | 0% 0% 0% 0% | 1% 0% -1% 1% |
% diff V4 to V6 |
|
|
|
|
trans/sec Total CPU msec/trans Emul CPU msec/trans CP CPU msec/trans | 29% -22% -27% -1% | 9% -15% -18% 0% | 6% -8% -11% 1% | 8% -10% -13% -1% |
| Note: 2064-109; z/VM 5.1.0; TCP/IP 510; V5 denotes IPv4 over IPv6 capable | ||||
Number of clients | 1 | 10 | 20 | 50 |
MTU 1492 runid V4 trans/sec Total CPU msec/trans Emul CPU msec/trans CP CPU msec/trans |
|
|
|
|
runid V5 trans/sec Total CPU msec/trans Emul CPU msec/trans CP CPU msec/trans | vg5rn01 1341.23 1.08 0.69 0.39 | vg5rn10 2798.36 0.98 0.65 0.33 | vg5rn20 2797.05 0.97 0.65 0.31 | vg5rn50 2730.91 1.01 0.70 0.32 |
runid V6 trans/sec Total CPU msec/trans Emul CPU msec/trans CP CPU msec/trans | vg6rn01 1340.28 1.10 0.71 0.40 | vg6rn10 2770.68 0.99 0.66 0.33 | vg6rn20 2774.36 0.98 0.66 0.32 | vg6rn50 2715.20 1.02 0.70 0.32 |
% diff V4 to V5 |
|
|
|
|
trans/sec Total CPU msec/trans Emul CPU msec/trans CP CPU msec/trans | 0% -2% -1% -2% | 0% 0% 0% 0% | 0% 0% 0% 0% | 0% 0% 0% 0% |
% diff V4 to V6 |
|
|
|
|
trans/sec Total CPU msec/trans Emul CPU msec/trans CP CPU msec/trans | 0% 1% 1% -1% | -1% 1% 1% 0% | -1% 1% 1% 0% | -1% 0% 1% 0% |
MTU 8992 runid V4 trans/sec Total CPU msec/trans Emul CPU msec/trans CP CPU msec/trans |
|
|
|
|
runid V5 trans/sec Total CPU msec/trans Emul CPU msec/trans CP CPU msec/trans | vg5rj01 1340.51 1.09 0.69 0.39 | vg5rj10 2796.73 0.98 0.65 0.32 | vg5rj20 2789.85 0.97 0.66 0.32 | vg5rj50 2717.61 1.02 0.70 0.32 |
runid V6 trans/sec Total CPU msec/trans Emul CPU msec/trans CP CPU msec/trans | vg6rj01 1340.78 1.09 0.69 0.39 | vg6rj10 2793.82 0.98 0.65 0.33 | vg6rj20 2789.51 0.97 0.65 0.32 | vg6rj50 2726.55 1.01 0.70 0.32 |
% diff V4 to V5 |
|
|
|
|
trans/sec Total CPU msec/trans Emul CPU msec/trans CP CPU msec/trans | 0% 0% 0% -1% | 0% 0% 0% 0% | 0% 0% 0% 0% | 1% -1% -1% 0% |
% diff V4 to V6 |
|
|
|
|
trans/sec Total CPU msec/trans Emul CPU msec/trans CP CPU msec/trans | 0% 0% 0% -1% | 0% 0% 0% 0% | 0% 0% 0% 0% | 1% -1% -1% -1% |
| Note: 2064-109; z/VM 5.1.0; TCP/IP 510; V5 denotes IPv4 over IPv6 capable | ||||
Number of clients | 1 | 10 | 20 | 50 |
MTU 1492 runid V4 MB/sec Total CPU msec/MB Emul CPU msec/MB CP CPU msec/MB |
|
|
|
|
runid V5 MB/sec Total CPU msec/MB Emul CPU msec/MB CP CPU msec/MB | vq5sn01 71.33 12.85 8.68 4.17 | vq5sn10 68.17 18.15 12.16 5.99 | vq5sn20 69.07 21.21 14.22 6.99 | vq5sn50 69.07 24.91 16.54 8.37 |
runid V6 MB/sec Total CPU msec/MB Emul CPU msec/MB CP CPU msec/MB | vq6sn01 59.30 13.01 8.84 4.17 | vq6sn10 71.07 17.91 12.02 5.90 | vq6sn20 69.63 21.16 14.21 6.96 | vq6sn50 70.80 24.56 16.45 8.11 |
% diff V4 to V5 |
|
|
|
|
MB/sec Total CPU msec/MB Emul CPU msec/MB CP CPU msec/MB | -10% 10% 14% 3% | -19% 39% 45% 28% | -14% 40% 46% 30% | -14% 37% 41% 30% |
% diff V4 to V6 |
|
|
|
|
MB/sec Total CPU msec/MB Emul CPU msec/MB CP CPU msec/MB | -25% 11% 16% 3% | -16% 37% 43% 26% | -14% 40% 46% 30% | -12% 35% 40% 26% |
MTU 8992 runid V4 MB/sec Total CPU msec/MB Emul CPU msec/MB CP CPU msec/MB |
|
|
|
|
runid V5 MB/sec Total CPU msec/MB Emul CPU msec/MB CP CPU msec/MB | vq5sj01 115.10 9.42 5.75 3.67 | vq5sj10 117.90 12.60 7.79 4.80 | vq5sj20 117.83 13.00 8.05 4.96 | vq5sj50 104.53 13.98 8.32 5.65 |
runid V6 MB/sec Total CPU msec/MB Emul CPU msec/MB CP CPU msec/MB | vq6sj01 115.03 9.43 5.77 3.66 | vq6sj10 117.70 12.29 7.58 4.72 | vq6sj20 117.57 12.54 7.74 4.80 | vq6sj50 106.07 13.51 7.92 5.59 |
% diff V4 to V5 |
|
|
|
|
MB/sec Total CPU msec/MB Emul CPU msec/MB CP CPU msec/MB | 0% 1% 2% 0% | 0% 1% 2% 0% | 0% 2% 3% 1% | -2% 4% 6% 1% |
% diff V4 to V6 |
|
|
|
|
MB/sec Total CPU msec/MB Emul CPU msec/MB CP CPU msec/MB | 0% 1% 2% 0% | 0% -1% -1% -2% | 0% -1% -1% -2% | 0% 1% 1% 0% |
| Note: 2064-109; z/VM 5.1.0; TCP/IP 510; V5 denotes IPv4 over IPv6 capable | ||||
Number of clients | 1 | 10 | 20 | 50 |
MTU 1492 runid V4 trans/sec Total CPU msec/trans Emul CPU msec/trans CP CPU msec/trans |
|
|
|
|
runid V5 trans/sec Total CPU msec/trans Emul CPU msec/trans CP CPU msec/trans | vq5cn01 141.88 2.04 1.45 0.58 | vq5cn10 434.73 2.00 1.43 0.58 | vq5cn20 522.55 1.98 1.41 0.57 | vq5cn50 675.16 2.04 1.47 0.57 |
runid V6 trans/sec Total CPU msec/trans Emul CPU msec/trans CP CPU msec/trans | vq6cn01 151.83 2.19 1.56 0.63 | vq6cn10 446.06 2.16 1.54 0.62 | vq6cn20 537.74 2.15 1.54 0.62 | vq6cn50 661.57 2.24 1.58 0.66 |
% diff V4 to V5 |
|
|
|
|
trans/sec Total CPU msec/trans Emul CPU msec/trans CP CPU msec/trans | -4% 4% 3% 5% | -1% 4% 3% 6% | 1% 5% 4% 6% | 3% 3% 3% 2% |
% diff V4 to V6 |
|
|
|
|
trans/sec Total CPU msec/trans Emul CPU msec/trans CP CPU msec/trans | 3% 12% 11% 14% | 1% 12% 11% 14% | 4% 13% 13% 14% | 1% 13% 11% 18% |
MTU 8992 runid V4 trans/sec Total CPU msec/trans Emul CPU msec/trans CP CPU msec/trans |
|
|
|
|
runid V5 trans/sec Total CPU msec/trans Emul CPU msec/trans CP CPU msec/trans | vq5cj01 158.15 1.57 1.13 0.44 | vq5cj10 435.97 2.03 1.60 0.43 | vq5cj20 514.56 2.03 1.61 0.43 | vq5cj50 648.80 2.05 1.58 0.47 |
runid V6 trans/sec Total CPU msec/trans Emul CPU msec/trans CP CPU msec/trans | vq6cj01 179.05 1.71 1.22 0.50 | vq6cj10 460.01 1.65 1.25 0.40 | vq6cj20 539.64 1.60 1.19 0.41 | vq6cj50 725.19 1.90 1.45 0.44 |
% diff V4 to V5 |
|
|
|
|
trans/sec Total CPU msec/trans Emul CPU msec/trans CP CPU msec/trans | -2% 1% 2% 0% | 0% 0% 0% 0% | -1% 0% 0% 0% | -5% 7% 7% 6% |
% diff V4 to V6 |
|
|
|
|
trans/sec Total CPU msec/trans Emul CPU msec/trans CP CPU msec/trans | 11% 10% 9% 12% | 5% -18% -22% -6% | 4% -21% -26% -5% | 6% -2% -2% 0% |
| Note: 2064-109; z/VM 5.1.0; TCP/IP 510; V5 denotes IPv4 over IPv6 capable | ||||
Number of clients | 1 | 10 | 20 | 50 |
MTU 1492 runid V4 trans/sec Total CPU msec/trans Emul CPU msec/trans CP CPU msec/trans |
|
|
|
|
runid V5 trans/sec Total CPU msec/trans Emul CPU msec/trans CP CPU msec/trans | vq5rn01 1011.29 0.51 0.35 0.16 | vq5rn10 2612.15 0.47 0.33 0.15 | vq5rn20 3098.32 0.48 0.33 0.15 | vq5rn50 3835.60 0.51 0.36 0.15 |
runid V6 trans/sec Total CPU msec/trans Emul CPU msec/trans CP CPU msec/trans | vq6rn01 1008.28 0.50 0.35 0.16 | vq6rn10 2604.14 0.47 0.33 0.15 | vq6rn20 2588.53 0.48 0.33 0.15 | vq6rn50 3886.89 0.51 0.36 0.15 |
% diff V4 to V5 |
|
|
|
|
trans/sec Total CPU msec/trans Emul CPU msec/trans CP CPU msec/trans | 2% -2% -1% -2% | 0% -1% -1% 0% | 0% 0% 0% 1% | 0% 0% 0% 1% |
% diff V4 to V6 |
|
|
|
|
trans/sec Total CPU msec/trans Emul CPU msec/trans CP CPU msec/trans | 2% -2% -1% -4% | 0% -1% -1% -2% | -16% 0% 0% 0% | 2% 0% 0% 0% |
MTU 8992 runid V4 trans/sec Total CPU msec/trans Emul CPU msec/trans CP CPU msec/trans |
|
|
|
|
runid V5 trans/sec Total CPU msec/trans Emul CPU msec/trans CP CPU msec/trans | vq5rj01 1013.60 0.50 0.34 0.15 | vq5rj10 2627.53 0.47 0.32 0.15 | vq5rj20 3113.63 0.48 0.33 0.15 | vq5rj50 3771.75 0.50 0.35 0.15 |
runid V6 trans/sec Total CPU msec/trans Emul CPU msec/trans CP CPU msec/trans | vq6rj01 1006.37 0.50 0.35 0.15 | vq6rj10 2544.41 0.50 0.33 0.15 | vq6rj20 2553.34 0.50 0.33 0.15 | vq6rj50 3733.04 0.50 0.36 0.15 |
% diff V4 to V5 |
|
|
|
|
trans/sec Total CPU msec/trans Emul CPU msec/trans CP CPU msec/trans | 0% -1% -1% -1% | 0% 0% -1% 0% | 0% -1% -1% 0% | -2% 0% -1% 1% |
% diff V4 to V6 |
|
|
|
|
trans/sec Total CPU msec/trans Emul CPU msec/trans CP CPU msec/trans | -1% 0% 1% -1% | -3% 0% 0% 0% | -18% 0% -1% 0% | -3% 0% 0% 0% |
| Note: 2064-109; z/VM 5.1.0; TCP/IP 510; V5 denotes IPv4 over IPv6 capable | ||||
Back to Table of Contents.
Virtual Switch Layer 2 Support
The OSA-Express features can support two transport modes of the OSA model; Layer 2 (Link Layer or MAC Layer) and Layer 3 (Network layer). Both the virtual switch and Linux then are configured to support the desired capability (Layer 2 or Layer 3).
The virtual switch, introduced in z/VM V4.4 supports Layer3 mode, is designed to improve connectivity to a physical LAN for hosts coupled to a guest LAN. It eliminates the need for a routing virtual machine by including the switching function in CP to provide IPv4 connectivity to a physical LAN through an OSA-Express Adapter.
With the PTF for APAR VM63538 and PQ98202, z/VM V5.1 will support Layer 2 mode. In this mode, each port on the virtual switch is referenced by its Media Access Control (MAC) address instead of by Internet Protocol (IP) address. Data is transported and delivered in Ethernet frames, providing the ability to handle protocol-independent traffic for both IP (IPv4 or IPv6) and non-IP, such as IPX, NetBIOS, or SNA. Coupled with the Layer 2 support in Linux for zSeries and the OSA-Express and OSA-Express2 support for the z890 and z990, Linux images deployed as guests of z/VM can use this protocol-independent capability through the virtual switch.
This section summarizes measurement results comparing IPv4 over virtual switch with Layer 3 to IPv4 over virtual switch with Layer 2. It also compares IPv4 (Layer 2) with IPv6 (Layer 2). Measurements were done using OSA-Express Gigabit Ethernet cards.
Methodology: An internal version of the Application Workload Modeler (AWM) was used to drive request-response (RR) and streaming (STR) workloads with IPv4 (Layer 3), IPv4 (Layer 2) and IPv6 (Layer 2). The request-response workload consisted of the client sending 200 bytes to the server and the server responding with 1000 bytes. This interaction was repeated for 200 seconds. The streaming workload consisted of the client sending 20 bytes to the server and the server responding with 20MB. This sequence was repeated for 400 seconds.
A complete set of runs, consisting of 3 trials for each case, for 1, 10, and 50 client-server pairs, was done with the maximum transmission unit (MTU) set to 1492 (for RR and STR) and 8992 (for STR only).
The measurements were done on a 2084-324 with 2 dedicated processors in each LPAR used. Connectivity between the two LPARs was over an OSA-Express card to OSA-Express card. The OSA level was 6.26. The software used includes:
- z/VM 5.1.0 with APAR VM63538
- TCP/IP 5.1.0 with PQ97436 and PQ98202 (the virtual switch controller stack)
- Linux SuSe SLES8 kernel levels 2.4.21-251 with qeth module dated 20041104
Results: The following tables compare the average of 3 trials for each measurement between IPv4 over a virtual switch configured for Layer 3 (noted as v4 in the tables) and IPv4 over a virtual switch configured for Layer 2 (noted as v5 in the tables), and between IPv4 and IPv6 (noted as v6 in the tables) over virtual switch configured for Layer 2. The numbers shown are the percent increase (or decrease). A positive number for throughput (either MB/sec or trans/sec) is good and a negative number for CPU time is good.
In general, the larger the MTU and/or the more activity, the smaller the difference between IPv4 over Layer 3 versus Layer 2.
Number of clients | 1 | 10 | 50 |
MTU 1492 runid V4 (Layer3) trans/sec Total CPU msec/trans Emul CPU msec/trans CP CPU msec/trans |
|
|
|
runid V5 (Layer2) trans/sec Total CPU msec/trans Emul CPU msec/trans CP CPU msec/trans | vl5rn01 1414.05 0.0650 0.0270 0.0380 | vl5rn10 10883.51 0.0460 0.0230 0.0230 | vl5rn50 25957.55 0.0357 0.0210 0.0147 |
runid V6 (Layer2) trans/sec Total CPU msec/trans Emul CPU msec/trans CP CPU msec/trans | vl6rn01 1389.10 0.0687 0.0290 0.0397 | vl6rn10 10642.39 0.0483 0.0260 0.0223 | vl6rn50 25196.77 0.0390 0.0233 0.0157 |
% diff V4 to V5 |
|
|
|
trans/sec Total CPU msec/trans Emul CPU msec/trans CP CPU msec/trans | 2% 3% 8% -1% | 4% 5% 3% 6% | 5% 2% 0% 5% |
% diff V5 to V6 |
|
|
|
trans/sec Total CPU msec/trans Emul CPU msec/trans CP CPU msec/trans | -2% 6% 7% 4% | -2% 5% 13% -3% | 0% 9% 11% 7% |
| Note: 2084-324; z/VM 5.1.0; TCP/IP 510; V5 denotes IPv4 over virtual switch configured for Layer2 | |||
Throughput is slightly higher for MTU 1492 for IPv4 over Layer 2
and slightly lower for IPv6.
Number of clients | 1 | 10 | 50 |
MTU 1492 runid V4 (Layer3) MB/sec Total CPU msec/MB Emul CPU msec/MB CP CPU msec/MB |
|
|
|
runid V5 (Layer2) MB/sec Total CPU msec/MB Emul CPU msec/MB CP CPU msec/MB | vl5sn01 42.87 9.80 4.26 5.54 | vl5sn10 71.30 8.34 4.12 4.22 | vl5sn50 89.57 7.93 3.95 3.97 |
runid V6 (Layer2) MB/sec Total CPU msec/MB Emul CPU msec/MB CP CPU msec/MB | vl6sn01 41.40 11.03 5.33 5.70 | vl6sn10 69.20 9.25 5.09 4.16 | vl6sn50 82.57 8.67 4.83 3.84 |
%diff V4 to V5 |
|
|
|
MB/sec Total CPU msec/MB Emul CPU msec/MB CP CPU msec/MB | 4% 7% 7% 7% | -0% 5% 4% 6% | -1% 4% 4% 4% |
%diff V5 to V6 |
|
|
|
MB/sec Total CPU msec/MB Emul CPU msec/MB CP CPU msec/MB | -3% 13% 25% 3% | -3% 11% 23% -1% | -8% 9% 22% -3% |
MTU 8992 runid V4 (Layer3) MB/sec Total CPU msec/MB Emul CPU msec/MB CP CPU msec/MB |
|
|
|
runid V5 (Layer2) MB/sec Total CPU msec/MB Emul CPU msec/MB CP CPU msec/MB | vl5sj01 30.93 5.75 2.26 3.49 | vl5sj10 111.50 4.73 2.11 2.62 | vl5sj50 115.50 4.85 2.19 2.67 |
runid V6 (Layer2) MB/sec Total CPU msec/MB Emul CPU msec/MB CP CPU msec/MB | vl6sj01 30.50 5.68 2.36 3.32 | vl6sj10 111.03 4.75 2.22 2.53 | vl6sj50 115.10 4.91 2.29 2.61 |
% diff V4 to V5 |
|
|
|
MB/sec Total CPU msec/MB Emul CPU msec/MB CP CPU msec/MB | 1% 3% 2% 4% | 0% 3% 1% 5% | 0% 2% 1% 3% |
% diff V5 to V6 |
|
|
|
MB/sec Total CPU msec/MB Emul CPU msec/MB CP CPU msec/MB | -1% -1% 4% -5% | 0% 0% 5% -3% | 0% 1% 5% -2% |
| Note: 2084-324; z/VM 5.1.0; TCP/IP 510; V5 denotes IPv4 over virtual switch configured for Layer 2 | |||
While throughput for MTU 1492 was almost the same for IPv4 over Layer 3 compared to Layer 2, the CPU cost is higher for Layer 2. However, the cost does decrease as the load increases. IPv6 compared to IPv4 gets less throughput and costs more in CPU time. For MTU 8992 the results are almost the same for all three cases.
Back to Table of Contents.
Additional Evaluations
This section includes results from additional z/VM and z/VM platform performance measurement evaluations that have been conducted during the z/VM 5.1.0 time frame.
Back to Table of Contents.
z990 Guest Crypto Enhancements
This section presents and discusses the results of a number of new measurements that were designed to understand the performance characteristics of the enhanced z990 cryptographic support. This support includes:
- shared cryptographic support for the PCIXCC card
- dedicated queue cryptographic support for PCICA and PCIXCC cards
- dedicated queue cryptographic support for z/OS
- LINUX SSL support for more ciphers
On the eServer z890 and z990 system, cryptographic hardware available at the time of this report was:
- The CP Assist for Cryptographic Function (CPACF) associated with each z990 processor
- Up to 6 PCI Cryptographic Accelerator (PCICA) features (2 cards per feature)
- Up to 4 PCI-X Cryptographic Coprocessor (PCIXCC) features (1 Coprocessor per feature)
LINUX Guest Crypto on z990
The section titled Linux Guest Crypto Support describes the original cryptographic support and the original methodology. The section titled Linux Guest Crypto on z990 describes additional cryptographic support and methodology.
Measurements were completed using the Linux OpenSSL Exerciser Performance Workload described in Linux OpenSSL Exerciser. Specific parameters used can be found in the measurement item list, various table columns, or table footnotes.
Some of the original methodology has changed including system levels, client machines, and connectivity types.
Client machines, client threads, servers, server threads, and connectivity paths were increased as needed to maximize usage of the processors and encryption facilities in each individual configuration. The range of values is listed in the common items table but individual measurement values are not in the tables because they had no specific impact on the results.
For some measurements, a z/OS system was active in a separate LPAR on the measurement system. z/OS RMF collects data for the full cryptographic card configuration. This RMF data is used to calculate PCIXCC and PCICA card utilization data for some tables in this report.
Items common to the previous measurements are
summarized
in .
Items common to the measurements in this section are
summarized
in Table 1.
Table 1. Common items for measurements in this section
Client Authentication Server SID Cache Client SID Cache Client SID Timeout Connections Packets Send Bytes Receive Bytes Key Size | No Disabled 0 180 1 1 2048 2048 1024 |
z/VM System Level Linux System Level Linux Kernel Level OpenSSL Code Level z90Crypt Level | 5.1.0 SLU 000 SLES8 2.4.21-110 0.9.7C 1.2.2 |
Real Connectivity (1 Guest) Real Connectivity (30 Guests) Virtual Connectivity TCP/IP Virt Mach Size TCP/IP Virt Mach Mode | LINUX TCP/IP z/VM TCP/IP vCTC 256M UP |
Guest Type Linux Kernel Mode Linux Kernel Size | V=V MP 31-bit |
Linux Virt Mach Size (1 Guest) Linux Virt Mach Size (30 Guests) Linux Virt Processors (1 Guest) Linux Virt Processors (30 Guests) | 2G 128M 4 1 |
Servers Server Threads Client Threads Client Machines | 100-180 100-180 100-180 1-2 |
Server Model Client Model Connective Path 1 Connective Path 2 Connective Path 3 | z990 dedicated LPAR z990, z900, S/390 LPAR HiperSockets CTCs CTCs |
Shared PCIXCC and PCICA cards with 1 LINUX guest: For both shared PCICA and PCIXCC cards, VM routes cryptographic operations to all available real cards. For a single guest, the total rate is determined by the amount that can be obtained through the 8 virtual queues or the maximum rate of the real cards. A single LINUX guest achieved a higher throughput rate with 1 PCIXCC card than with 1 PCICA card. With additional PCICA cards, the rate remained nearly constant. With additional PCIXCC cards, the rate continued to increase but did not reach 100% card utilization.
With a sufficient number of LINUX guests, the shared cryptographic support will reach 100% utilization of the real PCICA or PCIXCC cards unless 100% processor utilization becomes the limiting factor.
Measurements were obtained to compare the performance of the SSL workload using hardware encryption between the newly supported PCIXCC cards and the existing support for the PCICA cards.
Results of
the new shared queue support for PCIXCC cards along with existing
support
for PCICA cards
are
summarized
in Table 2.
Table 2. Shared PCIXCC and PCICA cards with 1 LINUX guest
Shared PCICA cards Shared PCIXCC cards | 1 0 | 6 0 | 0 1 | 0 2 | 0 4 |
Run ID | E4827BV1 | E4719BV1 | E4726BV1 | E4720BV2 | E4426BV1 |
Tx/sec (m) Total Util/Proc (v) Total Util/PCICA (f) Total Util/PCIXCC (f) | 876.09 26.7 na na | 871.50 27.2 13.0 na | 1145.76 34.4 na 97.8 | 1969.90 59.0 na 90.3 | 2431.50 64.5 na na |
| Note: 2084-324; 4 dedicated processors, 4G central storage, no expanded storage; Workload: SSL exerciser, RC4 MD5 US cipher, no session id caching; 1 LINUX Guest; (m) = Workload MINRATES, (v) = VMPRF, (f) = z/OS RMF | |||||
Dedicated PCIXCC and PCICA cards with 1 LINUX guest:
For both dedicated PCICA and PCIXCC cards, a single LINUX guest routes cryptographic operations to all dedicated cards. A single guest can obtain the maximum rate of the real cards unless processor utilization becomes a limit. A single LINUX guest achieved a higher throughput rate with 1 PCIXCC card than with 1 PCICA card. The measurement with 2 PCIXCC cards achieved nearly 2.0 times the rate of the measurement with 1 PCIXCC card. The measurement with 6 PCICA cards and the measurement with 4 PCIXCC cards are limited by nearly 100% processor utilization and thus do not achieve the maximum rate for the encryption configuration.
Results to evaluate performance of
the new dedicated queue support for PCIXCC cards
and PCICA cards
is
summarized
in Table 3.
Table 3. Dedicated PCIXCC and PCICA cards with 1 LINUX guest
Dedicated PCICA cards Dedicated PCIXCC cards |
1 0 |
6 0 |
0 1 |
0 2 |
0 4 |
Run ID | E4721BV3 | E4719BV2 | E4720BV1 | E4719BV3 | E4426BV2 |
Tx/sec Total Util/Proc (v) Total Util/PCICA (f) Total Util/PCIXCC (f) | 1080.39 31.4 98.4 na | 3967.17 96.9 59.3 na | 1186.46 34.7 na 99.9 | 2384.11 66.6 na 100.0 | 4351.34 99.8 na na |
| Note: 2084-324; 4 dedicated processors, 4G central storage, no expanded storage; Workload: SSL exerciser, RC4 MD5 US cipher, no session id caching; 1 LINUX Guest; (v) = VMPRF, (f) = z/OS RMF | |||||
Dedicated versus shared cards with 1 LINUX guest: Dedicated cards provided a higher rate than shared cards for all measured encryption configurations. However, there was a wide variation in the ratio between dedicated and shared. The minimum ratio of 1.036 occurred with the 1 PCIXCC card configuration because the shared measurement achieve 97.8% utilization on the PCIXCC card, thus allowing little opportunity for improvement. The maximum ratio of 4.552 occurred with the 6 PCICA card configuration because the shared measurement achieved only 13% utilization on the 6 PCICA cards, thus leaving a lot of opportunity for the dedicated measurement.
The shared results from
Table 2
and the dedicated results from
Table 3
are combined for comparison
in Table 4.
Table 4. Dedicated versus shared cards with 1 LINUX guest
PCICA cards PCIXCC cards | 1 0 | 6 0 | 0 1 | 0 2 | 0 4 |
Run ID (Shared) Run ID (Dedicated) | E4827BV1 E4721BV3 | E4719BV1 E4719BV2 | E4726BV1 E4720BV1 | E4720BV2 E4719BV3 | E4426BV1 E4426BV2 |
Tx/sec (Shared) Tx/sec (Dedicated) | 876.09 1080.39 | 871.50 3967.17 | 1145.76 1186.46 | 1969.90 2384.11 | 2431.50 4351.34 |
Ratio (Dedicated/Shared) | 1.233 | 4.552 | 1.036 | 1.210 | 1.790 |
| Note: see Table 2 and Table 3 | |||||
Shared PCIXCC and PCICA cards with 30 LINUX guest:
30 LINUX guests obtain a higher throughput than a single LINUX guest. Single guest measurements are limited by the 8 virtual queues for shared cryptographic support. 30 guest measurements are limited by the 100% processor or 100% cryptographic card utilization.
With 6 PCICA cards, processor utilization becomes a limiting factor before the PCICA cards reach 100% utilization. Processor time per transaction with 30 LINUX guests was 8% lower than the 1 guest measurement.
With 2 PCIXCC cards, the PCIXCC utilization becomes a limiting factor before the processor reaches 100% utilization. Processor time per transaction with 30 LINUX guests was 13% higher than the 1 guest measurement.
The measurement with 2 PCIXCC cards achieved a rate 0.679 times the measurement with 6 PCICA cards. Processor time per transaction for the 2 PCIXCC card measurement is 19% higher than the 6 PCICA card measurement.
With 4 PCIXCC cards, processor utilization becomes a limiting factor before the PCIXCC cards reach 100% utilization. Processor time per transaction with 30 LINUX guests was 4% higher than the 1 guest measurement.
The measurement with 4 PCIXCC cards achieved a rate 1.037 times the measurement with 6 PCICA cards and 1.528 times the measurement with 2 PCIXCC cards. Processor time per transaction for the 4 PCIXCC card measurement is 3.2% lower than the 6 PCICA card measurement and 19% lower than the 2 PCIXCC card measurement.
Results of the 30 guest measurements and corresponding 1 guest
measurements
are
summarized
in Table 5.
Table 5. Shared PCIXCC and PCICA cards by number of LINUX guests
Shared PCICA cards Shared PCIXCC cards No. LINUX Guest | 6 0 1 | 6 0 30 | 0 2 1 | 0 2 30 | 0 4 1 | 0 4 30 |
Run ID | E4719BV1 | E4715BV2 | E4720BV2 | E4720BV3 | E4426BV1 | E4419BV1 |
Tx/sec Total Util/Proc (h) Total msec/Tx (h) Total Util/PCICA (f) Total Util/PCIXCC (f) | 871.50 27.10 1.244 13.0 na | 3470.93 98.96 1.140 52.2 na | 1969.90 58.98 1.198 na 90.3 | 2355.10 79.95 1.358 na 99.5 | 2431.50 64.48 1.061 na na | 3599.51 99.27 1.103 na na |
| Note: 2084-324; 4 dedicated processors, 4G central storage, no expanded storage; Workload: SSL exerciser, RC4 MD5 US cipher, no session id caching; (h) = hardware instrumentation, (f) = z/OS RMF | ||||||
Shared PCIXCC and PCICA cards with 30 LINUX guest by SSL cipher:
Changing the cipher had very little impact on any of the results. With 6 PCICA cards, measurements for all three ciphers are limited by nearly 100% processor utilization and the rates vary by less than 5%. With 2 PCIXCC cards, measurements for all three ciphers are limited by nearly 100% card utilization and the rates vary by less than 1.1%.
With a RC4 MD5 US cipher, the measurement with 2 PCIXCC cards achieved a rate 0.679 times the measurement with 6 PCICA cards. Processor time per transaction for the 2 PCIXCC card measurement is 19% higher than the 6 PCICA card measurement.
With a DES SHA US cipher, the measurement with 2 PCIXCC cards achieved a rate 0.659 times the measurement with 6 PCICA cards. Processor time per transaction for the 2 PCIXCC card measurement is 10% higher than the 6 PCICA card measurement.
With a TDES SHA US cipher, the measurement with 2 PCIXCC cards achieved a rate 0.687 times the measurement with 6 PCICA cards. Processor time per transaction for the 2 PCIXCC card measurement is 8% higher than the 6 PCICA card measurement.
Results by cipher for both
PCIXCC
and PCICA cards
are
summarized
in Table 6.
Table 6. Shared PCIXCC and PCICA cards with 30 LINUX guest by SSL cipher
Cipher Shared PCICA cards Shared PCIXCC cards | RC4 MD5 US 6 0 | DES SHA US 6 0 | TDES SHA US 6 0 | RC4 MD5 US 0 2 | DES SHA US 0 2 | TDES SHA US 0 2 |
Run ID | E4715BV2 | E4715BV1 | E4715BV3 | E4720BV3 | E4721BV1 | E4721BV2 |
Tx/sec Total Util/Proc (h) Total msec/Tx (h) Total Util/PCICA (f) Total Util/PCIXCC (f) | 3470.93 98.96 1.140 52.2 na | 3577.01 99.07 1.108 53.7 na | 3429.93 98.53 1.149 51.4 na | 2355.10 79.95 1.358 na 99.5 | 2357.94 72.11 1.223 na 99.6 | 2357.77 73.20 1.242 na 99.6 |
| Note: 2084-324; 4 dedicated processors, 4G central storage, no expanded storage; Workload: SSL exerciser, no session id caching; 30 LINUX Guests; (h) = hardware instrumentation, (f) = z/OS RMF | ||||||
z/OS Guest Crypto on z990
z/VM support for z/OS Guest Crypto on z990 is new with z/VM 5.1.0 and was evaluated with both dedicated PCICA and PCIXCC cards. Two separate z/OS performance workloads were used for this evaluation.- z/OS Integrated Cryptographic Service Facility (ICSF) Sweeps
- z/OS System Secure Sockets Layer (System SSL)
z/OS Integrated Cryptographic Service Facility (ICSF) is a software element of z/OS that works with the hardware cryptographic features and the z/OS Security Server--Resource Access Control Facility (RACF), to provide secure, high-speed cryptographic services in the z/OS environment. ICSF provides the application programming interfaces by which applications request the cryptographic services. The cryptographic features are secure, high-speed hardware that do the actual cryptographic functions. The cryptographic features available to applications depend on the server or processor hardware.
z/OS System Secure Sockets Layer (System SSL) is part of the Cryptographic Services element of z/OS. Secure Sockets Layer (SSL) is a communications protocol that provides secure communications over an open communications network (for example, the Internet). The SSL protocol is a layered protocol that is intended to be used on top of a reliable transport, such as Transmission Control Protocol (TCP/IP). SSL provides data privacy and integrity as well as server and client authentication based on public key certificates. Once an SSL connection is established between a client and server, data communications between client and server are transparent to the encryption and integrity added by the SSL protocol. System SSL supports the SSL V2.0, SSL V3.0 and TLS (Transport Layer Security) V1.0 protocols. TLS V1.0 is the latest version of the SSL protocol. z/OS provides a set of SSL C/C&supplus.&supplus. callable application programming interfaces that, when used with the z/OS Sockets APIs, provide the functions required for applications to establish this secure sockets communications. In addition to providing the API interfaces to exploit the SSL and TLS protocols, System SSL is also providing a suite of Certificate Management APIs. These APIs give the capability to create/manage your own certificate databases, use certificates stored in key databases and key rings for purposes other than SSL and to build/process Public-Key Cryptography Standards (PKCS) #7 standard messages.
The SSL protocol begins with a "handshake." During the handshake, the client authenticates the server, the server optionally authenticates the client, and the client and server agree on how to encrypt and decrypt information. A non-cached measurement is created by setting a cache size of zero for the client application. This ensures no Session IDs are found in the cache and allows a measurement with no cache hits. Although no session IDs are found in any server cache, the size of the cache is important because all new session IDs must be placed in the cache and it will generally become full before the server Session ID Timeout value expires. For measurement consistency when comparing different numbers of servers, the server Session ID cache is set to "32000 divided by the number of servers" instead of the original methodology value of "32000 per server".
Dedicated PCIXCC and PCICA cards with 1 z/OS guest for ICSF test cases:
The rates achieved by a z/OS guest using the z/VM dedicated cryptographic support are nearly identical to z/OS native for all measured test cases. There are a few unexplained anomalies that occurred causing the minimum and maximum ratios to be much different than the average ratio. In many of these anomalies, the guest measurement achieved a higher rate than the z/OS native measurement. Of the 663 individual test case comparisons, 85% of the guest rates were within 1% of the native measurement and 95% of the guest rates were within 2% of the native measurement. The remaining 5% fall into the unexplained anomalies.
Measurements were completed using the z/OS ICSF Performance Workload described in z/OS Integrated Cryptographic Service Facility (ICSF) Performance Workload .
The number of test cases and configurations
produced far too much data to
include in this report but
Table 7 has a summary of guest to native
throughput
ratios
for all measurements.
The number of test cases measured for each ICSF sweep is included in
parenthesis following the sweep name.
Table 7. Guest to Native Throughput Ratio for z/OS ICSF Sweeps
PCICA cards PCIXCC cards Jobs | 1 0 1 | 1 0 8 | 0 1 1 | 0 1 7 | 0 2 14 |
PCXA Sweep (28) Run ID (Native) Run ID (Guest) Ratio (Average) Ratio (Minimum) Ratio (Maximum) |
|
|
|
|
|
XCPC Sweep (81) Run ID (Native) Run ID (Guest) Ratio (Average) Ratio (Minimum) Ratio (Maximum) |
|
|
|
|
|
XCDC Sweep (86) Run ID (Native) Run ID (Guest) Ratio (Average) Ratio (Minimum) Ratio (Maximum) |
|
|
|
|
|
XCPB Sweep (32) Run ID (Native) Run ID (Guest) Ratio (Average) Ratio (Minimum) Ratio (Maximum) |
|
|
|
|
|
XCDB Sweep (64) Run ID (Native) Run ID (Guest) Ratio (Average) Ratio (Minimum) Ratio (Maximum) |
|
|
|
|
|
| Note: 2084-324; 1 dedicated processors, 4G central storage, no expanded storage; Workload: z/OS ICSF Sweeps; Ratios are calculated from workload data | |||||
Other observations available from this set of measurement data but without any supporting data in this report include:
- Multiple jobs provided a higher rate than a single job for all except 1 test case. Specific ratios varied dramatically by test case. Generally, ratios were higher for the PCICA card measurements than the PCIXCC card measurements. The number of jobs in the multiple job measurements is enough to reach full capacity of the specified encryption facility.
- 28 of the ICSF test cases are supported on both the PCICA card and the PCIXCC card. With 1 job, the PCIXCC card achieved a higher rate than the PCICA card for all test cases but the amount of increase varied dramatically by individual test case. The minimum increase was 1.049 times and the maximum increase was 5.060 times. With multiple jobs (enough to reach 100% card utilization), the PCIXCC card achieved a lower rate than the PCICA card for 24 ICSF test cases and a higher rate than the PCICA card for 4 ICSF test cases. The minimum ratio was 0.355 times and the maximum ratio was 1.699 times.
- 2 PCIXCC cards achieved nearly 2.0 times the rate of 1 PCIXCC card for all test cases.
Dedicated PCIXCC and PCICA cards with 1 z/OS guest for System SSL:
Measurements were completed for a data exchange test case with both servers and clients on the same z/OS system using the z/OS SSL Performance Workload described in z/OS Secure Sockets Layer (System SSL) Performance Workload. Specific parameters used can be found in the measurement item list, various table columns, common items table, or table footnotes.
No z/VM or hardware instrumentation data was collected for these measurements, so the only available data is z/OS RMF data and workload data.
Results for the dedicated guest cryptographic support and native z/OS measurements are summarized in Table 8.
With 8 dedicated PCICA cards, both the native and guest measurements are limited by nearly 100% processor utilization. The guest measurement achieved a rate of 0.946 times the native measurement.
With 2 dedicated PCIXCC cards, both the native and guest measurements are limited by 100% PCIXCC card utilization. Both measurement achieved nearly identical rates. Processor time per transaction for the guest measurement is 13.6% higher than the native measurement.
The measurement with 2 PCIXCC cards is limited by 100% PCIXCC
card utilization and achieved a rate 0.565 times the measurement
with 8 PCICA cards which is limited by 100% processor utilization.
Processor time per transaction for the 2 PCIXCC card measurement is
7% higher than the 8 PCICA card measurement.
Table 8. Guest versus Native for z/OS System SSL
Type Dedicated PCICA cards Dedicated PCIXCC cards | Native 8 0 | Guest 8 0 | Native 0 2 | Guest 0 2 |
Run ID | E4806BE1 | E4808VE1 | E4805BE1 | E4808VE2 |
Tx/sec (u) Total Util/Proc (u) Total Msec/tx (u) Total Util/PCICA (f) Total Util/PCIXCC (f) | 1640.867 99.98 2.44 26.1 na | 1552.000 99.98 2.58 na na | 875.146 53.17 2.43 na 100.0 | 876.564 60.47 2.76 na na |
Tx/sec Ratio (Guest/Native) | - | 0.946 | - | 1.002 |
| Note: zVM 5.1.0 SLU 000; z/OS V1R4; 2084-324; 4 dedicated processors, 4G central storage, no expanded storage; Workload: SSL exerciser, No Client Authentication, 1 Connection, 1 Packet, 2048 bytes each way, 1024 bit keys, RC4 MD5 US cipher, no session id caching; 2 Servers, 40 Server Threads, 40 Client Threads; Server SID Cache = 16000, Client SID Cache = 0, Server SID Timeout = 180, Client SID Timeout = 180; (u) = z/OS RMF & Workload RUN-DATA, (f) = z/OS RMF | ||||
Back to Table of Contents.
z/VM Version 4 Release 4.0
This section summarizes the performance characteristics of z/VM 4.4.0 and the results of the z/VM 4.4.0 performance evaluation.
Back to Table of Contents.
Summary of Key Findings
This section summarizes the performance evaluation of z/VM 4.4.0. For further information on any given topic, refer to the page indicated in parentheses.
z/VM 4.4.0 includes a number of performance improvements and changes that affect VM performance management (see Changes That Affect Performance):
- Performance Improvements
- Scheduler Lock Improvement
- Queued I/O Assist
- Dispatcher Detection of Long-Term I/O
- Virtual Disk in Storage Frames Can Now Reside above 2G
- z/VM Virtual Switch
- TCP/IP Stack Improvements
- TCP/IP Device Layer MP Support
- Performance Management Changes
- Monitor Enhancements
- Effects on Accounting Data
- VM Performance Products
The most notable performance management change is the introduction of the Performance Toolkit for VM, which will, in subsequent releases, replace RTM and VMPRF.
Migration from z/VM 4.3.0: Regression measurements for the CMS environment (CMS1 workload) indicate that the performance of z/VM 4.4.0 is slightly better than z/VM 4.3.0. CPU time per command decreased by about 0.4% due to a 7% CPU time reduction in the TCP/IP VM stack virtual machine.
CPU usage of the TCP/IP VM stack virtual machine has been reduced significantly. CPU time reductions ranging from 5% to 81% have been observed. The largest improvement was for the CRR workload, which represents webserving workloads (see Performance Improvements and TCP/IP Stack Performance Improvements).
With z/VM 4.4.0, the timer management functions no longer use the scheduler lock but instead make use of a new timer request block lock, thus reducing contention for the scheduler lock. Measurement results of three environments that were constrained by scheduler lock contention showed throughput improvements of 8%, 73%, and 270% (see Scheduler Lock Improvement and Linux Guest Crypto on z990).
The z/VM support for the Queued I/O Assist provided by the IBM eServer zSeries 990 (z990) can provide significant reductions in total system CPU usage for workloads that include guest operating systems that use HiperSockets or that add adapter interruption support for OSA Express and FCP channels. CPU reductions ranging from 2 to 5 percent have been observed for Linux guests running HiperSockets workloads and from 8 to 18 percent for Gigabit Ethernet workloads (see Queued I/O Assist).
The z/VM Virtual Switch can be used to eliminate the need for a virtual machine to serve as a TCP/IP router between a set of virtual machines in a VM Guest LAN and a physical LAN that is reached through an OSA-Express adapter. This can result in a significant reduction in CPU time. Decreases ranging from 19% to 33% were observed for the measured environments when a TCP/IP VM router was replaced with a virtual switch. Decreases ranging from 46% to 70% were observed when a Linux router was replaced with a virtual switch (see z/VM Virtual Switch).
With TCP/IP 440, support has been added to allow device-specific processing to be done on virtual processors other than the base processor used by the remaining stack functions. CP can then dispatch these on separate real processors if they are available. This can increase the rate of work that can be handled by the stack virtual machine before the base processor becomes fully utilized. For the measured cases, throughput changes ranging from a 2% decrease to a 24% improvement were observed (see TCP/IP Device Layer MP Support).
Measurements are shown that illustrate the high SSL transaction rates that can be sustained on z990 processors by Linux guests through the use of z990 cryptographic support (see Linux Guest Crypto on z990).
Back to Table of Contents.
Changes That Affect Performance
This chapter contains descriptions of various changes in z/VM 4.4.0 that affect performance. It is divided into two sections -- Performance Improvements and Performance Management. This information is also available on our VM Performance Changes page, along with corresponding information for previous releases.
Back to Table of Contents.
Performance Improvements
The following items improve performance:
- Scheduler Lock Improvement
- Queued I/O Assist
- Dispatcher Detection of Long-Term I/O
- Virtual Disk in Storage Frames Can Now Reside above 2G
- z/VM Virtual Switch
- TCP/IP Stack Improvements
- TCP/IP Device Layer MP Support
Scheduler Lock Improvement
A number of CP functions make use of the scheduler lock to achieve the required multiprocessor serialization. Because of this, the scheduler lock can limit the capacity of high n-way configurations. With z/VM 4.4.0, the timer management functions no longer user the scheduler lock but instead make use of a new timer request block lock, thus reducing contention for the scheduler lock. Measurement results of three environments that were constrained by scheduler lock contention showed throughput improvements of 8%, 73%, and 270%. See Scheduler Lock Improvement and Linux Guest Crypto on z990 for results and further discussion.
Queued I/O Assist
IBM introduced Queued Direct I/O (QDIO), a shared-memory I/O architecture for IBM zSeries computers, with its OSA Express networking adapter. Later I/O devices, such as HiperSockets and the Fiber Channel Protocol (FCP) adapter, also use QDIO.
In extending QDIO for HiperSockets, IBM revised the interrupt scheme so as to lighten the interrupt delivery process. The older, heavyweight interrupts, called PCI interrupts, were still used for the OSA Express and FCP adapters, but HiperSockets used a new, lighter interrupt scheme called adapter interrupts.
The new IBM eServer zSeries 990 (z990) and z/VM Version 4 Release 4 cooperate to provide important performance improvements to the QDIO architecture as regards QDIO interrupts. First, the z990 OSA Express adapter now uses adapter interrupts. This lets OSA Express adapters and FCP channels join HiperSockets in using these lighter interrupts and experiencing the attendant performance gains. Second, z990 millicode, when instructed by z/VM CP to do so, can deliver adapter interrupts directly to a running z/VM guest without z/VM CP intervening and without the running guest leaving SIE. This is similar to traditional IOASSIST for V=R guests, with the bonus that it applies to V=V guests. Third, when an adapter interrupt needs to be delivered to a nonrunning guest, the z990 informs z/VM CP of the identity of the nonrunning guest, rather than forcing z/VM CP to examine the QDIO data structures of all guests to locate the guest for which the interrupt is intended. This reduces z/VM CP processing per adapter interrupt.
Together, these three improvements benefit any guest that can process adapter interruptions. This includes all users of HiperSockets, and it also includes any guest operating system that adds adapter interruption support for OSA Express and FCP channels.
Measurement results for data transfer between two Linux guests showed 2% to 5% reductions in total CPU requirements for HiperSockets connectivity and 8% to 18% CPU reductions for the Gigabit Ethernet case. See Queued I/O Assist for further information.
Dispatcher Detection of Long-Term I/O
Traditionally, the z/VM CP dispatcher has contained an algorithm intended to hold a virtual machine in the dispatch list if the virtual machine had an I/O operation outstanding. The intent was to avoid dismantling virtual machine resources if an I/O interrupt was imminent.
When this algorithm was designed, the pending I/O operation almost always belonged to a disk drive. The I/O interrupt came very shortly after the I/O operation was started. Avoiding dismantling the virtual machine while the I/O was in flight was almost always the right decision.
Recent uses of z/VM to host large numbers of network-enabled guests, such as Linux guests, have shown a flaw in this algorithm. Guests that use network devices very often start a long-running I/O operation to the network device and then fall idle. A READ CCW applied to a CTC adapter is one example of an I/O that could turn out to be long-running. Depending on the kind of I/O device being used and the intensity of the network activity, the long-running I/O might complete in seconds, minutes, or perhaps even never complete at all.
As mentioned earlier, holding a virtual machine in the dispatch list tends to protect the physical resources being used to support its execution. Chief among these physical resources is real storage. As long as the z/VM system has plenty of real storage to support its workload, the idea that some practically-idle guests are remaining in the dispatch list and using real storage has little significance. However, as workload grows and real storage starts to become constrained, protection of the real storage being used by idling guests becomes a problem. Because Linux guests tend to try to use all of the virtual storage allocated to them, holding an idle Linux guest in the dispatch list is problematic.
The PTFs associated with APAR VM63282 change later releases of z/VM to exempt certain I/O devices from causing the guest to be held in the dispatch list while an I/O is in flight. When the appropriate PTF is applied, outstanding I/O to the following kinds of I/O devices no longer prevents the guest from being dropped from the dispatch list:
- Real or virtual CTCA (includes CTC, 3088, ESCON, and FICON)
- Real or virtual message processor devices
- Real OSA devices (LCS or QDIO mode)
- Real HiperSockets devices
- VM guest LAN devices (QDIO or HiperSockets)
The PTF numbers are:
z/VM Release | PTF Number |
z/VM 4.4.0 | UM30889 |
z/VM 4.3.0 | UM30888 |
IBM evaluated this algorithm change on a storage-constrained Linux HTTP guest serving workload. We found that the change did tend to increase the likelihood that a network-enabled guest will drop from the dispatch list.
As a side effect, we found that virtual machine state sampling data generated by the CP monitor tends to be more accurate when this PTF is applied. Monitor reports a virtual machine's state as "I/O active" before it reports other states. This is consistent with the historical view that an outstanding I/O is a short-lived phenomenon. Removing very-long-running I/Os from the sampler's field of view helps the CP monitor facility more accurately report virtual machine states.
Last, it is appropriate to note that other phenomena besides an outstanding I/O operation will tend to hold a guest in the dispatch queue. Chief among these is something called the CP "test-idle timer". When a virtual machine falls idle -- that is, it has no instructions to run and it has no I/Os outstanding -- CP leaves the virtual machine in the dispatch list for 300 milliseconds (ms) before deciding to drop it from the dispatch list. Like the outstanding I/O algorithm, the intent of the test-idle timer is to prevent CP from excessively disturbing the real storage allocated to a guest that might run again "soon". Some guest operating systems, such as TPF and Linux, employ a timer tick (every 200 msec in the case of TPF, every 10 msec in the case of Linux without the timer patch) even when they are basically otherwise idle. This ticking timer tends to subvert CP's test-idle logic and leave such guests in queue when they could perhaps cope well with leaving. IBM is aware of this situation and is considering whether a change in the area of test-idle is appropriate. In the meantime, system programmers wanting to do their own experiments with the value of the test-idle timer can get IBM's SRMTIDLE package from our download page.
Virtual Disk in Storage Frames Can Now Reside above 2G
Page frames used by the Virtual Disk in Storage facility can now reside above 2G in central storage. This change can potentially improve the performance of VM systems that use v-disks and are currently constrained by the 2G line.
z/VM Virtual Switch
The z/VM Virtual Switch can be used to eliminate the need for a virtual machine to serve as a TCP/IP router between a set of virtual machines in a VM Guest LAN and a physical LAN that is reached through an OSA-Express adapter. With virtual switch, the router function is instead accomplished directly by CP. This can eliminate most of the CPU time that was used by the virtual machine router it replaces, resulting in a significant reduction in total system CPU time. Decreases ranging from 19% to 33% were observed for the measured environments when a TCP/IP VM router was replaced with virtual switch. Decreases ranging from 46% to 70% were observed when a Linux router was replaced with virtual switch. See z/VM Virtual Switch for results and further discussion.
TCP/IP Stack Improvements
CPU usage of the TCP/IP stack virtual machine was reduced substantially. A 16% reduction in total CPU time per MB was observed for the streaming workload (represents FTP-like bulk data transfer) and a 5% reduction was observed for the RR workload (represents Telnet activity). The largest improvements were observed for the CRR workload, which represents webserving workloads where each transaction includes a connect/disconnect pair. In that case, CPU/transaction decreased by 81%. See TCP/IP Stack Performance Improvements for measurement results and further discussion.
These improvements target the case where the TCP/IP stack is for a host system and are focused on the upper layers of the TCP/IP stack (TCP and UDP). As such, they complement the improvements made in z/VM 4.3.0, which were directed primarily at the case where TCP/IP VM is used as a router and were focused on the lower layers of the TCP/IP stack. See TCP/IP Stack Performance Improvements for results and discussion of those z/VM 4.3.0 improvements.
TCP/IP Device Layer MP Support
Prior to this release, TCP/IP VM didn't have any virtual MP support and, as a result, any given TCP/IP stack virtual machine could only run on one real processor at a time. With TCP/IP 440, support has been added to allow device-specific processing to be done on virtual processors other than the base processor. This can be used to offload some processing from the base processor, which is used by the remaining stack functions. CP can then dispatch these on separate real processors if they are available. This can increase the rate of work that can be handled by the stack virtual machine before the base processor becomes fully utilized. For the measured Gigabit Ethernet and HiperSockets cases, throughput changes ranging from a 2% decrease to a 24% improvement were observed. See TCP/IP Device Layer MP Support for results and further discussion.
Back to Table of Contents.
Performance Management
These changes affect the performance management of z/VM and TCP/IP VM.
- Monitor Enhancements
- Effects on Accounting Data
- VM Performance Products
Monitor Enhancements
There were five areas of enhancements affecting the monitor data for z/VM 4.4.0. Changes were made to both system configuration information and to improve areas of data collection. As a result of these changes, there is one new monitor record and several changed records. The detailed monitor record layouts are found on our control blocks page.
In systems with large numbers of LPARs and logical CPUs (The current limit for a 16-way is 158 logical CPUs.), the potential existed for LPAR information data to be truncated. Support was added to the monitor to correctly reflect the number of LPARs and their associated logical CPUs. In addition, a field was added to identify the type of logical CPU for which data is being reported. The Domain 0 Record 15 (Logical CPU Utilization Data) and the Domain 0 Record 16 (CPU Utilization Data in a Logical Partition) records were updated for this support.
Domain 0 Record 20 (Extended Channel Measurement Data) was updated to better reflect the information returned when the Extended Channel Measurement facility is enabled. Documentation was added to further define the contents and format of the channel measurement group dependent channel-measurements characteristics and the contents and format of the channel utilization entries.
The Extended-I/O-Measurement facility (available on the z990 processor) was updated to add support for the format-1 subchannel measurement blocks (SCMBKS). The size of the format-1 SCMBKS has increased, including fields within the SCMBKS which are now fullword versus halfword fields. The format-1 SCMBKS are now dynamically allocated. The updated records include: Domain 0 Record 3 (Real Storage Data), Domain 1 Record 4 (System Configuration Data), Domain 1 Record 7 (Memory Configuration Data), Domain 3 Record 4 (Auxiliary Storage Management), Domain 3 Record 11 (Auxiliary Shared Storage Management), Domain 6 Record 3 (Device Activity) and Domain 6 Record 14 (Real Storage Data).
A new record, Domain 6 Record 21 (Virtual Switch Activity), was added to provide data for I/O activities for a virtual switch connection to a real hardware LAN segment through an OSA Direct Express. The information in this record is collected for the data device associated with an OSA in use by a virtual switch.
To improve performance by increasing guest throughput when CP is running in a multiprocessing environment, the timer request block management was removed from the scheduler lock and a new lock was created to serialize that function. Prior to this change, the scheduler lock was used to handle the serialization of scheduler activities, handle timer request block management, and handle processor local dispatch management. Since the timer request block management is no longer a part of the scheduler lock, two new fields have been added to Domain 0 Record 10 (Scheduler Activity) to provide data specific to the timer request block management scheduler activity.
Additionally it must be noted that starting with the z990 processor, the STORE CHANNEL PATH STATUS instruction used to create the Domain 0 Record 9 (Physical Channel Path Contention Data) monitor record will no longer return valid information. Please refer to Domain 0 Record 20 (Extended Channel Measurement Data) for valid channel path utilization data.
Effects on Accounting Data
When using z/VM Virtual Switch, CP time is charged to the VM TCP/IP controller virtual machine while handling interrupts. Once the datagrams have been queued to the receiving stack and receive processing starts, CP time is charged to the receiving stack virtual machine. The reverse is true for the send case. While CP is extracting segments from the stack's buffers, the time is charged to the sending stack. At this point the buffers are given to the OSA-Express card and no further time is charged. See z/VM Virtual Switch for further information about the virtual switch.
None of the other z/VM 4.4.0 performance changes are expected to have a significant effect on the values reported in the virtual machine resource usage accounting record.
VM Performance Products
This section contains information on the support for z/VM 4.4.0 provided by the Performance Toolkit for VM, VMPRF, RTM, and VMPAF. As noted in our May 13 announcement, it is planned that future performance management enhancements will be made primarily to the Performance Toolkit for VM. z/VM V4.4 is planned to be the last release in which the RTM and PRF features will be available.
The Performance Toolkit for VM provides enhanced capabilities for a z/VM systems programmer, operator, or performance analyst to monitor and report performance data. The toolkit is an optional, per-engine-priced feature derived from the FCON/ESA program (5788-LGA), providing:
Full-screen mode system console operation and management of multiple z/VM systems
Post-processing of Performance Toolkit for VM history files and of VM monitor data captured by the MONWRITE utility
Viewing of performance monitor data using either web browsers or PC-based 3270 emulator graphics
TCP/IP performance reporting
Viewing of Linux performance data obtained from the Resource Management Facility (RMFTM) Linux performance gatherer, rmfpms.
VMPRF support for z/VM 4.4.0 is provided by VMPRF Function Level 4.1.0, which is a preinstalled, priced feature of z/VM 4.4.0. VMPRF 4.1.0 can also be used to reduce CP monitor data obtained from any supported VM release. The latest service is required.
RTM support for z/VM 4.4.0 is provided by Real Time Monitor Function Level 4.1.0. As with VMPRF, RTM is a preinstalled, priced feature of z/VM 4.4.0. The latest service is required and is pre-installed on z/VM 4.4.0
Performance Analysis Facility/VM 1.1.3 (VMPAF) will run on z/VM 4.4.0 with the same support as for z/VM 4.3.0.
Back to Table of Contents.
New Functions
This section contains performance evaluation results for the following new functions:
- Scheduler Lock Improvement
- z/VM Virtual Switch
- TCP/IP Stack Performance Improvements
Back to Table of Contents.
Scheduler Lock Improvement
Prior to z/VM 4.4.0, the CP scheduler lock was used to serialize scheduler activities, timer requests, and processor local dispatch vectors (PLDVs). With z/VM 4.4.0, a new timer request lock has been integrated into the z/VM Control Program to manage timer requests. The introduction of the Timer Request Lock (TRQBK lock) reduces contention on the scheduler lock, allowing an increase in the volume of Linux guest virtual machines and other guest operating systems that can be managed concurrently by a z/VM image. While this can improve capacity with large n-way configurations, little or no effect is experienced on systems with very few processors.
This section summarizes the results of a performance evaluation that was done to verify that there is a significant reduction in scheduler lock contention in environments with large numbers of guest virtual machines running on large n-way systems. This was accomplished by comparing the overall time spent spinning on CP locks and CP CPU time per transaction. The expected result was that the number of requests to spin (Avg Spin Lock Rate), the time spent spinning on CP locks (Spin Time), and the CP CPU time per transaction (CP msec/Tx) would all decrease.
Methodology: All performance measurements were done on z900 systems. A 2064-109 system was used to conduct experiments with 3-way and 9-way LPAR configurations; a 2064-116 was used to experiment with a 16-way LPAR configuration. The 3-way and 9-way LPAR configurations each included dedicated processors, 6.5GB of central storage and 0.5GB of expanded storage. The 16-way LPAR configuration included dedicated processors, 16GB of central storage and 1GB of expanded storage. 1
The software configuration for the evaluation used z/VM 4.3.0 for the baseline comparison against z/VM 4.4.0. The application workload included a combination of busy and idle users. The purpose of including idle users was to create an environment with numerous timer interrupts to evaluate the effect of the new TRQBK lock on system performance. The specifics of the application workload are:
- 100 Linux guest virtual machines performing HTTP web serving with zero think time (these machines were constantly busy serving up web pages).
- 500 idle guest virtual machines generating timer requests every 10 milliseconds. 2 This portion of the workload put a significant load on CP to manage timer interrupts. Typical customer environments with large numbers of Linux guests would have the time patch applied.
The scenarios included the application workload being executed on z/VM 4.3.0 using the 3-way, 9-way, and 16-way LPAR configurations discussed above to create a set of baseline measurements for comparison. z/VM 4.4.0 was measured with the same workload for each of the LPAR configurations. A discussion of the results for each LPAR configuration follows.
Internal tools were used to drive the application workload for each scenario. The idle users were allowed to reach a steady state (indicated by the absence of paging activity) before taking measurements. Hardware instrumentation and CP monitor data were collected for each scenario.
Figure 1 shows the percent of time spent spinning on CP locks, comparing z/VM 4.3.0 to z/VM 4.4.0. Figure 2 shows the CP CPU time for each transaction comparing z/VM 4.3.0 to z/VM 4.4.0.
Table 1 shows a summary of the data collected for the 3-way, 9-way, and 16-way comparisons.
Figure 1. Reduction in Time Spent Spinning on CP Locks
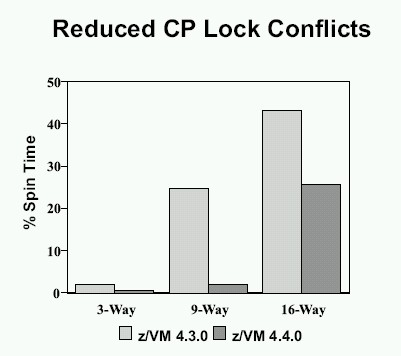 |
Figure 2. Reduction in CP CPU Time per Transaction
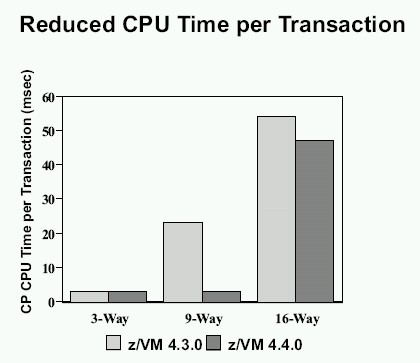 |
In the 3-way LPAR comparison, there is a noticeable improvement in the CP spin lock area. The average spin lock rate (the number of times a request to spin is made) is reduced by 55%, and the percent spin time (percentage of time spent spinning on a lock) is reduced by 62%. However, the CP CPU time per transaction (CP msec/Tx) does not change much. This is expected since CP locking is not a significant problem in the base case (z/VM 4.3.0) with the 3-way LPAR configuration. Generally, as the number of CPUs increases, and each of them is sending timer requests to CP, there are more timer requests queued up to be handled.
With the increased number of CPUs in the 9-way LPAR comparison, the benefit of splitting off the timer request management from the scheduler lock stands out. The CP CPU time per transaction rate is reduced by 87% along with a 54% reduction in the average spin lock rate and a 92% reduction the percent spin time. With the increase to 9 CPUs, this data illustrates that the serialization of timer requests being handled by the new TRQBK lock has a very positive effect on the system because CP locking is a severe problem in the base case.
With the 16-way LPAR configuration, again there is a
improvement in the CP CPU time per transaction rate. It is reduced by
13%, which is
much less of an improvement than in the 9-way comparison.
The average spin
lock rate is reduced by 29% and the percent spin time is reduced by 41%.
While these improvements are significant, they are less dramatic in this
configuration because the z/VM 4.4.0 case is now being limited by CP
lock contention. For the base case, CP lock contention is much more
severe, so z/VM 4.4.0 still shows an improvement.
Table 1. Reduced Scheduler Lock Contention: 3-Way, 9-Way, 16-Way LPAR
z/VM Version # of CPUs Run ID | 4.3.0 3 43UPP3 | 4.4.0 3 44UPP3 | 4.3.0 9 43UPP9 | 4.4.0 9 44UPP9 | 4.3.0 16 43S1UP16 | 4.4.0 16 44S1UP16 |
|---|---|---|---|---|---|---|
Tx/sec (n) SIE Instruction Rate (v) | 416.73 159414 | 420.88 160020 | 270.11 88416 | 999.88 197199 | 248.63 59856 | 268.35 77632 |
Total msec/Tx (h) CP msec/Tx (h) Emul msec/Tx (h) | 7.110 3.231 3.880 | 7.033 3.133 3.901 | 28.213 23.113 5.101 | 7.864 3.034 4.830 | 58.627 54.142 4.484 | 51.868 47.014 4.854 |
Avg Spin Lock Rate (v) Spin Time (v) Pct Spin Time (v) | 6150 3.338 2.053 | 2797 2.739 0.766 | 10047 24.782 24.90 | 4587 4.275 1.961 | 4108 104.895 43.09 | 2929 87.360 25.59 |
Total Util/Proc (v) System Util/Proc (v) | 99.3 9.5 | 99.5 9.8 | 83.4 42.0 | 87.4 12.9 | 90.3 54.2 | 86.6 72.0 |
Ratios |
|
|
|
|
|
|
Tx/sec (n) SIE Instruction Rate (v) | 1.000 1.000 | 1.010 1.004 | 1.000 1.000 | 3.702 2.230 | 1.000 1.000 | 1.079 1.297 |
Total msec/Tx (h) CP msec/Tx (h) Emul msec/Tx (h) | 1.000 1.000 1.000 | 0.989 0.970 1.005 | 1.000 1.000 1.000 | 0.279 0.131 0.947 | 1.000 1.000 1.000 | 0.885 0.868 1.083 |
Avg Spin Lock Rate (v) Spin Time (v) Pct Spin Time (v) | 1.000 1.000 1.000 | 0.455 0.821 0.373 | 1.000 1.000 1.000 | 0.457 0.173 0.079 | 1.000 1.000 1.000 | 0.713 0.833 0.594 |
Total Util/Proc (v) System Util/Proc (v) | 1.000 1.000 | 1.002 1.032 | 1.000 1.000 | 1.048 0.307 | 1.000 1.000 | 0.959 1.328 |
| Note: These measurements were done on z900 machines in a non-paging environment; the workload consisted of 100 zLinux guests performing HTTP web serving and 500 simulated idle Linux guests. | ||||||
| Note: The transaction/sec rate represents the rate for the busy virtual machines performing HTTP web serving. It does not include the idle users that are generating timer interrupts. | ||||||
In all cases tested, it was verified that CP CPU time per transaction is positively affected by introduction of the timer request lock (TRQBK lock). The TRQBK lock significantly reduces the bottleneck experienced by the scheduler lock when the workload on the system includes a large number of timer interrupts to be handled. Since idle Linux systems generate frequent timer interrupts to look for work, the TRQBK lock plays an important role in maintaining good performance in z/VM systems when there are large numbers of Linux guests present. 3
Additional evidence of the positive effect of the TRQBK lock is illustrated in the Linux Guest Crypto on z990 section of this report.
In the case of the 16-way configuration, CP lock contention is reduced when compared to z/VM 4.3.0, but is still a significant limitation with the workload that was used. However, as mentioned earlier, this workload was created to stress CP's management of timer interrupts. Typical customer environments with Linux guests would perform much better because the Linux guests would have the timer patch applied.
Footnotes:
- 1
- The breakout of central storage and expanded storage for this evaluation was arbitrary. Similar results are expected with other breakouts because the measurements were obtained in a nonpaging environment.
- 2
- These virtual machines emulate idle Linux guests without the timer patch installed.
- 3
- Such Linux systems are good candidates for the timer patch to reduce the frequency of timer interrupts.
Back to Table of Contents.
z/VM Virtual Switch
z/VM 4.4.0 has added a special type of Guest LAN, called a virtual switch, which is capable of bridging a z/VM Guest LAN (type QDIO) to an associated real LAN connected by an OSA-Express adapter. The virtual switch is designed to help eliminate the need for virtual machines acting as routers. Virtual routers consume valuable processor cycles to process incoming and outgoing packets, requiring additional copying of the data being transported. The virtual switch helps alleviate this problem by moving the data directly between the real network adapter and the target or originating guest data buffers.
This section summarizes measurement results that assess the performance of the virtual switch comparing it with a router stack. These measurements were done for Linux as well as for the VM TCP/IP stack.
Methodology: An internal tool was used to drive request-response (RR), connect-request-response (CRR) and streaming (S) workloads. The request-response workload consisted of the client sending 200 bytes to the server and the server responding with 1000 bytes. This interaction lasted for 200 seconds. The connect-request-response workload had the client connecting, sending 64 bytes to the server, the server responding with 8K and the client then disconnecting. This same sequence was repeated for 200 seconds. The streaming workload consisted of the client sending 20 bytes to the server and the server responding with 20MB. This sequence was repeated for 400 seconds.
A complete set of runs, consisting of 3 trials for each case, was done with the maximum transmission unit (MTU) set to 1492 and 8992.
The measurements were done on a 2064-109 with 3 dedicated processors in each LPAR used. Each LPAR had 1GB of central storage and 2GB expanded storage. CP monitor data was captured for one LPAR during the measurement and reduced using VMPRF.
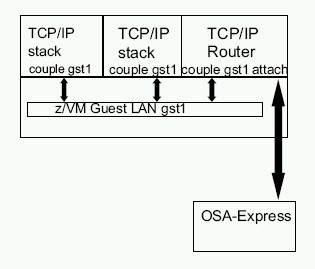 |
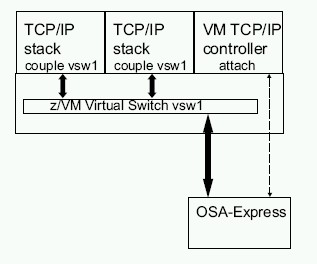 |
- a VM stack communicating with a VM router which was attached to an OSA, the requests then went through another OSA card which was attached to a VM router in another LPAR and it communicated with a VM stack in that LPAR
- the same was done for a Linux stack communicating with a Linux router
- the VM router in environment 1 was replaced with a virtual switch
- the Linux router in environment 2 was replaced with a virtual switch
- a VM router was substituted for the Linux router (on both sides)
Results:
The following tables compare results when running Linux TCP/IP
communicating through a Linux router, a VM router and a virtual switch.
Absolute values are given for throughput and CPU time and then ratios
for comparison of a Linux router replaced with a virtual switch and also
for a VM router replaced with virtual switch.
All samples are from 50 client-server pairs.
In almost all cases the throughput increased and CPU time decreased
when a virtual switch was used.
Data is not included here for the VM stack to VM router and VM stack
to virtual switch measurements, but the results were similar. CPU
time went down and throughput went up for most measurements.
Table 1. Comparison - Linux Router/VM Router with VSwitch - Streaming
MTU Size 1492
| Linux to Linux Router | Linux to VM Router | Linux to VSwitch
|
|---|---|---|---|
MB/sec CPU msec/MB | 28.09 54.68 | 53.98 20.06 | 53.24 16.23 |
ratio MB/sec ratio CPU msec/MB | 1.00 1.00 |
| 1.90 0.30 |
ratio MB/sec ratio CPU msec/MB |
| 1.00 1.00 | 0.99 0.81 |
| Note: 2064-109; z/VM 4.4.0 with 64-bit CP; TCP/IP 440; Linux 2.4.19 31-bit | |||
Table 2. Comparison - Linux Router/VM Router with VSwitch - Streaming
MTU Size 8992
| Linux to Linux Router | Linux to VM Router | Linux to VSwitch
|
|---|---|---|---|
MB/sec CPU msec/MB | 78.34 18.88 | 71.94 12.93 | 108.59 10.22 |
ratio MB/sec ratio CPU msec/MB | 1.00 1.00 |
| 1.39 0.54 |
ratio MB/sec ratio CPU msec/MB |
| 1.00 1.00 | 1.51 0.79 |
| Note: 2064-109; z/VM 4.4.0 with 64-bit CP; TCP/IP 440; Linux 2.4.19 31-bit | |||
Table 3. Comparison - Linux Router/VM Router with VSwitch - CRR
MTU Size 1492
| Linux to Linux Router | Linux to VM Router | Linux to VSwitch
|
|---|---|---|---|
trans/sec CPU msec/trans | 1426.63 1.09 | 2778.33 0.60 | 2966.96 0.40 |
ratio trans/sec ratio CPU msec/trans | 1.00 1.00 |
| 2.08 0.37 |
ratio trans/sec ratio CPU msec/trans |
| 1.00 1.00 | 1.07 0.67 |
| Note: 2064-109; z/VM 4.4.0 with 64-bit CP; TCP/IP 440; Linux 2.4.19 31-bit | |||
Table 4. Comparison - Linux Router/VM Router with VSwitch - CRR
MTU Size 8992
| Linux to Linux Router | Linux to VM Router | Linux to VSwitch
|
|---|---|---|---|
trans/sec CPU msec/trans | 2220.97 0.73 | 4146.52 0.41 | 4187.93 0.29 |
ratio trans/sec ratio CPU msec/trans | 1.00 1.00 |
| 1.89 0.40 |
ratio trans/sec ratio CPU msec/trans |
| 1.00 1.00 | 1.01 0.71 |
| Note: 2064-109; z/VM 4.4.0 with 64-bit CP; TCP/IP 440; Linux 2.4.19 31-bit | |||
Table 5. Comparison - Linux Router/VM Router with VSwitch - RR
MTU Size 1492
| Linux to Linux Router | Linux to VM Router | Linux to VSwitch
|
|---|---|---|---|
trans/sec CPU msec/trans | 9915.42 0.15 | 13078.97 0.09 | 18064.12 0.06 |
ratio trans/sec ratio CPU msec/trans | 1.00 1.00 |
| 1.82 0.40 |
ratio trans/sec ratio CPU msec/trans |
| 1.00 1.00 | 1.38 0.67 |
| Note: 2064-109; z/VM 4.4.0 with 64-bit CP; TCP/IP 440; Linux 2.4.19 31-bit | |||
Table 6. Comparison - Linux Router/VM Router with VSwitch - RR
MTU Size 8992
| Linux to Linux Router | Linux to VM Router | Linux to VSwitch
|
|---|---|---|---|
trans/sec CPU msec/trans | 9942.71 0.15 | 12985.37 0.09 | 17970.93 0.07 |
ratio trans/sec ratio CPU msec/trans | 1.00 1.00 |
| 1.81 0.47 |
ratio trans/sec ratio CPU msec/trans |
| 1.00 1.00 | 1.38 0.78 |
| Note: 2064-109; z/VM 4.4.0 with 64-bit CP; TCP/IP 440; Linux 2.4.19 31-bit | |||
The following charts compare the same environments but are focused on CPU time spent. The tables show virtual and CP msec/MB (for streaming) or msec/trans (for CRR and RR) for both the client and router stacks. For the virtual switch case, the router stack is the virtual switch controller. Absolute values are shown. Notice that there is no virtual time for the router in the virtual switch case.
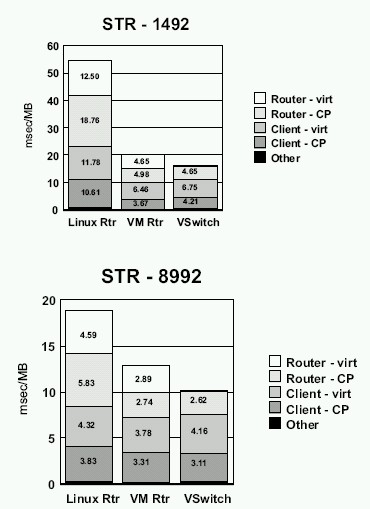 |
When using a virtual switch, CP time is charged to the VM TCP/IP controller while handling interrupts (ie processing QDIO buffers). Once the datagrams have been queued to the receiving stack, and receive processing starts, CP time is charged to the receiving stack. The reverse is true for the send case. While CP is extracting segments from the stack's buffers, the time is charged to the sending stack. At this point the buffers are given to the OSA-Express card and no further time is charged.
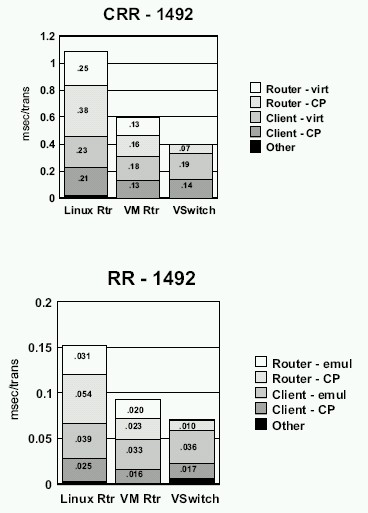 |
The results for MTU size of 8992 were similar to those shown for MTU of 1492 and are therefore not shown.
Summary: Because the amount of processing needed to handle the data being presented by/to the OSA-Express has been compressed, fewer processor cycles are needed to handle the workload. This means there is the potential for improved throughput in cases that were CPU-constrained.
There are no known cases where a virtual switch would not improve either CPU consumption, throughput or both. So, if you now have stacks communicating to an OSA-Express through a stack router, then you will benefit by converting that router to a virtual switch.
Back to Table of Contents.
Queued I/O Assist
Introduction
The announcements for the z990 processor family and z/VM Version 4 Release 4.0 discussed performance improvements for V=V guests conducting networking activity via real networking devices that use the Queued Direct I/O (QDIO) facility.
The performance assist, called Queued I/O Assist, applies to the FICON Express card with FCP feature (FCP CHPID type), HiperSockets (IQD CHPID type), and OSA Express features (OSD CHPID type).
The performance improvements centered around replacing the heavyweight PCI interrupt interruption mechanism with a lighter adapter interrupt (AI) mechanism. The z990 was also equipped with AI delivery assists that let IBM remove AI delivery overhead.
There are three main components to the AI support:
- For the OSA Express and FICON Express features on z990 GA1 and later, IBM replaced the heavyweight PCI interrupt with a lightweight adapter interrupt. This requires changes to the OSA Express and FICON Express millicode so as to emit AIs, and it requires corresponding changes in z/VM so as to handle the AIs.
- For HiperSockets, OSA Express, and FICON Express, on z990 GA1 and later, IBM provided a z990 millicode assist that lets the z990 tell z/VM the identity of the nonrunning guest to which a presented AI should be delivered. This replaces z/VM's having to inspect its shadows of all guests' QDIO structures to find the guest to which the AI should be delivered. This portion of the assist is sometimes called the alerting portion of the assist.
- Also for HiperSockets, OSA Express, and FICON Express, on z990 GA1 and later, IBM provided a second z990 millicode assist that lets the z990 deliver an AI to a running guest without the guest leaving SIE. This eliminates traditional z/VM interrupt delivery overhead. This portion of the assist is sometimes called the passthrough portion of the assist.
Together these elements reduce the cost to the z/VM Control Program (CP) of delivering OSA Express, FICON Express, or HiperSockets interrupts to z/VM guests.
Finally, a word about nomenclature. The formal IBM terms for these enhancements are adapter interrupts and Queued I/O Assist. However, in informal IBM publications and dialogues, you might sometimes see adapter interrupts called thin interrupts. You might also see Queued I/O Assist called Adapter Interruption Passthrough. In this report, we will use the formal terms.
Measurement Environment
To measure the benefit of Queued I/O Assist, we set up two Linux guests on a single z/VM 4.4.0 image, running in an LPAR of a z990. We connected the two Linux images to one another via either HiperSockets (MFS 64K) or via a single OSA Express Gigabit Ethernet adapter (three device numbers to one Linux guest, another three device numbers on the same chpid to the other guest). We ran networking loads across these connections, using an IBM-internal version of Application Workload Modeler (AWM). There was no load on the z/VM system except these two Linux guests.
Details of the measured hardware and software configuration were:
Component | Level |
Hardware | An LPAR of a 2084-C24, MCL driver 52G, with EC J12558 at driver level 109, 2 dedicated engines, 2 GB central storage, 4 GB XSTORE. |
z/VM | For the base case, we used z/VM 4.3.0 with all corrective service applied. For the comparison case, we used z/VM 4.4.0 with the GA RSU applied, plus PTF UM31036. |
Linux | We used an IBM-internal Linux development driver, kernel level 2.4.20, with the June 2003 stream from IBM DeveloperWorks applied. |
It is important that customers wishing to use Queued I/O Assist in production, or customers wishing to conduct measurements of Queued I/O Assist benefits, apply all available corrective service for the z990, for z/VM, and for Linux for zSeries. See our z990 Queued I/O Assist page for an explanation of the levels required.
Abstracts of the workloads we ran:
Workload | Explanation |
Connect-Request-Response (CRR) | This workload simulates HTTP. The client connects to the server and sends a 64-byte request. The server responds with an 8192-byte response and closes the connection. The client and server continue exchanging data in this way until the end of the measurement period. |
Request-Response (RR) | This workload simulates Telnet. The client connects to the server and sends a 200-byte request. The server responds with a 1000-byte response, leaving the connection up. The client and server continue exchanging data on this connection until the end of the measurement period. |
Streams Get (STRG) | This workload simulates FTP. The client connects to the server and sends a 20-byte request. The server responds with a 20 MB response and closes the connection. The client and server continue exchanging data in this way until the end of the measurement period. |
For each workload, we ran several different MTU sizes and several different numbers of concurrent connections. Details are available in the charts and tables found below.
For each workload, we assessed performance using the following metrics:
Metric | Meaning |
tx/sec | Transactions performed per wall clock second. |
vCPU/tx | Virtual CPU time (aka emulation time) consumed by the Linux guests, per transaction. (VIRTCPU response field from CP QUERY TIME.) |
cCPU/tx | CP (Control Program) CPU time consumed per transaction. (TOTCPU minus VIRTCPU from CP QUERY TIME.) |
tCPU/tx | Total CPU time consumed per transaction. (TOTCPU from CP QUERY TIME.) |
Summary of Results
For the OSA Express Gigabit Ethernet and HiperSockets adapters, Table 1 summarizes the general changes in the performance metrics, comparing Linux running on z/VM 4.3.0 to Linux running on z/VM 4.4.0 with Queued I/O Assist enabled.
The changes cited in Table 1 represent average results observed across all MTU sizes and all numbers of concurrent connections. They are for planning and estimation purposes only. Precise results for specific measured configurations of interest are available in later sections of this report.
| Device | Workload | tx/sec | vCPU/tx | cCPU/tx | tCPU/tx |
|---|---|---|---|---|---|
| OSA Express Gigabit Ethernet | CRR | +9% | -1% | -28% | -12% |
|
| RR | +13% | -11% | -29% | -18% |
|
| STRG | +2% | -1% | -24% | -8% |
| HiperSockets | CRR | +4% | -1% | -6% | -4% |
|
| RR | +8% | -2% | -7% | -5% |
|
| STRG | +6% | flat | -5% | -2% |
| Note: Linux on z/VM 4.4.0 with Queued I/O Assist, compared to Linux on z/VM 4.3.0. 2084-C24, LPAR with 2 dedicated CPUs, 2 GB real, 4 GB XSTORE, LPAR dedicated to these runs. Linux 2.4.20, 31-bit, IBM-internal development driver. 256 MB Linux virtual uniprocessor machine, no swap partition, Linux DASD is dedicated 3390 volume or RAMAC equivalent. IBM-internal version of Application Workload Modeler (AWM). | |||||
Detailed Results
The tables below present experimental results for each
configuration.
Table 2. OSA Express Gigabit Ethernet, CRR, MTU 1492
| Concurrent Connections | Level | Tx/sec | vCPU/tx (msec) | cCPU/tx (msec) | tCPU/tx (msec) |
|---|---|---|---|---|---|
| 1 | z/VM 4.3.0 | 491.463 | 0.312 | 0.419 | 0.731 |
|
| z/VM 4.4.0 | 519.919 | 0.313 | 0.330 | 0.644 |
|
| delta | 28.456 | 0.001 | -0.088 | -0.087 |
|
| %delta | 5.790 | 0.410 | -21.101 | -11.916 |
| 10 | z/VM 4.3.0 | 1425.943 | 0.241 | 0.210 | 0.451 |
|
| z/VM 4.4.0 | 1591.787 | 0.235 | 0.146 | 0.381 |
|
| delta | 165.844 | -0.006 | -0.064 | -0.070 |
|
| %delta | 11.630 | -2.538 | -30.492 | -15.548 |
| 20 | z/VM 4.3.0 | 2149.476 | 0.206 | 0.125 | 0.331 |
|
| z/VM 4.4.0 | 2354.960 | 0.203 | 0.087 | 0.290 |
|
| delta | 205.484 | -0.004 | -0.038 | -0.041 |
|
| %delta | 9.560 | -1.758 | -30.229 | -12.511 |
| 50 | z/VM 4.3.0 | 3400.647 | 0.181 | 0.059 | 0.239 |
|
| z/VM 4.4.0 | 3620.217 | 0.179 | 0.043 | 0.222 |
|
| delta | 219.570 | -0.001 | -0.016 | -0.017 |
|
| %delta | 6.457 | -0.624 | -27.476 | -7.211 |
| Note: Configuration as described in summary table. | |||||
Table 3. OSA Express Gigabit Ethernet, CRR, MTU 8992
| Concurrent Connections | Level | Tx/sec | vCPU/tx (msec) | cCPU/tx (msec) | tCPU/tx (msec) |
|---|---|---|---|---|---|
| 1 | z/VM 4.3.0 | 762.926 | 0.211 | 0.274 | 0.485 |
|
| z/VM 4.4.0 | 834.195 | 0.210 | 0.209 | 0.419 |
|
| delta | 71.268 | -0.001 | -0.065 | -0.066 |
|
| %delta | 9.341 | -0.454 | -23.630 | -13.557 |
| 10 | z/VM 4.3.0 | 2211.706 | 0.169 | 0.134 | 0.303 |
|
| z/VM 4.4.0 | 2452.266 | 0.165 | 0.093 | 0.258 |
|
| delta | 240.560 | -0.004 | -0.041 | -0.045 |
|
| %delta | 10.877 | -2.481 | -30.409 | -14.848 |
| 20 | z/VM 4.3.0 | 3299.491 | 0.148 | 0.083 | 0.231 |
|
| z/VM 4.4.0 | 3598.624 | 0.146 | 0.057 | 0.203 |
|
| delta | 299.132 | -0.002 | -0.026 | -0.028 |
|
| %delta | 9.066 | -1.665 | -30.943 | -12.167 |
| 50 | z/VM 4.3.0 | 5306.315 | 0.132 | 0.040 | 0.172 |
|
| z/VM 4.4.0 | 5615.214 | 0.130 | 0.029 | 0.159 |
|
| delta | 308.899 | -0.001 | -0.011 | -0.012 |
|
| %delta | 5.821 | -1.077 | -27.007 | -7.087 |
| Note: Configuration as described in summary table. | |||||
Table 4. OSA Express Gigabit Ethernet, RR, MTU 1492
| Concurrent Connections | Level | Tx/sec | vCPU/tx (msec) | cCPU/tx (msec) | tCPU/tx (msec) |
|---|---|---|---|---|---|
| 1 | z/VM 4.3.0 | 1991.802 | 0.070 | 0.062 | 0.132 |
|
| z/VM 4.4.0 | 2240.960 | 0.053 | 0.054 | 0.106 |
|
| delta | 249.158 | -0.017 | -0.008 | -0.026 |
|
| %delta | 12.509 | -24.720 | -13.515 | -19.453 |
| 10 | z/VM 4.3.0 | 6385.912 | 0.049 | 0.052 | 0.101 |
|
| z/VM 4.4.0 | 6987.427 | 0.044 | 0.035 | 0.079 |
|
| delta | 601.516 | -0.005 | -0.017 | -0.022 |
|
| %delta | 9.419 | -9.632 | -32.953 | -21.634 |
| 20 | z/VM 4.3.0 | 9465.164 | 0.042 | 0.034 | 0.076 |
|
| z/VM 4.4.0 | 10852.571 | 0.040 | 0.023 | 0.062 |
|
| delta | 1387.407 | -0.002 | -0.011 | -0.014 |
|
| %delta | 14.658 | -5.577 | -33.333 | -18.049 |
| 50 | z/VM 4.3.0 | 16334.023 | 0.036 | 0.018 | 0.053 |
|
| z/VM 4.4.0 | 18183.309 | 0.034 | 0.011 | 0.046 |
|
| delta | 1849.287 | -0.001 | -0.006 | -0.008 |
|
| %delta | 11.322 | -3.975 | -34.814 | -14.149 |
| Note: Configuration as described in summary table. | |||||
Table 5. OSA Express Gigabit Ethernet, RR, MTU 8992
| Concurrent Connections | Level | Tx/sec | vCPU/tx (msec) | cCPU/tx (msec) | tCPU/tx (msec) |
|---|---|---|---|---|---|
| 1 | z/VM 4.3.0 | 1992.247 | 0.072 | 0.062 | 0.133 |
|
| z/VM 4.4.0 | 2240.208 | 0.054 | 0.054 | 0.108 |
|
| delta | 247.960 | -0.018 | -0.008 | -0.026 |
|
| %delta | 12.446 | -24.592 | -13.337 | -19.371 |
| 10 | z/VM 4.3.0 | 6380.193 | 0.050 | 0.052 | 0.102 |
|
| z/VM 4.4.0 | 7422.396 | 0.046 | 0.035 | 0.081 |
|
| delta | 1042.203 | -0.004 | -0.017 | -0.021 |
|
| %delta | 16.335 | -7.449 | -32.723 | -20.390 |
| 20 | z/VM 4.3.0 | 9457.137 | 0.042 | 0.034 | 0.077 |
|
| z/VM 4.4.0 | 10838.895 | 0.040 | 0.023 | 0.063 |
|
| delta | 1381.758 | -0.002 | -0.011 | -0.014 |
|
| %delta | 14.611 | -5.000 | -33.357 | -17.682 |
| 50 | z/VM 4.3.0 | 16308.725 | 0.036 | 0.018 | 0.054 |
|
| z/VM 4.4.0 | 18151.125 | 0.035 | 0.011 | 0.046 |
|
| delta | 1842.400 | -0.001 | -0.006 | -0.008 |
|
| %delta | 11.297 | -3.728 | -35.248 | -14.018 |
| Note: Configuration as described in summary table. | |||||
Table 6. OSA Express Gigabit Ethernet, STRG, MTU 1492
| Concurrent Connections | Level | Tx/sec | vCPU/tx (msec) | cCPU/tx (msec) | tCPU/tx (msec) |
|---|---|---|---|---|---|
| 1 | z/VM 4.3.0 | 1.558 | 195.181 | 164.223 | 359.404 |
|
| z/VM 4.4.0 | 1.735 | 189.244 | 114.029 | 303.273 |
|
| delta | 0.176 | -5.937 | -50.195 | -56.132 |
|
| %delta | 11.312 | -3.042 | -30.565 | -15.618 |
| 10 | z/VM 4.3.0 | 3.610 | 165.068 | 49.109 | 214.177 |
|
| z/VM 4.4.0 | 3.761 | 163.832 | 38.026 | 201.859 |
|
| delta | 0.151 | -1.236 | -11.083 | -12.319 |
|
| %delta | 4.178 | -0.749 | -22.567 | -5.752 |
| 20 | z/VM 4.3.0 | 3.630 | 172.477 | 46.864 | 219.341 |
|
| z/VM 4.4.0 | 3.799 | 173.370 | 35.609 | 208.978 |
|
| delta | 0.169 | 0.892 | -11.255 | -10.363 |
|
| %delta | 4.652 | 0.517 | -24.016 | -4.724 |
| 50 | z/VM 4.3.0 | 3.632 | 180.960 | 45.671 | 226.631 |
|
| z/VM 4.4.0 | 3.834 | 177.739 | 34.526 | 212.265 |
|
| delta | 0.202 | -3.221 | -11.145 | -14.366 |
|
| %delta | 5.552 | -1.780 | -24.403 | -6.339 |
| Note: Configuration as described in summary table. | |||||
Table 7. OSA Express Gigabit Ethernet, STRG, MTU 8992
| Concurrent Connections | Level | Tx/sec | vCPU/tx (msec) | cCPU/tx (msec) | tCPU/tx (msec) |
|---|---|---|---|---|---|
| 1 | z/VM 4.3.0 | 2.524 | 100.455 | 101.155 | 201.611 |
|
| z/VM 4.4.0 | 2.642 | 100.726 | 85.489 | 186.215 |
|
| delta | 0.118 | 0.270 | -15.666 | -15.396 |
|
| %delta | 4.674 | 0.269 | -15.487 | -7.637 |
| 10 | z/VM 4.3.0 | 5.951 | 79.625 | 39.403 | 119.028 |
|
| z/VM 4.4.0 | 5.532 | 76.036 | 27.340 | 103.376 |
|
| delta | -0.419 | -3.589 | -12.062 | -15.652 |
|
| %delta | -7.046 | -4.508 | -30.613 | -13.150 |
| 20 | z/VM 4.3.0 | 6.380 | 76.610 | 28.833 | 105.444 |
|
| z/VM 4.4.0 | 6.035 | 77.168 | 21.765 | 98.932 |
|
| delta | -0.345 | 0.557 | -7.068 | -6.511 |
|
| %delta | -5.406 | 0.727 | -24.515 | -6.175 |
| 50 | z/VM 4.3.0 | 6.594 | 77.005 | 22.353 | 99.358 |
|
| z/VM 4.4.0 | 6.304 | 75.353 | 17.950 | 93.303 |
|
| delta | -0.290 | -1.653 | -4.403 | -6.055 |
|
| %delta | -4.402 | -2.146 | -19.696 | -6.094 |
| Note: Configuration as described in summary table. | |||||
Table 8. HiperSockets, CRR, MTU 8992
| Concurrent Connections | Level | Tx/sec | vCPU/tx (msec) | cCPU/tx (msec) | tCPU/tx (msec) |
|---|---|---|---|---|---|
| 1 | z/VM 4.3.0 | 3284.418 | 0.188 | 0.228 | 0.416 |
|
| z/VM 4.4.0 | 3520.699 | 0.186 | 0.215 | 0.402 |
|
| delta | 236.281 | -0.002 | -0.012 | -0.014 |
|
| %delta | 7.194 | -0.931 | -5.467 | -3.414 |
| 10 | z/VM 4.3.0 | 4537.796 | 0.172 | 0.189 | 0.361 |
|
| z/VM 4.4.0 | 4721.925 | 0.170 | 0.180 | 0.350 |
|
| delta | 184.129 | -0.002 | -0.009 | -0.012 |
|
| %delta | 4.058 | -1.355 | -4.901 | -3.210 |
| 20 | z/VM 4.3.0 | 4574.064 | 0.172 | 0.186 | 0.358 |
|
| z/VM 4.4.0 | 4717.406 | 0.169 | 0.174 | 0.343 |
|
| delta | 143.342 | -0.004 | -0.012 | -0.015 |
|
| %delta | 3.134 | -2.108 | -6.326 | -4.300 |
| 50 | z/VM 4.3.0 | 4526.479 | 0.173 | 0.186 | 0.360 |
|
| z/VM 4.4.0 | 4493.266 | 0.169 | 0.173 | 0.342 |
|
| delta | -33.213 | -0.004 | -0.014 | -0.017 |
|
| %delta | -0.734 | -2.147 | -7.283 | -4.810 |
| Note: Configuration as described in summary table. | |||||
Table 9. HiperSockets, CRR, MTU 16384
| Concurrent Connections | Level | Tx/sec | vCPU/tx (msec) | cCPU/tx (msec) | tCPU/tx (msec) |
|---|---|---|---|---|---|
| 1 | z/VM 4.3.0 | 3306.553 | 0.188 | 0.228 | 0.417 |
|
| z/VM 4.4.0 | 3511.288 | 0.187 | 0.215 | 0.402 |
|
| delta | 204.736 | -0.002 | -0.013 | -0.015 |
|
| %delta | 6.192 | -0.953 | -5.908 | -3.668 |
| 10 | z/VM 4.3.0 | 4514.058 | 0.173 | 0.189 | 0.361 |
|
| z/VM 4.4.0 | 4629.770 | 0.172 | 0.180 | 0.352 |
|
| delta | 115.712 | -0.001 | -0.008 | -0.009 |
|
| %delta | 2.563 | -0.663 | -4.352 | -2.589 |
| 20 | z/VM 4.3.0 | 4547.080 | 0.172 | 0.186 | 0.358 |
|
| z/VM 4.4.0 | 4691.305 | 0.169 | 0.174 | 0.344 |
|
| delta | 144.225 | -0.003 | -0.012 | -0.015 |
|
| %delta | 3.172 | -1.782 | -6.298 | -4.128 |
| 50 | z/VM 4.3.0 | 4489.159 | 0.173 | 0.186 | 0.359 |
|
| z/VM 4.4.0 | 4534.121 | 0.170 | 0.173 | 0.343 |
|
| delta | 44.962 | -0.004 | -0.013 | -0.016 |
|
| %delta | 1.002 | -2.052 | -6.767 | -4.495 |
| Note: Configuration as described in summary table. | |||||
Table 10. HiperSockets, CRR, MTU 32768
| Concurrent Connections | Level | Tx/sec | vCPU/tx (msec) | cCPU/tx (msec) | tCPU/tx (msec) |
|---|---|---|---|---|---|
| 1 | z/VM 4.3.0 | 3284.260 | 0.190 | 0.228 | 0.418 |
|
| z/VM 4.4.0 | 3521.537 | 0.187 | 0.216 | 0.403 |
|
| delta | 237.276 | -0.003 | -0.012 | -0.016 |
|
| %delta | 7.225 | -1.776 | -5.438 | -3.771 |
| 10 | z/VM 4.3.0 | 4455.185 | 0.173 | 0.188 | 0.362 |
|
| z/VM 4.4.0 | 4649.816 | 0.172 | 0.180 | 0.352 |
|
| delta | 194.631 | -0.002 | -0.008 | -0.010 |
|
| %delta | 4.369 | -0.865 | -4.489 | -2.751 |
| 20 | z/VM 4.3.0 | 4501.635 | 0.173 | 0.186 | 0.359 |
|
| z/VM 4.4.0 | 4486.334 | 0.169 | 0.176 | 0.345 |
|
| delta | -15.301 | -0.004 | -0.010 | -0.014 |
|
| %delta | -0.340 | -2.226 | -5.343 | -3.840 |
| 50 | z/VM 4.3.0 | 4476.254 | 0.174 | 0.186 | 0.360 |
|
| z/VM 4.4.0 | 4591.581 | 0.170 | 0.174 | 0.344 |
|
| delta | 115.327 | -0.004 | -0.012 | -0.016 |
|
| %delta | 2.576 | -2.173 | -6.386 | -4.351 |
| Note: Configuration as described in summary table. | |||||
Table 11. HiperSockets, CRR, MTU 57344
| Concurrent Connections | Level | Tx/sec | vCPU/tx (msec) | cCPU/tx (msec) | tCPU/tx (msec) |
|---|---|---|---|---|---|
| 1 | z/VM 4.3.0 | 3260.237 | 0.190 | 0.225 | 0.415 |
|
| z/VM 4.4.0 | 3497.269 | 0.188 | 0.217 | 0.405 |
|
| delta | 237.033 | -0.001 | -0.009 | -0.010 |
|
| %delta | 7.270 | -0.577 | -3.801 | -2.328 |
| 10 | z/VM 4.3.0 | 4488.407 | 0.174 | 0.188 | 0.362 |
|
| z/VM 4.4.0 | 4646.812 | 0.173 | 0.181 | 0.354 |
|
| delta | 158.405 | -0.001 | -0.007 | -0.008 |
|
| %delta | 3.529 | -0.326 | -3.893 | -2.181 |
| 20 | z/VM 4.3.0 | 4515.199 | 0.174 | 0.186 | 0.359 |
|
| z/VM 4.4.0 | 4688.292 | 0.171 | 0.176 | 0.346 |
|
| delta | 173.093 | -0.003 | -0.010 | -0.013 |
|
| %delta | 3.834 | -1.580 | -5.498 | -3.606 |
| 50 | z/VM 4.3.0 | 4442.913 | 0.174 | 0.186 | 0.360 |
|
| z/VM 4.4.0 | 4521.320 | 0.171 | 0.174 | 0.345 |
|
| delta | 78.408 | -0.003 | -0.012 | -0.015 |
|
| %delta | 1.765 | -1.738 | -6.461 | -4.174 |
| Note: Configuration as described in summary table. | |||||
Table 12. HiperSockets, RR, MTU 8992
| Concurrent Connections | Level | Tx/sec | vCPU/tx (msec) | cCPU/tx (msec) | tCPU/tx (msec) |
|---|---|---|---|---|---|
| 1 | z/VM 4.3.0 | 12659.339 | 0.042 | 0.049 | 0.091 |
|
| z/VM 4.4.0 | 12958.381 | 0.042 | 0.048 | 0.089 |
|
| delta | 299.043 | 0.000 | -0.002 | -0.002 |
|
| %delta | 2.362 | -0.291 | -3.573 | -2.066 |
| 10 | z/VM 4.3.0 | 17085.596 | 0.043 | 0.044 | 0.087 |
|
| z/VM 4.4.0 | 19681.727 | 0.040 | 0.039 | 0.079 |
|
| delta | 2596.131 | -0.003 | -0.005 | -0.008 |
|
| %delta | 15.195 | -7.284 | -11.096 | -9.192 |
| 20 | z/VM 4.3.0 | 18547.824 | 0.042 | 0.041 | 0.083 |
|
| z/VM 4.4.0 | 19728.350 | 0.041 | 0.038 | 0.080 |
|
| delta | 1180.527 | -0.001 | -0.002 | -0.003 |
|
| %delta | 6.365 | -1.482 | -6.023 | -3.717 |
| 50 | z/VM 4.3.0 | 19161.731 | 0.043 | 0.038 | 0.081 |
|
| z/VM 4.4.0 | 19813.819 | 0.043 | 0.036 | 0.079 |
|
| delta | 652.088 | 0.000 | -0.001 | -0.002 |
|
| %delta | 3.403 | -0.243 | -3.764 | -1.894 |
| Note: Configuration as described in summary table. | |||||
Table 13. HiperSockets, RR, MTU 16384
| Concurrent Connections | Level | Tx/sec | vCPU/tx (msec) | cCPU/tx (msec) | tCPU/tx (msec) |
|---|---|---|---|---|---|
| 1 | z/VM 4.3.0 | 12652.137 | 0.042 | 0.049 | 0.091 |
|
| z/VM 4.4.0 | 12903.722 | 0.042 | 0.048 | 0.090 |
|
| delta | 251.584 | 0.000 | -0.002 | -0.001 |
|
| %delta | 1.988 | 0.405 | -3.313 | -1.606 |
| 10 | z/VM 4.3.0 | 17225.963 | 0.043 | 0.044 | 0.087 |
|
| z/VM 4.4.0 | 19242.936 | 0.041 | 0.039 | 0.079 |
|
| delta | 2016.973 | -0.002 | -0.005 | -0.007 |
|
| %delta | 11.709 | -5.766 | -11.355 | -8.576 |
| 20 | z/VM 4.3.0 | 18558.169 | 0.042 | 0.041 | 0.083 |
|
| z/VM 4.4.0 | 21767.563 | 0.041 | 0.036 | 0.077 |
|
| delta | 3209.394 | -0.001 | -0.005 | -0.006 |
|
| %delta | 17.294 | -3.372 | -12.231 | -7.751 |
| 50 | z/VM 4.3.0 | 19325.624 | 0.043 | 0.038 | 0.081 |
|
| z/VM 4.4.0 | 19497.133 | 0.042 | 0.036 | 0.079 |
|
| delta | 171.510 | 0.000 | -0.002 | -0.002 |
|
| %delta | 0.887 | -1.037 | -4.691 | -2.758 |
| Note: Configuration as described in summary table. | |||||
Table 14. HiperSockets, RR, MTU 32768
| Concurrent Connections | Level | Tx/sec | vCPU/tx (msec) | cCPU/tx (msec) | tCPU/tx (msec) |
|---|---|---|---|---|---|
| 1 | z/VM 4.3.0 | 12631.402 | 0.042 | 0.049 | 0.091 |
|
| z/VM 4.4.0 | 12936.554 | 0.042 | 0.048 | 0.089 |
|
| delta | 305.153 | 0.000 | -0.002 | -0.002 |
|
| %delta | 2.416 | 0.433 | -3.615 | -1.761 |
| 10 | z/VM 4.3.0 | 17114.653 | 0.043 | 0.044 | 0.087 |
|
| z/VM 4.4.0 | 20077.202 | 0.040 | 0.039 | 0.079 |
|
| delta | 2962.549 | -0.003 | -0.005 | -0.008 |
|
| %delta | 17.310 | -7.099 | -10.865 | -8.988 |
| 20 | z/VM 4.3.0 | 18418.905 | 0.042 | 0.041 | 0.084 |
|
| z/VM 4.4.0 | 21571.289 | 0.040 | 0.036 | 0.076 |
|
| delta | 3152.385 | -0.002 | -0.006 | -0.007 |
|
| %delta | 17.115 | -4.244 | -13.371 | -8.757 |
| 50 | z/VM 4.3.0 | 19163.273 | 0.043 | 0.038 | 0.081 |
|
| z/VM 4.4.0 | 19707.818 | 0.043 | 0.036 | 0.079 |
|
| delta | 544.545 | 0.000 | -0.002 | -0.002 |
|
| %delta | 2.842 | -0.072 | -4.112 | -1.970 |
| Note: Configuration as described in summary table. | |||||
Table 15. HiperSockets, RR, MTU 57344
| Concurrent Connections | Level | Tx/sec | vCPU/tx (msec) | cCPU/tx (msec) | tCPU/tx (msec) |
|---|---|---|---|---|---|
| 1 | z/VM 4.3.0 | 12678.343 | 0.042 | 0.049 | 0.091 |
|
| z/VM 4.4.0 | 12979.411 | 0.042 | 0.047 | 0.089 |
|
| delta | 301.068 | 0.000 | -0.002 | -0.002 |
|
| %delta | 2.375 | -0.090 | -3.647 | -2.014 |
| 10 | z/VM 4.3.0 | 17104.270 | 0.043 | 0.043 | 0.087 |
|
| z/VM 4.4.0 | 18995.322 | 0.040 | 0.039 | 0.079 |
|
| delta | 1891.052 | -0.003 | -0.004 | -0.007 |
|
| %delta | 11.056 | -6.705 | -10.353 | -8.530 |
| 20 | z/VM 4.3.0 | 18405.769 | 0.042 | 0.041 | 0.083 |
|
| z/VM 4.4.0 | 19798.269 | 0.041 | 0.038 | 0.080 |
|
| delta | 1392.501 | -0.001 | -0.003 | -0.003 |
|
| %delta | 7.566 | -1.740 | -6.432 | -4.054 |
| 50 | z/VM 4.3.0 | 19264.102 | 0.043 | 0.038 | 0.081 |
|
| z/VM 4.4.0 | 19604.354 | 0.042 | 0.036 | 0.078 |
|
| delta | 340.252 | 0.000 | -0.002 | -0.002 |
|
| %delta | 1.766 | -0.956 | -4.793 | -2.760 |
| Note: Configuration as described in summary table. | |||||
Table 16. HiperSockets, STRG, MTU 8992
| Concurrent Connections | Level | Tx/sec | vCPU/tx (msec) | cCPU/tx (msec) | tCPU/tx (msec) |
|---|---|---|---|---|---|
| 1 | z/VM 4.3.0 | 8.800 | 91.936 | 90.799 | 182.735 |
|
| z/VM 4.4.0 | 9.730 | 86.445 | 78.041 | 164.486 |
|
| delta | 0.930 | -5.490 | -12.758 | -18.249 |
|
| %delta | 10.567 | -5.972 | -14.051 | -9.986 |
| 10 | z/VM 4.3.0 | 10.747 | 86.325 | 78.230 | 164.555 |
|
| z/VM 4.4.0 | 10.974 | 86.514 | 74.311 | 160.824 |
|
| delta | 0.227 | 0.189 | -3.920 | -3.731 |
|
| %delta | 2.113 | 0.219 | -5.011 | -2.267 |
| 20 | z/VM 4.3.0 | 10.492 | 86.294 | 77.635 | 163.929 |
|
| z/VM 4.4.0 | 10.850 | 86.913 | 74.332 | 161.245 |
|
| delta | 0.358 | 0.619 | -3.303 | -2.684 |
|
| %delta | 3.411 | 0.717 | -4.255 | -1.637 |
| 50 | z/VM 4.3.0 | 10.311 | 87.396 | 77.557 | 164.954 |
|
| z/VM 4.4.0 | 10.558 | 87.756 | 74.087 | 161.844 |
|
| delta | 0.247 | 0.360 | -3.470 | -3.110 |
|
| %delta | 2.397 | 0.412 | -4.474 | -1.885 |
| Note: Configuration as described in summary table. | |||||
Table 17. HiperSockets, STRG, MTU 16384
| Concurrent Connections | Level | Tx/sec | vCPU/tx (msec) | cCPU/tx (msec) | tCPU/tx (msec) |
|---|---|---|---|---|---|
| 1 | z/VM 4.3.0 | 10.630 | 76.909 | 66.497 | 143.406 |
|
| z/VM 4.4.0 | 11.930 | 70.779 | 53.602 | 124.381 |
|
| delta | 1.300 | -6.130 | -12.895 | -19.025 |
|
| %delta | 12.227 | -7.970 | -19.392 | -13.266 |
| 10 | z/VM 4.3.0 | 12.150 | 74.404 | 60.463 | 134.867 |
|
| z/VM 4.4.0 | 12.843 | 73.457 | 55.045 | 128.503 |
|
| delta | 0.693 | -0.947 | -5.417 | -6.364 |
|
| %delta | 5.707 | -1.272 | -8.960 | -4.719 |
| 20 | z/VM 4.3.0 | 12.020 | 74.345 | 60.075 | 134.420 |
|
| z/VM 4.4.0 | 12.702 | 74.039 | 55.285 | 129.324 |
|
| delta | 0.681 | -0.306 | -4.790 | -5.095 |
|
| %delta | 5.667 | -0.411 | -7.973 | -3.791 |
| 50 | z/VM 4.3.0 | 11.952 | 75.360 | 60.459 | 135.819 |
|
| z/VM 4.4.0 | 12.584 | 74.285 | 54.609 | 128.894 |
|
| delta | 0.631 | -1.076 | -5.850 | -6.925 |
|
| %delta | 5.283 | -1.427 | -9.675 | -5.099 |
| Note: Configuration as described in summary table. | |||||
Table 18. HiperSockets, STRG, MTU 32768
| Concurrent Connections | Level | Tx/sec | vCPU/tx (msec) | cCPU/tx (msec) | tCPU/tx (msec) |
|---|---|---|---|---|---|
| 1 | z/VM 4.3.0 | 5.927 | 57.809 | 34.667 | 92.477 |
|
| z/VM 4.4.0 | 16.307 | 58.629 | 34.768 | 93.396 |
|
| delta | 10.380 | 0.819 | 0.100 | 0.919 |
|
| %delta | 175.148 | 1.417 | 0.289 | 0.994 |
| 10 | z/VM 4.3.0 | 15.612 | 59.836 | 35.985 | 95.821 |
|
| z/VM 4.4.0 | 15.969 | 60.331 | 35.567 | 95.899 |
|
| delta | 0.356 | 0.496 | -0.418 | 0.078 |
|
| %delta | 2.282 | 0.828 | -1.160 | 0.081 |
| 20 | z/VM 4.3.0 | 14.993 | 60.152 | 35.799 | 95.951 |
|
| z/VM 4.4.0 | 15.210 | 60.777 | 35.382 | 96.159 |
|
| delta | 0.218 | 0.625 | -0.417 | 0.208 |
|
| %delta | 1.452 | 1.040 | -1.165 | 0.217 |
| 50 | z/VM 4.3.0 | 15.206 | 61.264 | 36.655 | 97.919 |
|
| z/VM 4.4.0 | 15.415 | 61.786 | 35.894 | 97.680 |
|
| delta | 0.209 | 0.523 | -0.761 | -0.239 |
|
| %delta | 1.373 | 0.853 | -2.077 | -0.244 |
| Note: Configuration as described in summary table. | |||||
Table 19. HiperSockets, STRG, MTU 57344
| Concurrent Connections | Level | Tx/sec | vCPU/tx (msec) | cCPU/tx (msec) | tCPU/tx (msec) |
|---|---|---|---|---|---|
| 1 | z/VM 4.3.0 | 13.072 | 59.347 | 34.576 | 93.924 |
|
| z/VM 4.4.0 | 15.476 | 60.047 | 35.453 | 95.501 |
|
| delta | 2.404 | 0.700 | 0.877 | 1.577 |
|
| %delta | 18.387 | 1.180 | 2.536 | 1.679 |
| 10 | z/VM 4.3.0 | 15.183 | 60.635 | 35.247 | 95.882 |
|
| z/VM 4.4.0 | 15.434 | 61.551 | 35.480 | 97.030 |
|
| delta | 0.251 | 0.916 | 0.233 | 1.148 |
|
| %delta | 1.653 | 1.510 | 0.660 | 1.198 |
| 20 | z/VM 4.3.0 | 14.708 | 61.168 | 35.471 | 96.639 |
|
| z/VM 4.4.0 | 15.047 | 61.844 | 35.429 | 97.274 |
|
| delta | 0.339 | 0.676 | -0.041 | 0.635 |
|
| %delta | 2.303 | 1.105 | -0.116 | 0.657 |
| 50 | z/VM 4.3.0 | 14.974 | 62.025 | 36.183 | 98.209 |
|
| z/VM 4.4.0 | 15.104 | 62.983 | 35.908 | 98.891 |
|
| delta | 0.130 | 0.957 | -0.275 | 0.682 |
|
| %delta | 0.869 | 1.543 | -0.760 | 0.695 |
| Note: Configuration as described in summary table. | |||||
Representative Charts
So as to illustrate trends and typical results found in the experiments, we include here some charts that illustrate certain selected experimental results.
Each chart illustrates the
ratio of the comparison case to
the base case, for the four key measures,
for a certain device type, workload type, and MTU size.
A ratio less than 1 indicates that the metric
decreased in the comparison case. A ratio greater than
1 indicates that the metric increased in the
comparison case.
Table 20. OSA Express Gigabit Ethernet CRR
|
Ratio of Linux on z/VM 4.4.0 to Linux on z/VM 4.3.0,
OSA Express Gigabit Ethernet, CRR
|
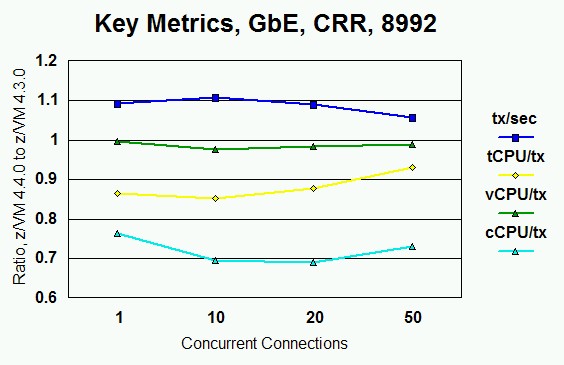 |
| Note: Ratio of Linux on z/VM 4.4.0 to Linux on z/VM 4.3.0, OSA Express Gigabit Ethernet, CRR workload, MTU 8992, 1, 10, 20, and 50 concurrent connections, over four key metrics. |
Table 21. OSA Express Gigabit Ethernet RR
|
Ratio of Linux on z/VM 4.4.0 to Linux on z/VM 4.3.0,
OSA Express Gigabit Ethernet, RR
|
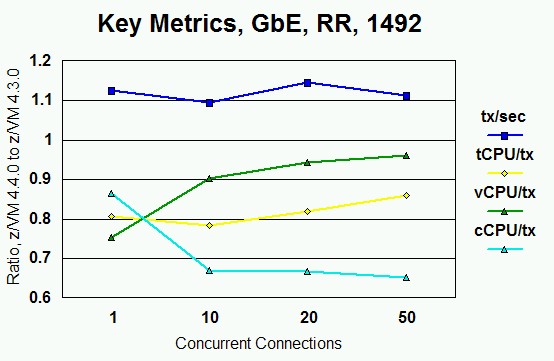 |
| Note: Ratio of Linux on z/VM 4.4.0 to Linux on z/VM 4.3.0, OSA Express Gigabit Ethernet, RR workload, MTU 1492, 1, 10, 20, and 50 concurrent connections, over four key metrics. |
Table 22. OSA Express Gigabit Ethernet STRG
|
Ratio of Linux on z/VM 4.4.0 to Linux on z/VM 4.3.0,
OSA Express Gigabit Ethernet, STRG
|
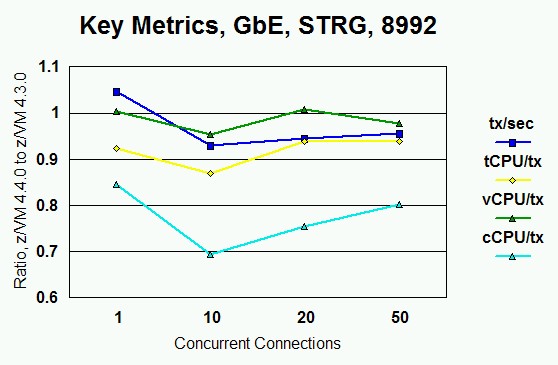 |
| Note: Ratio of Linux on z/VM 4.4.0 to Linux on z/VM 4.3.0, OSA Express Gigabit Ethernet, STRG workload, MTU 8992, 1, 10, 20, and 50 concurrent connections, over four key metrics. |
|
Ratio of Linux on z/VM 4.4.0 to Linux on z/VM 4.3.0,
HiperSockets, CRR
|
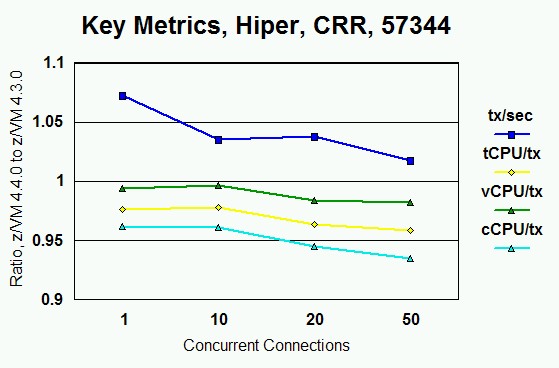 |
| Note: Ratio of Linux on z/VM 4.4.0 to Linux on z/VM 4.3.0, HiperSockets (MFS 64K), CRR workload, MTU 57344, 1, 10, 20, and 50 concurrent connections, over four key metrics. |
|
Ratio of Linux on z/VM 4.4.0 to Linux on z/VM 4.3.0,
HiperSockets, RR
|
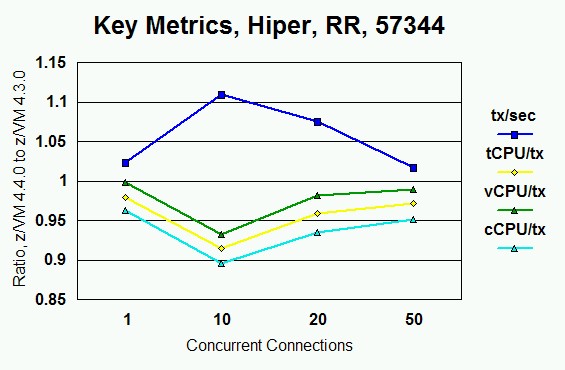 |
| Note: Ratio of Linux on z/VM 4.4.0 to Linux on z/VM 4.3.0, HiperSockets (MFS 64K), RR workload, MTU 57344, 1, 10, 20, and 50 concurrent connections, over four key metrics. |
|
Ratio of Linux on z/VM 4.4.0 to Linux on z/VM 4.3.0,
HiperSockets, STRG
|
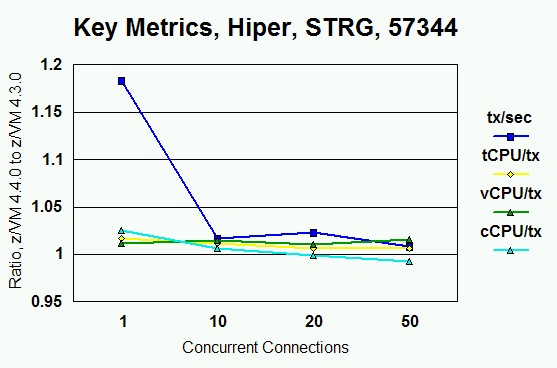 |
| Note: Ratio of Linux on z/VM 4.4.0 to Linux on z/VM 4.3.0, HiperSockets (MFS 64K), STRG workload, MTU 57344, 1, 10, 20, and 50 concurrent connections, over four key metrics. |
Discussion of Results
IBM's intention for Queued I/O Assist was to reduce host (z/VM Control Program) processing time per transaction by removing some of the overhead and complexity associated with interrupt delivery. The measurements here show that the assist did its work:
- For OSA Express Gigabit Ethernet, the assist removed about 27% of the CP processing time per transaction, considered over all transaction types.
- For HiperSockets, the assist removed about 6% of the CP processing time per transaction, considered over all transaction types.
We saw, and were pleased by, attendant rises in transaction rates, though the intent of the assist was to attack host processor time per transaction, not necessarily transaction rate. (Other factors, notably the z990 having to wait on the OSA Express card, limit transaction rate.)
We did not expect the assist to have much of an effect on virtual time per transaction. By and large this turned out to be the case. The OSA Express Gigabit Ethernet RR workload is somewhat of an unexplained anomaly in this regard.
The reader will notice we published only Linux numbers for evaluating this assist. The CP time induced by a Linux guest in these workloads is largely confined to the work CP does to shadow the guest's QDIO tables and interact with the real QDIO device. This means Linux is an appropriate guest to use for assessing the effect of an assist such as this, because the runs are not polluted with other work CP might be doing on behalf of the guests.
We did perform Queued I/O Assist experiments for the VM TCP/IP stack. We saw little to no effect on the VM stack's CP time per transaction. One reason for this is that the work CP does for the VM stack is made up of lots of other kinds of CP work (namely, IUCV to the CMS clients) on which the assist has no effect. Another reason for this is that CP actually does less QDIO device management work for the VM stack than it does for Linux, because the VM stack uses Diag X'98' to drive the adapter and thereby has no shadow tables. Thus there is less opportunity to remove CP QDIO overhead from the VM stack case.
Similarly, a Linux QDIO workload in a customer environment might not experience the percentage changes in CP time that we experienced in these workloads. If the customer's Linux guest is doing CP work other than QDIO (e.g., paging, DASD I/O), said other work will tend to dilute the percentage changes offered by these QDIO improvements.
These workloads used only two Linux guests, running networking benchmark code flat-out, in a two-way dedicated LPAR. This environment is particularly well-disposed toward keeping the guests in SIE and thus letting the passthrough portion of the assist have its full effect. In workloads where there are a large number of diverse guests, it is less likely that a guest using a QDIO device will happen to be in SIE at the moment its interrupt arrives from the adapter. Thus it can be expected that the effect of the passthrough portion of the assist will be diluted in such an environment. Note that the alerting portion of the assist still applies.
CP does offer a NOQIOASSIST option on the ATTACH command, so as to turn off the alerting portion of the assist. When ATTACH NOQIOASSIST is in effect, z/VM instructs the z990 not to issue AI alerts; rather, z/VM handles the AIs the "old way", that is, for each arriving AI, z/VM searches all guests' QDIO shadow queues to find the guest to which the AI should be presented. This option is intended for debugging or for circumventing field problems discovered in the alerting logic.
Similarly, CP offers a SET QIOASSIST OFF command. This command turns off the passthrough portion of the assist. When the passthrough assist is turned off, z/VM fields the AI and stacks the interrupt for the guest, in the same manner as it would stack other kinds of interrupts for the guest. Again, this command is intended for debugging or for circumventing field problems in z990 millicode.
Back to Table of Contents.
TCP/IP Stack Improvement Part 2
In TCP/IP 430, performance enhancements were made to the VM TCP/IP stack focusing on the device layer (see TCP/IP Stack Performance Improvements). For TCP/IP 440, the focus of the enhancements was on the TCP layer and the major socket functions. As in TCP/IP 430, the improvements in TCP/IP 440 were achieved by optimizing high-use paths, improving algorithms, and implementing performance related features. The goal of these improvements was to increase the performance of the stack when it is acting as a host. This section summarizes the results of a performance evaluation of these improvements by comparing TCP/IP 430 with TCP/IP 440.
Methodology: An internal tool was used to drive connect-request-response (CRR), streaming and request-response(RR) workloads utilizing either the TCP or UPD TCP/IP protocols. The CRR workload had the client connecting, sending 64 bytes to the server, the server responding with 8K and the client then disconnecting utilizing the TCP protocol. The streaming workload consisted of the client sending 1 byte to the server and the server responding with 20MB utilizing the TCP protocol. The RR workload utilized the UDP protocol and consisted of the client sending 200 bytes to the server and the server responding with 1000 bytes. In each case above, the client/server sequences were repeated for 400 seconds. A complete set of runs, consisting of 3 trials for each case, was done.
The measurements were done on a 2064-109 with 3 dedicated processors for the LPAR used. The LPAR had 1GB of central storage and 2GB expanded storage. CP monitor data was captured for the LPAR during the measurement and reduced using VMPRF.
In the measurement environment there was one client, one server, and one TCP/IP stack. Both the client and the server communicated with the TCP/IP stack using IUCV via the loopback feature of TCP/IP.
Results:
The following tables show the comparison between results on
TCP/IP 430 and the enhancements on TCP/IP 440. MB/sec (megabytes
per second) or trans/sec (transactions per second) were supplied
by the workload driver and shows the throughput rate. All other
values are from CP monitor data or derived from CP monitor data.
Table 1. CRR Workload (TCP protocol)
runid TCP/IP Level | icr0b01 4.3.0 | icr0n10 4.4.0 | Percent Difference |
trans/sec tot_cpu_util tot_cpu_msec/trans emul_msec/trans cp_msec/trans | 43.79 34.60 15.81 15.35 0.46 | 212.99 32.50 3.05 2.61 0.44 | 386.4 - 6.1 - 80.7 - 83.0 - 4.4 |
| Note: 2064-109; LPAR with 3 dedicated processors | |||
Table 2. Streaming Workload (TCP protocol)
runid TCP/IP Level | ist0b01 4.3.0 | ist0n10 4.4.0 | Percent Difference |
MB/sec tot_cpu_util tot_cpu_msec/MB emul_msec/MB cp_msec/MB | 72.18 34.70 9.62 5.57 4.05 | 87.90 35.60 8.10 4.23 3.87 | 21.8 2.6 -15.8 -24.1 - 4.4 |
| Note: 2064-109; LPAR with 3 dedicated processors | |||
Table 3. RR Workload (UDP protocol)
runid TCP/IP Level | iud0b02 4.3.0 | iud0n14 4.4.0 | Percent Difference |
trans/sec tot_cpu_util tot_cpu_msec/trans emul_msec/trans cp_msec/trans | 1549.78 33.70 0.43 0.30 0.13 | 1745.09 35.30 0.41 0.28 0.13 | 12.6 4.8 - 4.7 - 6.7 0.0 |
| Note: 2064-109; LPAR with 3 dedicated processors | |||
As seen in the tables above, in all three workloads the amount of CPU used per transaction/MB was reduced. This, in turn, allowed the throughput (trans/MB per sec) to increase. While the focus of the enhancements was in the TCP layer and the major sockets functions, bottlenecks were found in the connect-disconnect code which showed up as limitations in performance runs. As a result this code was updated and the improvements can be seen by the increase in throughput in the CRR workload.
Back to Table of Contents.
TCP/IP Device Layer MP Support
In addition to the TCP/IP performance enhancements described in section TCP/IP Stack Performance Improvements, support was added to TCP/IP 440 to allow individual device drivers to be associated with particular virtual processors. Prior to this release, TCP/IP VM didn't have any virtual MP support and, as a result, any given TCP/IP stack virtual machine could only run on one real processor at a time. With TCP/IP 440, the device-specific processing can be done on virtual processors other than the base processor. This can be used to offload some processing from the base processor, which is used by the remaining stack functions, increasing the rate of work that can be handled by the stack virtual machine before the base processor becomes fully utilized. A new option, CPU, on the DEVICE configuration statement, designates the CPU where the driver for a particular device will be dispatched. If no specification is provided or if the designated CPU is not in the configuration, the base processor, which must be CPU 0, is used.
This section summarizes the results of a performance evaluation comparing TCP/IP 440 with and without the device layer MP support active.
An internal tool was used to drive connect-request-response (CRR) and streaming workloads. The CRR workload had the client connecting, sending 64 bytes to the server, the server responding with 8K and the client then disconnecting. The streaming workload consisted of the client sending 20 bytes to the server and the server responding with 20MB.
The measurements were done on a 2064-109 using 2 LPARs. Each LPAR had 3 dedicated processors, 1GB of central storage and 2GB expanded storage. In the measurement environment each LPAR had an equal number of client and server virtual machines defined. The client(s) from one LPAR communicated with the server(s) on the other LPAR.
Both Gigabit Ethernet (QDIO) and HiperSockets were used for communication between the TCP/IP stacks running on each of the LPARs. For the QDIO measurements both the maximum transmission units (MTU) 1492 and 8992 were used. For HiperSockets 8K, 16K, 32K, and 56K MTU sizes were used. Performance runs were made using 1, 10, 20, and 50 client-server pairs for each workload.
Each scenario for QDIO and HiperSockets was run with CPU 0 specified and then with CPU 1 specified for the device on the TCP/IP DEVICE configuration statement for the TCP/IP stack on each LPAR. A complete set of runs, consisting of 3 trials for each case, was done. CP monitor data was captured for one of the LPARs during the measurement and reduced using VMPRF. In addition, Performance Toolkit for VM data was captured for the same LPAR and used to report information on the CPU utilization for each virtual CPU.
Results:
The following tables show the comparison between results on
TCP/IP 440 with (CPU 1) and without (CPU 0) the device layer
MP support active for a set of the measurements taken.
MB/sec (megabytes
per second) or trans/sec (transactions per second) were supplied
by the workload driver and shows the throughput rate. All other
values are from CP monitor data, derived from CP monitor data,
or from Performance Toolkit for VM data.
Table 1. QDIO - Streaming 1492
Client/Server pairs | 1 | 10 | 20 | 50 |
CPU 0 - runid | qf0sn013 | qf0sn101 | qf0sn201 | qf0sn502 |
MB/sec tot_cpu_msec/MB emul_msec/MB cp_msec/MB tot_cpu_util vcpu0_util vcpu1_util | 61.31 12.77 8.66 4.11 48.97 48.70 0.00 | 74.83 17.08 11.43 5.65 68.97 69.00 0.00 | 77.05 18.92 12.77 6.15 74.62 74.58 0.00 | 77.06 20.71 14.05 6.66 79.52 79.47 0.00 |
CPU 1 - runid | qf1sn013 | qf1sn103 | qf1sn202 | qf1sn502 |
MB/sec tot_cpu_msec/MB emul_msec/MB cp_msec/MB tot_cpu_util vcpu0_util vcpu1_util | 69.32 14.98 10.13 4.85 67.50 NA NA | 77.44 19.21 13.09 6.12 85.90 NA NA | 80.41 20.37 13.92 6.45 92.31 68.95 22.85 | 83.87 21.35 14.70 6.65 98.81 75.87 23.33 |
%diff MB/sec %diff tot_cpu_msec %diff emul_msec %diff cp_msec | 13.06 17.25 16.93 17.93 | 3.49 12.51 14.60 8.28 | 4.36 7.65 8.97 4.92 | 8.84 3.11 4.61 - 0.06 |
| Note: 2064-109; LPAR with 3 dedicated processors | ||||
Table 2. QDIO - Streaming 8992
Client/Server pairs | 1 | 10 | 20 | 50 |
CPU 0 - runid | qf0sj011 | qf0sj102 | qf0sj202 | qf0sj501 |
MB/sec tot_cpu_msec/MB emul_msec/MB cp_msec/MB tot_cpu_util vcpu0_util vcpu1_util | 59.79 10.23 6.37 3.86 36.36 36.04 0.00 | 98.04 12.21 7.53 4.68 66.92 66.78 0.00 | 98.14 12.41 7.61 4.80 68.97 68.74 0.00 | 96.06 12.87 7.90 4.97 70.51 70.56 0.00 |
CPU 1 - runid | qf1sj012 | qf1sj102 | qf1sj202 | qf1sj502 |
MB/sec tot_cpu_msec/MB emul_msec/MB cp_msec/MB tot_cpu_util vcpu0_util vcpu1_util | 67.06 12.98 8.10 4.88 53.59 38.53 15.70 | 105.90 14.59 9.21 5.38 90.26 65.93 24.82 | 108.18 12.87 8.13 4.74 81.90 62.48 19.88 | 106.90 13.69 8.67 5.02 85.78 70.63 20.43 |
%diff MB/sec %diff tot_cpu_msec %diff emul_msec %diff cp_msec | 12.16 26.75 27.07 26.21 | 8.02 19.49 22.31 14.97 | 10.23 3.68 6.75 - 1.19 | 11.28 6.44 9.75 1.16 |
| Note: 2064-109; LPAR with 3 dedicated processors | ||||
Client/Server pairs | 1 | 10 | 20 | 50 |
CPU 0 - runid | qf0cn013 | qf0cn102 | qf0cn203 | qf0cn503 |
trans/sec tot_cpu_msec/trans emul_msec/trans cp_msec/trans tot_cpu_util vcpu0_util vcpu1_util | 148.02 1.71 1.18 0.53 10.00 9.84 0.00 | 443.49 1.67 1.16 0.51 23.33 23.62 0.00 | 535.09 1.70 1.18 0.52 26.94 26.92 0.00 | 706.13 1.82 1.30 0.52 36.15 36.02 0.00 |
CPU 1 - runid | qf1cn013 | qf1cn102 | qf1cn202 | qf1cn502 |
trans/sec tot_cpu_msec/trans emul_msec/trans cp_msec/trans tot_cpu_util vcpu0_util vcpu1_util | 153.33 2.02 1.35 0.67 13.85 9.05 4.48 | 436.44 1.85 1.27 0.58 30.77 22.25 7.73 | 556.68 1.86 1.28 0.58 38.06 28.20 9.22 | 711.28 2.02 1.43 0.59 50.79 38.28 11.27 |
%diff trans/sec %diff tot_cpu_msec %diff emul_msec %diff cp_msec | 3.59 18.37 14.85 26.24 | - 1.59 11.53 9.93 15.16 | 4.03 9.45 8.42 11.79 | 0.73 10.85 9.66 13.80 |
| Note: 2064-109; LPAR with 3 dedicated processors | ||||
Client/Server pairs | 1 | 10 | 20 | 50 |
CPU 0 - runid | qf0cj013 | qf0cj101 | qf0cj201 | qf0cj502 |
trans/sec tot_cpu_msec/trans emul_msec/trans cp_msec/trans tot_cpu_util vcpu0_util vcpu1_util | 146.65 1.27 0.88 0.39 10.00 9.84 0.00 | 453.78 1.70 1.31 0.39 23.33 23.62 0.00 | 522.41 1.86 1.46 0.40 26.94 26.92 0.00 | 716.41 1.68 1.27 0.41 36.15 36.02 0.00 |
CPU 1 - runid | qf1cj012 | qf1cj102 | qf1cj201 | qf1cj501 |
trans/sec tot_cpu_msec/trans emul_msec/trans cp_msec/trans tot_cpu_util vcpu0_util vcpu1_util | 155.80 1.40 0.94 0.46 10.00 7.09 3.07 | 465.32 1.95 1.50 0.45 49.74 47.16 6.04 | 587.90 2.03 1.57 0.46 64.10 50.56 7.98 | 781.14 1.85 1.37 0.48 64.87 53.02 10.54 |
%diff trans/sec %diff tot_cpu_msec %diff emul_msec %diff cp_msec | 6.24 10.83 7.26 18.90 | 2.54 14.60 14.27 15.70 | 12.54 9.43 7.33 17.19 | 9.04 10.47 7.70 19.13 |
| Note: 2064-109; LPAR with 3 dedicated processors | ||||
Table 5. HiperSocket - Streaming 8K
Client/Server pairs | 1 | 10 | 20 | 50 |
CPU 0 - runid | hf0sj011 | hf0sj103 | hf0sj201 | hf0sj501 |
MB/sec tot_cpu_msec/MB emul_msec/MB cp_msec/MB tot_cpu_util vcpu0_util vcpu1_util | 139.12 7.57 4.51 3.06 73.30 73.45 0.00 | 129.58 10.17 6.16 4.01 78.61 78.48 0.00 | 118.43 10.77 6.54 4.23 75.56 75.40 0.00 | 104.12 11.90 7.38 4.52 72.86 72.66 0.00 |
CPU 1 - runid | hf1sj012 | hf1sj103 | hf1sj201 | hf1sj501 |
MB/sec tot_cpu_msec/MB emul_msec/MB cp_msec/MB tot_cpu_util vcpu0_util vcpu1_util | 163.03 8.56 5.23 3.33 104.44 75.74 28.26 | 160.08 9.65 5.62 4.03 115.13 89.86 25.04 | 138.46 10.77 6.33 4.44 109.49 87.14 21.90 | 127.96 11.67 6.96 4.71 106.15 86.04 20.20 |
%diff MB/sec %diff tot_cpu_msec %diff emul_msec %diff cp_msec | 17.19 13.05 15.96 8.77 | 23.54 -5.04 -8.71 0.60 | 16.91 0.02 -3.19 5.00 | 22.90 -1.88 -5.60 4.17 |
| Note: 2064-109; LPAR with 3 dedicated processors | ||||
Table 6. HiperSocket - Streaming 56K
Client/Server pairs | 1 | 10 | 20 | 50 |
CPU 0 - runid | hf0s5012 | hf0s5102 | hf0s5201 | hf0s5501 |
MB/sec tot_cpu_msec/MB emul_msec/MB cp_msec/MB tot_cpu_util vcpu0_util vcpu1_util | 135.67 7.47 4.40 3.07 68.06 68.02 0.00 | 139.91 8.51 4.93 3.58 75.90 75.88 0.00 | 131.64 8.61 4.99 3.62 73.08 73.08 0.00 | 112.84 8.88 5.21 3.67 66.15 66.08 0.00 |
CPU 1 - runid | hf1s5013 | hf1s5101 | hf1s5203 | hf1s5503 |
MB/sec tot_cpu_msec/MB emul_msec/MB cp_msec/MB tot_cpu_util vcpu0_util vcpu1_util | 168.47 7.90 4.61 3.29 96.67 72.52 23.57 | 160.55 9.21 5.19 4.02 108.61 87.86 20.04 | 144.95 10.03 5.75 4.28 105.00 86.40 18.22 | 130.51 11.27 6.51 4.76 103.08 85.63 17.10 |
%diff MB/sec %diff tot_cpu_msec %diff emul_msec %diff cp_msec | 24.18 5.79 4.81 7.18 | 14.75 8.22 5.33 12.19 | 10.11 16.53 15.28 18.23 | 15.66 26.84 24.84 29.69 |
| Note: 2064-109; LPAR with 3 dedicated processors | ||||
Client/Server pairs | 1 | 10 | 20 | 50 |
CPU 0 - runid | hf0cj013 | hf0cj103 | hf0cj201 | hf0cj501 |
trans/sec tot_cpu_msec/trans emul_msec/trans cp_msec/trans tot_cpu_util vcpu0_util vcpu1_util | 175.93 1.33 0.94 0.39 8.97 8.62 0.00 | 457.63 1.56 1.17 0.39 31.94 31.60 0.00 | 546.08 1.47 1.08 0.39 30.83 30.62 0.00 | 704.48 1.74 1.32 0.42 48.72 44.30 0.00 |
CPU1 - runid | hf1cj012 | hf1cj101 | hf1cj202 | hf1cj501 |
trans/sec tot_cpu_msec/trans emul_msec/trans cp_msec/trans tot_cpu_util vcpu0_util vcpu1_util | 185.14 1.61 1.12 0.49 14.44 10.78 3.26 | 486.05 2.02 1.56 0.46 53.85 47.28 5.74 | 601.41 1.95 1.51 0.44 62.22 53.28 7.26 | 789.53 1.76 1.30 0.46 61.11 47.14 9.96 |
%diff trans/sec %diff tot_cpu_msec %diff emul_msec %diff cp_msec | 5.24 20.61 19.21 23.95 | 6.21 29.76 33.08 19.69 | 10.13 32.81 39.66 13.82 | 12.07 1.50 -1.53 11.08 |
| Note: 2064-109; LPAR with 3 dedicated processors | ||||
Table 8. HiperSocket - CRR 56K
Client/Server pairs | 1 | 10 | 20 | 50 |
CPU 0 - runid | hf0c5013 | hf0c5101 | hf0c5201 | hf0c5502 |
trans/sec tot_cpu_msec/trans emul_msec/trans cp_msec/trans tot_cpu_util vcpu0_util vcpu1_util | 174.87 1.32 0.94 0.38 9.17 8.62 0.00 | 460.10 1.61 1.22 0.39 34.17 32.16 0.00 | 544.76 1.45 1.05 0.40 28.80 28.12 0.00 | 706.31 1.65 1.24 0.41 44.62 43.97 0.00 |
CPU 1 - runid | hf1c5012 | hf1c5101 | hf1c5201 | hf1c5503 |
trans/sec tot_cpu_msec/trans emul_msec/trans cp_msec/trans tot_cpu_util vcpu0_util vcpu1_util | 185.71 1.66 1.18 0.48 15.28 11.38 3.56 | 485.49 1.96 1.52 0.44 52.78 47.88 5.89 | 594.50 2.00 1.54 0.46 62.56 46.60 7.80 | 787.43 1.80 1.33 0.47 63.59 52.46 10.20 |
%diff trans/sec %diff tot_cpu_msec %diff emul_msec %diff cp_msec | 6.20 25.96 24.98 28.40 | 5.52 21.63 24.67 12.14 | 9.13 38.50 47.10 15.81 | 11.49 10.94 7.51 13.74 |
| Note: 2064-109; LPAR with 3 dedicated processors | ||||
In general the costs per MB or transaction are higher due to the overhead for implementing the virtual MP support. However, the throughput, as reported by MB/sec or trans/sec, is greater in almost all cases measured because the stack virtual machine can now use more than one processor. In addition, overall between 10% to 30% of the workload is moved from CPU 0 (base processor) to CPU 1. The workload moved from CPU 0 to CPU 1 represents the device-specific processing which can now be done in parallel with the stack functions which must be done on the base processor. The best case scenario above is seen for Hipersocket - Streaming with an 8K MTU size. In this case the percentage of the workload moved from CPU 0 to CPU 1 ranged from 19% for 50 client-server pairs to 27% for one client-server pair. In addition, the throughput increased over 16% in all cases while the percent increase in CPU consumption ranged from a high of just over 13% with one client-server pair to a decrease of over 5% for 10 client-server pairs.
Back to Table of Contents.
Additional Evaluations
This section includes results from additional z/VM and z/VM platform performance measurement evaluations that have been conducted during the z/VM 4.4.0 time frame.
Back to Table of Contents.
Linux Guest Crypto on z990
This section presents and discusses the results of a number of new measurements that were designed to understand the performance characteristics of the z990 cryptographic support. Included are:
- a processor comparison between the z990 2084-308 and the z900 2064-2C8 with zVM 4.3.0
- a processor comparison between the z990 2084-316 and the z990 2084-308 with zVM 4.3.0
- a comparison between z/VM 4.4.0 and z/VM 4.3.0 on a z990 2084-316
On the IBM z990 systems available as of June 2003, the only cryptographic hardware available at the time of this report was the CP Assist for Cryptographic Function (CPACF) associated with each z990 processor, and optionally up to 12 Peripheral Component Interconnect Cryptographic Accelerator (PCICA) Cards. The IBM complementary metal-oxide semiconductor (CMOS) Cryptographic Coprocessor Feature (CCF) is no longer available and no other secure cryptographic device is available.
The section titled Linux Guest Crypto Support describes the original cryptographic support and the original methodology. Measurements were completed using the Linux OpenSSL Exerciser Performance Workload described in Linux OpenSSL Exerciser. Specific parameters used can be found in the measurement item list or in the various table columns.
Some of the original methodology has changed including system levels, client machines, and connectivity types.
The following list defines the terms and labels used in the tables in this section of the report:
- #Clients/Sys(Path:
The number of clients with the specified system model and
specified connective path to the server.
- Sys:
- XZ7: An IBM S/390 G6 Server Model XZ7.
- 112: An IBM eServer zSeries 900 Model 112.
- 116: An IBM eServer zSeries 900 Model 116.
- Sys:
- CCF Chips: The number of CCF chips available for use during the measurement.
- Cipher RC4 MD5 US: The SSL cipher algorithm used 128-bit RC4 encryption, with MD5 message authentication, and RSA key exchange.
- Client Authentication: Identifies whether client authentication was being used. The SSL server application handshake type is set to CLIENT AUTH and the client's certificate is verified using the local server key and certificate.
- Client Machines: The number of client machines used for the measurement.
- Client Threads: The number of client threads used for the measurement.
- Connections: The number of times the client connects to and disconnects from the server for each iteration of the workload.
- CPACFs: The number of CP Assist for Cryptographic Function (CPACF) facilities available for the measurement.
- Encryption Facility:
The cryptographic facilities used:
- SSL-SL: The SSL data cryptographic operations were done by SSL software routines, regardless of the presence of hardware cryptographic facilities. SSL handshake cryptographic operations were done. The SSL handshake consists of DES encryption or decryption, and PKA Encrypt or Decrypt operations. All the SSL handshake cryptographic operations were done in hardware by one or more PCICA cards.
- Guest Type V=V: A z/VM measurement on a real z900 or z990 system model with LINUX defined as a virtual equal virtual machine.
- Key Size: The length (in bits) of the key used for SSL data cryptographic operations.
- Linux Kernel Level: The Linux kernel level used for the measurement.
- Linux Kernel Mode MP: The Linux kernel is multiple processor mode.
- Linux Kernel Size 31-bit: The Linux kernel used 31-bit addressing.
- Linux System Level: The Linux system level used for the measurement.
- Linux Virt CPUs: The number of virtual processors defined for the Linux virtual machines.
- Linux Virt Mach Size: The storage size defined for the Linux virtual machines.
- No. of Domains per PCICA: The number of PCICA domains that are accessible from the measurement system.
- No. of TCP/IP Virt Machs: The number of z/VM TCP/IP virtual machines defined on the zVM server to handle the communication traffic to the client systems.
- Number of Guests: The number of z/VM virtual machines defined for LINUX server systems.
- OpenSSL Code Level: The OpenSSL code level used for the measurement.
- Packets: The number of packets that are sent between the client and the server for each iteration of the workload.
- PCICA Cards Active: The number of PCICA cards available for use during the measurement.
- Real Connectivity: Specifies the real communication handler between the client machines and the z/VM server machine.
- Receive Bytes: The number of bytes in each packet that is returned from the server to the client.
- Send Bytes: The number of bytes in each packet that is sent from the client to the server.
- Server Model: The system model used for the server.
- Server SID Cache: The size of the SSL server session ID cache.
- Server Threads: The number of server threads defined for the measurement.
- Servers: The number of servers used for the measurement.
- TCP/IP Virt Mach Mode UP: The TCP/IP code is executing in uni-processor mode.
- TCP/IP Virt Mach Size: Storage size defined for the z/VM TCP/IP virtual machines.
- Virtual Connectivity: Specifies the type of virtual connectivity between the z/VM TCP/IP virtual machines and the Linux virtual machines.
- z90Crypt Level: The z90Crypt level used for the measurement.
- z900 2064-2C8: An IBM eServer zSeries 900 Model 2C8 (8-way) system represented by a logical partition with 8 dedicated processors on a 2064-216.
- z990 2084-308: An IBM eServer zSeries 990 Model 308 (8-way) system represented by a logical partition with 8 dedicated processors on a B16.
- z990 2084-316: An IBM eServer zSeries 990 Model 316 (16-way) system represented by a logical partition with 16 dedicated processors on a B16.
Table 1. Common items for measurements in this section
Client Authentication Encryption Facility No. of Domains per PCICA Server SID Cache Cipher Connections Packets Send Bytes Receive Bytes Key Size | No SSL-SL 1 Disabled RC4 MD5 US 1 1 2048 2048 1024 |
Linux System Level Linux Kernel Level OpenSSL Code Level z90Crypt Level | SLES8 2.4.19 0.9.6E 1.1.2 |
Real Connectivity Virtual Connectivity TCP/IP Virt Mach Size TCP/IP Virt Mach Mode | VM TCP/IP vCTC 256M UP |
Guest Type Number of Guests Linux Virt Mach Size Linux Virt CPUs Linux Kernel Mode Linux Kernel Size | V=V 120 128M 1 MP 31-bit |
Comparison between z990 2084-308 and z900 2064-2C8:
Measurements were obtained to compare the performance
of the SSL workload with hardware
encryption between a z990 2084-308 and a z900 2064-2C8.
For these measurements, there were 120 Linux guests
running in an LPAR with 8 dedicated processors. The LPAR was
configured with one domain of 9 or 12 PCICA cards.
The results are
summarized
in Table 2.
Table 2. Benefit of Z990 processor
SERVER MODEL CCF CHIPS CPACFS PCICA CARDS ACTIVE SERVERS SERVER THREADS CLIENT MACHINES CLIENT THREADS NO. OF TCP/IP VIRT MACHS #Clients/Sys(Path #Clients/Sys(Path | Z900 2064-2C8 2 NA 9 360 360 1 360 5 1/XZ7(6 CTC Na | Z990 2084-308 NA 8 12 198 198 2 198 2 1/XZ7(4 CTC 1/112(6 CTC |
Run ID | E2C06BV3 | E3503BV1 |
Avg Spin Lock Rate (v) Spin Time (v) Pct Spin Time (v) | 4969 2.037 1.012 | na na na |
ETR ETR Ratio ITR (R) ITR Ratio (R) Processor Utilization (R) | 2253.08 1.00 2432.60 1.00 92.62 | 4456.91 1.97 4479.30 1.84 99.50 |
Total CPU/Tx (R) Emul CPU/Tx (R) CP CPU/Tx (R) | 3.28 2.19 1.49 | 1.78 1.22 0.56 |
| Note: Workload: Linux OpenSSL Exerciser; z/VM 4.3.0 SLU 0000; LPAR with 8 dedicated processors; (R) = RTM | ||
ITR improved when moving from the 2064-2C8 to the 2084-308 because of the increased processor speed.
ETR improved more than ITR because the z990 measurement obtained a higher processor utilization. The z900 measurement was limited by the single client configuration.
Comparison between z990 2084-316 and z990 2084-308:
An additional measurement was obtained on a 16-way processor
to see how performance scaled from the 8-way to the 16-way.
The results are
summarized
in Table 3.
Table 3. Z990 16-way versus 8-way
SERVER MODEL Processors (p) CPACFS SERVERS SERVER THREADS CLIENT MACHINES CLIENT THREADS NO. OF TCP/IP VIRT MACHS #Clients/Sys(Path #Clients/Sys(Path #Clients/Sys(Path | Z990 2084-308 8 8 198 198 2 198 2 1/XZ7(4 CTC 1/112(6 CTC na | Z990 2084-316 16 16 297 297 3 297 3 1/XZ7(4 CTC 1/112(6 CTC 1/116(6 CTC |
Run ID | E3503BV1 | E3503BV2 |
Avg Spin Lock Rate (v) Spin Time (v) Pct Spin Time (v) | na na na | 13174 24.989 32.92 |
ETR ETR Ratio ITR (R) ITR Ratio (R) Processor Utilization (R) | 4456.91 1.00 4479.30 1.00 99.50 | 4426.48 0.99 4719.06 1.05 93.80 |
Total CPU/Tx (p) Emul CPU/Tx (p) CP CPU/Tx (p) | 1.784 1.224 0.560 | 3.391 0.961 2.430 |
| Note: Workload: Linux OpenSSL Exerciser; z/VM 4.3.0 SLU 0000; LPAR with 8 or 16 dedicated processors; 12 PCICA Cards; (p) = z/VM FCON/ESA on 4.3.0; (v) = VMPRF; (R) = RTM | ||
With z/VM 4.3.0, the 2084-316 measurement experienced severe spin lock serialization in the z/VM scheduler and did not scale very well compared to the 2084-308 measurement. The 2084-316 measurement provided an ETR of 0.99 times and an ITR of 1.05 times the 2084-308 measurement. The processor utilization was less than 100%. Milliseconds of CP time per transaction increased by 333% between the 8-way and 16-way measurements. The spin lock percentage was 33% compared to about 1% for the 8-way 2064-2C8 measurement shown in Table 2.
Release comparison of z/VM 4.4.0 and z/VM 4.3.0 on z990:
Since
the 16-way measurement on 4.3.0 was affected by the spin lock, it
was repeated on z/VM 4.4.0.
The 16-way results are summarized
in Table 4.
Table 4. Benefit of z/VM 4.4.0
Z/VM SYSTEM LEVEL SERVERS SERVER THREADS CLIENT THREADS | 4.3.0 SLU 0000 297 297 297 | 4.4.0 SLU 0000 360 360 360 |
Run ID | E3503BV2 | E3521BV1 |
Avg Spin Lock Rate (v) Spin Time (v) Pct Spin Time (v) | 13174 24.989 32.92 | 5772 8.984 5.186 |
ETR ETR Ratio ITR (p) ITR Ratio (p) Processor Utilization (p) | 4426.48 1.00 4719.06 1.00 93.80 | 7696.83 1.73 8294.00 1.75 92.80 |
Total CPU/Tx (p) Emul CPU/Tx (p) CP CPU/Tx (p) | 3.391 0.961 2.430 | 1.929 1.083 0.846 |
| Note: Workload: Linux OpenSSL Exerciser; z990 2084-316; LPAR with 16 dedicated processors; 12 PCICA Cards; 3 TCP/IP Virt Machs; 3 Client Machines connected by CTCs ( 1/XZ7(4 CTC, 1/112(6 CTC, 1/116(6 CTC); (p) = z/VM Perfkit on 4.4.0 and z/VM FCON/ESA on 4.3.0; (v) = VMPRF | ||
On the 2084-316, z/VM 4.4.0 provided a 73% ETR improvement and a 75% ITR improvement over z/VM 4.3.0. This spin lock improvement is discussed in the section titled Scheduler Lock Improvement. The spin lock percentage was 5% compared to about 33% for the 4.3.0 measurement. Milliseconds of CP time per transaction decreased by 65% from the 4.3.0 measurements.
Despite this large improvement, the z/VM 4.4.0 guest measurement was also limited by z/VM spin lock serialization and processor utilization was less than 100%.
Back to Table of Contents.
z/VM Version 4 Release 3.0
This section summarizes the performance characteristics of z/VM 4.3.0 and the results of the z/VM 4.3.0 performance evaluation.
Back to Table of Contents.
Summary of Key Findings
This section summarizes the performance evaluation of z/VM 4.3.0. For further information on any given topic, refer to the page indicated in parentheses.
z/VM 4.3.0 includes a number of performance enhancements, performance considerations, and changes that affect VM performance management (see Changes That Affect Performance):
- Performance Improvements
- Enhanced Timer Management
- Improved Utilization of Large Real Storage
- Improved Linux Guest QDIO Performance
- TCP/IP Stack Improvements
- Performance Considerations
- Guest FCP I/O Performance Data
- Performance Management Changes
- Monitor Enhancements
- CP I/O Priority Queueing
- Virtual Machine Resource Manager
- Effects on Accounting Data
- VM Performance Products
Regression measurements for the CMS environment (CMS1 workload) and the VSE guest environment (DYNAPACE workload) indicate that the performance of z/VM 4.3.0 is equivalent to z/VM 4.2.0.
CPU usage of the TCP/IP VM stack virtual machine has been reduced significantly, especially when it serves as a router. For that case, CPU time reductions ranging from 24% to 66% have been observed (see TCP/IP Stack Performance Improvements).
The CP Timer Management Facility now uses the scheduler lock for multiprocessor serialization instead of the master processor. This change reduces master processor constraints, particularly on systems that produce large volumes of CP timer requests. This can be the case, for example, when there are large numbers of Linux guests (see Enhanced Timer Management).
VM Guest LAN was introduced in z/VM 4.2.0 and simulated the HiperSockets connectivity. With z/VM 4.3.0, VM Guest LAN has been extended to also simulate QDIO. Measurement results indicate that this support offers performance that is similar to previously available connectivities (real QDIO (Gigabit Ethernet), VM Guest LAN HiperSockets simulation, and HiperSockets) (see VM Guest LAN: QDIO Simulation).
z/VM supports the IBM PCICA (PCI Cryptographic Accelerator) and the IBM PCICC (PCI Cryptographic Coprocessor) for Linux guest virtual machines. This support, first provided on z/VM 4.2.0 with APAR VM62905, has been integrated into z/VM 4.3.0. The measured SSL environment showed a 7.5-fold throughput improvement relative to using software encryption/decryption (see Linux Guest Crypto Support).
CP storage management has been modified to more effectively use real storage above the 2G line in environments where there is little or no expanded storage. Measurement results for an example applicable environment show a substantial throughput improvement (see Improved Utilization of Large Real Storage).
With z/VM 4.3.0, you can now collect accounting data that quantifies bytes transferred to/from each virtual machine across virtualized network devices (VM guest LAN, virtual CTC, IUCV, and APPC). Measurement results indicate that the collection of this accounting data does not appreciably affect performance (see Accounting for Virtualized Network Devices).
CMS minidisk commit processing has been improved. The number of DASD I/Os done by CMS minidisk commit processing for very large minidisks has been reduced by up to 95%. This improvement has little or no effect on the performance of minidisks having less than 1000 cylinders (see Large Volume CMS Minidisks).
Back to Table of Contents.
Changes That Affect Performance
This chapter contains descriptions of various changes in z/VM 4.3.0 that affect performance. It is divided into three sections -- Performance Improvements, Performance Considerations, and Performance Management. This information is also available on our VM Performance Changes page, along with corresponding information for previous releases.
Back to Table of Contents.
Performance Improvements
The following items improve performance:
- Enhanced Timer Management
- Improved Utilization of Large Real Storage
- Improved Linux Guest QDIO Performance
- Large Volume CMS Minidisks
- TCP/IP Stack Improvements
Enhanced Timer Management
With z/VM 4.3.0, the CP timer management routines no longer use the master processor for multiprocessor serialization but instead use the scheduler lock. This eliminates the master processor as a potential system bottleneck for workloads that generate large numbers of timer requests. An example of such a workload would be large numbers of low-usage Linux guests. See Enhanced Timer Management for further discussion and measurement results.
Improved Utilization of Large Real Storage
CP has been changed in z/VM 4.3.0 to more effectively use real storage above the 2G line in environments where there is little or no expanded storage. In prior releases, modified stolen pages were paged out to expanded storage (if available) or DASD. With z/VM 4.3.0, when expanded storage is unavailable, full, or nearly full and there are frames not being used in storage above the 2G line, page steal copies pages from stolen frames below 2G to these unused frames above 2G. See Improved Utilization of Large Real Storage for measurement results.
Improved Linux Guest QDIO Performance
A combination of enhancements to z/VM, the Linux QDIO driver, and the OSA-Express microcode can increase the performance of Linux guests using Gigabit Ethernet or Fast Ethernet OSA-Express QDIO. Throughput increases up to 40% and CPU usage reductions of up to one half have been observed with these changes. There are no appreciable performance benefits until all 3 changes are in effect. Refer to OSA Express QDIO Performance Enhanced in Consolidated Linux under z/VM Environments for further information.
The VM updates are integrated into z/VM 4.3.0. They are also available via APAR on prior releases (VM62938 for z/VM 4.2.0; VM63036 for all other releases back to VM/ESA 2.4.0).
Large Volume CMS Minidisks
The performance of CMS minidisk file commit has been improved. Formerly, file commit caused all file allocation map blocks to be written out to DASD. With z/VM 4.3.0, just those allocation map blocks that have been modified are written back. This change has little effect on the performance of most minidisks (1000 cylinders or less) but can significantly improve the performance of file commit processing for very large minidisks. See Large Volume CMS Minidisks for measurement results.
TCP/IP Stack Improvements
CPU usage of the TCP/IP VM stack virtual machine has been reduced significantly, especially for the case where it serves as a router. CPU time reductions ranging from 24% to 66% have been observed. See TCP/IP Stack Performance Improvements for measurement results.
Back to Table of Contents.
Performance Considerations
These items warrant consideration since they have potential for a negative impact to performance.
Guest FCP I/O Performance Data
Because FCP devices are not accessed through IBM's channel architecture, any DASD I/O performance data that are obtained through the Subchannel Management Facility will not be available for FCP devices. This includes device utilization, function pending time, disconnect time, connect time, and device service time.
Back to Table of Contents.
Performance Management
These changes affect the performance management of z/VM and TCP/IP VM.
- Monitor Enhancements
- CP I/O Priority Queueing
- Virtual Machine Resource Manager
- Effects on Accounting Data
- VM Performance Products
Monitor Enhancements
There were three major changes to the monitor data for z/VM 4.3.0. The first two changes were to include additional system configuration information and also information on the hardware I/O processors. These changes were specifically made to improve the capability of the monitor. The third change was the addition of data in support of the new I/O Priority Queuing function. As a result of these three changes, there are two new monitor records and several changed records. The detailed monitor record layouts are found on our control blocks page.
When VM runs on LPAR, second level on another VM system, or in a combination of LPAR and second level, it is often valuable to know the configuration of the underlying hypervisor. In z/VM 4.3.0, CP uses the STSI (Store System Information) instruction to gather applicable information about the physical hardware, the LPAR configuration, and the VM first level system. This additional information can be found in Domain 0 Record 15 (Logical CPU Utilization Data) and Domain 0 Record 19 (System Data).
Many of the current IBM zSeries servers have I/O processors that handle various I/O processing tasks. These are sometimes referred to as System Assist Processors. As more function is implemented in these extra processors, there is value in knowing the utilization of the processors. Monitor now collects that information and it can be found in the new Domain 5 Record 8 (I/O Processor Utilization). A zSeries server may have more than one I/O processor. A separate record is created for each I/O processor.
Support was also added in z/VM 4.3.0 to exploit I/O priority queuing. Information was added to monitor on the system settings and user settings. Record Domain 0 Record 8 (User Data) includes some system settings. The user information was added to Domain 4 Record 3 (User Activity Data). Since these settings can be changed by CP commands or the HMC for system level, Domain 2 Record 11 (I/O Priority Changes) was created to track these events.
CP I/O Priority Queueing
I/O management facilities have been added that enable z/VM to exploit the hardware I/O Priority Queueing facility to prioritize guest and host I/O operations. A virtual equivalent of the hardware facility is provided, allowing virtual machines running guest operating systems such as z/OS that exploit I/O Priority Queueing to determine the priority of their I/O operations within bounds defined by a new CP command. z/VM will automatically set a priority for I/O operations initiated by virtual machines that do not exploit this function. The IOPRIORITY directory control statement or the SET IOPRIORITY CP command can be used to set a virtual machine's I/O priority. For more information see z/VM: CP Planning and Adminstration and z/VM: CP Command and Utility Reference.
Virtual Machine Resource Manager
z/VM 4.3.0 introduces a new function, called the Virtual Machine Resource Manager, that can be used to dynamically tune the VM system so that it strives to achieve predetermined performance goals for different workloads (groups of virtual machines) running on the system. For further information, refer to the "VMRM SVM Tuning Parameters" chapter in the z/VM: Performance manual.
Effects on Accounting Data
None of the z/VM 4.3.0 performance changes are expected to have a significant effect on the values reported in the virtual machine resource usage accounting record.
z/VM 4.3.0 introduces a new accounting record (record type C) that quantifies virtual network traffic (bytes sent and received) for each virtual machine. The following virtual networks are supported: VM Guest LAN, virtual CTC, IUCV, and APPC. For further information, see z/VM: CP Planning and Adminstration.
VM Performance Products
This section contains information on the support for z/VM 4.3.0 provided by VMPRF, RTM, FCON/ESA, and VMPAF.
VMPRF support for z/VM 4.3.0 is provided by VMPRF Function Level 4.1.0, which is a preinstalled, priced feature of z/VM 4.3.0. The latest service is recommended, which includes new system configuration, LPAR configuration, and I/O processor reports:
SYSTEM_CONFIG_BY_TIME (PRF118) provides information about the CPU configuration of the monitored VM system. If the VM system being monitored is being run second level (or third level, etc.), the CPU configuration of both the first-level VM system and the monitored VM system are provided.
For VM systems running in an LPAR, LPAR_CONFIG_BY_TIME (PRF119) provides processor configuration information for that LPAR.
IOPROCESSORS_BY_TIME (PRF120) provides processor utilization and I/O activity data for each of the I/O processors in the real processor configuration. Summary (PRF121) and trend (PRF122) records can also be produced for this data.
VMPRF 4.1.0 can also be used to reduce CP monitor data obtained from any supported VM release.
RTM support for z/VM 4.3.0 is provided by Real Time Monitor Function Level 4.1.0. As with VMPRF, RTM is a preinstalled, priced feature of z/VM 4.3.0. The latest service is pre-installed on z/VM 4.3.0 and is required.
To run FCON/ESA on any level of z/VM, FCON/ESA Version 3.2.02 or higher is required. Version 3.2.04 of the program also implements some z/VM 4.3.0 specific new monitor data; this is the recommended minimum level for operation with z/VM 4.3.0. The program runs on z/VM systems in both 31-bit and 64-bit mode and on any previous VM/ESA release.
Performance Analysis Facility/VM 1.1.3 (VMPAF) will run on z/VM 4.3.0 with the same support as z/VM 4.2.0.
Back to Table of Contents.
New Functions
This section contains performance evaluation results for the following new functions:
- Enhanced Timer Management
- VM Guest LAN: QDIO Simulation
- Linux Guest Crypto Support
- Improved Utilization of Large Real Storage
- Accounting for Virtualized Network Devices
- Large Volume CMS Minidisks
- TCP/IP Stack Performance Improvements
Back to Table of Contents.
Enhanced Timer Management
With z/VM 4.3.0, CP timer management scalability has been improved by eliminating master processor serialization and by design changes that reduce large system effects. The performance of CP timer management has been improved for environments where a large number of requests are scheduled, particularly for short intervals, and where timer requests are frequently canceled before they become due. A z/VM system with large numbers of low-usage Linux guest users would be an example of such an environment. Master processor serialization has been eliminated by allowing timer events to be handled on any processor; serialization of timer events is now handled by the scheduler lock component of CP. Also, clock comparator settings are now tracked and managed across all processors to eliminate duplicate or unnecessary timer interruptions.
This section summarizes the results of a performance evaluation done to verify that the master processor bottleneck has been relieved. This is accomplished by comparing master processor utilization against the average processor utilization when handling timer events; master processor utilization should be closely aligned with average processor utilization.
Methodology: All performance measurements were done on a 2064-109 system in an LPAR with 7 dedicated processors. The LPAR was configured with 2GB of central storage and 10GB of expanded storage. 1 RVA DASD behind a 3990-6 controller was used for paging and spool space required to support the test environment.
The software configuration was varied to enable the comparisons desired for this evaluation. A z/VM 4.2.0 64-bit system provided the baseline measurements for the comparison with a z/VM 4.3.0 64-bit system. In addition, 2 variations of the SuSE Linux 2.4.7 31-bit distribution were used - one with the On-Demand Timer Patch applied and one without it.
The On-Demand Timer Patch removes the Linux built-in timer request that occurs every 10 milliseconds to look for work to be done. The timer requests cause the Linux guests to appear consistently busy to z/VM when many of them may actually be idle, requiring CP to perform more processing to handle timer requests. This becomes very costly when there are large numbers of Linux guest users and limits the number of Linux guests that z/VM can manage concurrently. The patch removes the automatic timer request from the Linux kernel source. For idle Linux guests with the timer patch, timer events occur much less often.
An internal tool was used to Initial Program Load (IPL) Linux guest users. The Linux users were allowed to reach a steady idle state (indicated by the absence of paging activity to/from DASD) before taking measurements. Hardware instrumentation and CP Monitor data were collected for each scenario.
Workloads of idle Linux guests were measured to gather data about their consumption of CPU time across processors, with a specific focus on the master processor. A baseline measurement workload of 600 idle Linux guest users was selected. This enabled measurement data to be gathered on a z/VM 4.2.0 system while it was still stable. At 615 Linux guest users without the timer patch on z/VM 4.2.0, the master processor utilization reached 100%, and the system became unstable. A comparison workload of 900 idle Linux guest users was chosen based on the amount of central storage and expanded storage allocated in the hardware configuration. This is the maximum number of users that could be supported without significant paging activity out to DASD.
The following scenarios were attempted. All but #3 were achieved. As discussed above, in attempting that scenario, master processor utilization reached 100% at approximately 615 Linux images.
- z/VM 4.2.0 using SuSE Linux 2.4.7 w/o Timer Patch with load of 600 users
- z/VM 4.3.0 using SuSE Linux 2.4.7 w/o Timer Patch with load of 600 users
- z/VM 4.2.0 using SuSE Linux 2.4.7 w/o Timer Patch with load of 900 users
- z/VM 4.3.0 using SuSE Linux 2.4.7 w/o Timer Patch with load of 900 users
- z/VM 4.2.0 using SuSE Linux 2.4.7 w/ Timer Patch with load of 600 users
- z/VM 4.3.0 using SuSE Linux 2.4.7 w/ Timer Patch with load of 600 users
- z/VM 4.2.0 using SuSE Linux 2.4.7 w/ Timer Patch with load of 900 users
- z/VM 4.3.0 using SuSE Linux 2.4.7 w/ Timer Patch with load of 900 users
Results: Figure 1 shows CPU utilization comparisons between z/VM 4.2.0 and z/VM 4.3.0, comparing the master processor with the average processor utilization across all processors.
Figure 1. Performance Benefits of Enhanced Timer Management
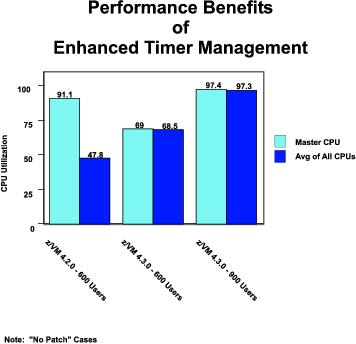 |
These comparisons are all using the SuSE Linux 2.4.7 distribution without the On-Demand Timer Patch applied. The dramatic improvement illustrated here shows that the master processor is no longer a bottleneck for handling timer requests. Prior to z/VM 4.3.0, timer requests were serialized on the master processor; with z/VM 4.3.0, multiprocessor serialization is implemented using the CP scheduler lock. In addition, the 900 user case shows that z/VM 4.3.0 can support significantly more users with this new implementation.
Table 1 and Table 2 show total processor utilization and master processor utilization across the scenarios. The first table shows the comparisons for scenarios where the Linux images did not include the On-Demand Timer Patch. The second table includes scenarios where the Linux images did include the timer patch. With the timer patch, there is a dramatic drop in overall CPU utilization due to the major reduction in Linux guest timer requests to be handled by the system.
Throughput data were not available with this experiment, so the number of Linux guests IPLed for a given scenario was used to normalize the data reductions and calculations for comparison across scenarios.
The tables include data concerning the average number of pages used
by a user and an indication of
the time users were waiting on the scheduler lock.
"Spin Time/Request (v)" from the SYSTEM_SUMMARY2_BY_TIME VMPRF report,
is the average time spent waiting on all CP locks in the system.
For this particular workload, the scheduler lock is the main
contributor.
Table 1. Enhanced Timer Management: No Timer Patch
z/VM Version Linux Users Run ID | 4.2.0 600 2600NP | 4.3.0 600 3600NP1 | 4.3.0 900 3900NP1 |
|---|---|---|---|
Total Util/Proc (v) Emul Util/Proc (v) CP Util/Proc (v) | 47.8 13.3 34.5 | 68.5 13.5 55.0 | 97.3 24.7 72.6 |
Master Total Util/Proc(v) Master Emul Util/Proc (v) Master CP Util/Proc (v) | 91.1 24.6 66.50 | 69.0 13.5 55.50 | 97.4 24.5 72.90 |
Total Util/User Emul Util/User CP Util/User | 0.080 0.021 0.059 | 0.119 0.021 0.097 | 0.110 0.028 0.082 |
Xstor Page Rate (v) DASD Page Rate (v) Spin Lock Rate (v) | 33816 0 58387 | 35131 4 82978 | 75380 2 110271 |
Spin Time/Request (v) Pct Spin Time (v) | 8.697 7.254 | 13.752 16.30 | 13.086 20.61 |
Resident Pages/User (v) Xstor Pages/User (v) DASD Pages/User (v) Total Pages/User (v) | 789 4225 8337 13351 | 788 4224 8404 13416 | 519 2812 9848 13179 |
Ratios |
|
|
|
Total Util/Proc (v) Emul Util/Proc (v) CP Util/Proc (v) | 1.000 1.000 1.000 | 1.433 1.015 1.594 | 2.036 1.857 2.104 |
Master Total Util/Proc(v) Master Emul Util/Proc (v) Master CP Util/Proc (v) | 1.000 1.000 1.000 | 0.757 0.549 0.835 | 1.069 0.996 1.096 |
Total Util/User Emul Util/User CP Util/User | 1.000 1.000 1.000 | 1.488 1.000 1.644 | 1.375 1.333 1.390 |
Xstor Page Rate (v) DASD Page Rate (v) Spin Lock Rate (v) | 1.000 - 1.000 | 1.039 - 1.421 | 2.229 - 1.889 |
Spin Time/Request (v) Pct Spin Time (v) | 1.000 1.000 | 1.581 2.247 | 1.505 2.841 |
Resident Pages/User (v) Xstor Pages/User (v) DASD Pages/User (v) Total Pages/User (v) | 1.000 1.000 1.000 1.000 | 0.999 1.000 1.008 1.005 | 0.658 0.666 1.181 0.987 |
| Note: 2064-109; LPAR with 7 dedicated processors; 2GB central storage; 10GB expanded storage; SuSE Linux 2.4.7 31-bit kernel | |||
Table 2. Enhanced Timer Management: Timer Patch
z/VM Version Linux Users Run ID | 4.2.0 600 2600P | 4.3.0 600 3600P1 | 4.2.0 900 2900P | 4.3.0 900 3900P1 |
|---|---|---|---|---|
Total Util/Proc (v) Emul Util/Proc (v) CP Util/Proc (v) | 4.5 2.0 2.5 | 4.6 2.0 2.6 | 15.5 4.3 11.2 | 13.8 4.0 9.8 |
Master Total Util/Proc(v) Master Emul Util/Proc (v) Master CP Util/Proc (v) | 16.2 7.0 9.20 | 11.1 4.8 6.30 | 30.3 8.3 22.00 | 16.6 4.7 11.90 |
Total Util/User Emul Util/User CP Util/User | 0.007 0.003 0.004 | 0.008 0.003 0.004 | 0.017 0.004 0.013 | 0.015 0.004 0.011 |
Xstor Page Rate (v) DASD Page Rate (v) Spin Lock Rate (v) | 30052 0 74 | 30731 0 76 | 101k 38 1385 | 98322 3 905 |
Spin Time/Request (v) Pct Spin Time (v) | 2.328 0.002 | 2.436 0.003 | 4.463 0.088 | 2.990 0.039 |
Resident Pages/User (v) Xstor Pages/User (v) DASD Pages/User (v) Total Pages/User (v) | 787 4223 8344 13354 | 788 4222 8344 13354 | 522 2820 10573 13915 | 522 2805 9920 13247 |
Ratios |
|
|
|
|
Total Util/Proc (v) Emul Util/Proc (v) CP Util/Proc (v) | 1.000 1.000 1.000 | 1.022 1.000 1.040 | 1.000 1.000 1.000 | 0.890 0.930 0.875 |
Master Total Util/Proc(v) Master Emul Util/Proc (v) Master CP Util/Proc (v) | 1.000 1.000 1.000 | 0.685 0.686 0.685 | 1.000 1.000 1.000 | 0.548 0.566 0.541 |
Total Util/User Emul Util/User CP Util/User | 1.000 1.000 1.000 | 1.143 1.000 1.000 | 1.000 1.000 1.000 | 0.882 1.000 0.846 |
Xstor Page Rate (v) DASD Page Rate (v) Spin Lock Rate (v) | 1.000 - 1.000 | 1.023 - 1.027 | 1.000 1.000 1.000 | 0.974 0.079 0.653 |
Spin Time/Request (v) Pct Spin Time (v) | 1.000 1.000 | 1.046 1.500 | 1.000 1.000 | 0.670 0.443 |
Resident Pages/User (v) Xstor Pages/User (v) DASD Pages/User (v) Total Pages/User (v) | 1.000 1.000 1.000 1.000 | 1.001 1.000 1.000 1.000 | 1.000 1.000 1.000 1.000 | 1.000 0.995 0.938 0.952 |
| Note: 2064-109; LPAR with 7 dedicated processors; 2GB central storage; 10GB expanded storage; SuSE Linux 2.4.7 31-bit kernel | ||||
Summary: z/VM 4.3.0 relieves the master processor bottleneck caused when large numbers of idle Linux guests are run on z/VM. As illustrated in Figure 1, the master processor utilization is far less on z/VM 4.3.0 and matches closely with the average utilization across all processors. As a result, z/VM 4.3.0 is able to support more Linux guests using the same hardware configuration.
While z/VM 4.3.0 provides relief for the master processor, the data for the case of 900 Linux images without the timer patch reflects the next constraint that limits the number of Linux guests that can be managed concurrently - namely, the scheduler lock. The data for this scenario (shown in Table 1) indicate that the wait time for the scheduler lock is increasing as the number of Linux images increases.
The data captured in Table 2 indicate that using the On-Demand Timer Patch with idle Linux workloads yields a large increase in the number of Linux images that z/VM can manage. However, the type of Linux workload should be considered when deciding whether or not to use the timer patch. The maximum benefit of the timer patch is realized for environments with large numbers of low-usage Linux guest users. The timer patch is not recommended for environments with high-usage Linux guests because these guests will do a small amount of additional work every time the switch between user mode and kernel mode occurs.
Footnotes:
- 1
- The breakout of central storage and expanded storage for this evaluation was arbitrary. Similar results are expected with other breakouts.
Back to Table of Contents.
VM Guest LAN: QDIO Simulation
z/VM 4.3.0 now supports the ability to create a simulated QDIO adapter (as was done for HiperSockets in z/VM 4.2.0) using Guest LAN function provided by CP.
This section presents and discusses measurement results that assess the performance of Guest LAN QDIO support by comparing it to real OSA GbE adapters (QDIO), Guest LAN HiperSockets, and real HiperSockets.
Methodology: The workload driver is an internal tool which can be used to simulate such bulk-data transfers as FTP or primitive benchmarks such as streaming or request-response. The data are driven from the application layer of the TCP/IP protocol stack, thus causing the entire networking infrastructure, including the adapter and the TCP/IP protocol code, to be measured. It moves data between client-side memory and server-side memory, eliminating all outside bottlenecks such as DASD or tape.
A client-server pair was used in which the client sent one byte and received 20MB of data (streaming workload); or the client connected to the server, sending 64 bytes to the server, the server responded with 8K and the client then disconnected (connect-request-response workload); or in which the client sent 200 bytes and received 1000 bytes (request-response workload). Additional client-server pairs were added to determine if throughput would vary with an increase of number of connections.
At least 3 measurement trials were taken for each case, and a representative trial was chosen to show in the results. A complete set of runs was done with the maximum transmission unit (MTU) set to 1500 and 8992 for QDIO and Guest LAN QDIO, and 8K and 56K for HiperSockets and Guest LAN HiperSockets.
The measurements were done one a 2064-109 in an LPAR with 2 dedicated processors. The LPAR had 1GB central storage and 2GB expanded storage. CP monitor data was captured during the measurement run and reduced using VMPRF. APAR VM63091, which is on the 4301 Stacked RSU, was applied to pick up performance improvements made for Guest LAN QDIO support.
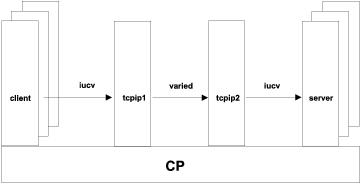 |
Results: MB/sec (megabytes per second) or trans/sec (transactions per second) and response time were supplied by the workload driver. All other values are from CP monitor data or derived from CP monitor data.
Total_cpu_util | This field was obtained from the SYSTEM_SUMMARY_BY_TIME VMPRF report. It shows the average of both processors out of 100%. |
tcpip_tot_cpu_util | This field is calculated from the USER_RESOURCE_UTILIZATION VMPRF report (CPU seconds, total) for the tcpip1 and tcpip2. 100% is the equivalent of one fully utilized processor. |
cpu_msec/MB | This field was calculated from the previous tot_cpu_util divided by the number of megabytes per second to show the number of milliseconds of CPU time per megabyte. |
cpu_msec/trans | This field was calculated from the previous tot_cpu_util divided by the number of transactions per second to show the number of milliseconds of CPU time per transaction. |
The following tables compare Guest LAN QDIO with QDIO, Guest LAN HiperSockets and real HiperSockets for the streaming, CRR, and RR workloads with 10 clients.
Specific details are mentioned for each workload after the tables for
that workload.
Table 1. Throughput - Streaming - 10 clients
runid Connectivity Type MTU | gsn1003 GuestQDIO 1500 | qsn10x3 QDIO 1500 | hs081001 GuestHipr 8K | rs081002 Real Hipr 8K | gsj1001 GuestQDIO 8992 | qsj10x1 QDIO 8992 | hs561002 GuestHipr 56K | rs561002 Real Hipr 56K |
|---|---|---|---|---|---|---|---|---|
MB/sec total_cpu_util | 46.72 74.20 | 47.11 82.30 | 81.69 98.50 | 108.80 98.60 | 83.57 99.30 | 98.14 99.40 | 91.37 74.70 | 116.52 85.90 |
tcpip2_tot_cpu_util tcpip1_tot_cpu_util | 67.88 55.76 | 59.70 60.00 | 86.67 66.06 | 83.33 68.79 | 79.70 75.76 | 77.58 68.18 | 64.85 55.15 | 72.73 62.42 |
cpu_msec/MB emul_msec/MB cp_msec/MB | 31.76 20.33 11.43 | 29.49 18.91 10.58 | 24.12 12.98 11.14 | 18.13 11.64 6.49 | 23.76 12.37 11.39 | 20.26 12.37 7.89 | 16.35 8.21 8.14 | 14.74 8.55 6.20 |
tcpip2_cpu_msec/MB tcpip2_vcpu_msec/MB tcpip2_ccpu_msec/MB tcpip1_cpu_msec/MB tcpip1_vcpu_msec/MB tcpip1_ccpu_msec/MB | 14.53 8.69 5.84 11.93 7.00 4.93 | 12.67 9.20 3.47 12.74 8.43 4.31 | 10.61 3.93 6.68 8.09 4.41 3.67 | 7.66 4.73 2.92 6.32 3.45 2.87 | 9.54 4.39 5.15 9.07 3.41 5.66 | 7.90 4.26 3.64 6.95 3.58 3.37 | 7.10 2.39 4.71 6.04 3.12 2.92 | 6.24 3.35 2.86 5.24 2.61 2.63 |
| Note: 2064-109; z/VM 4.3.0 with 64-bit CP; TCP/IP 430; APAR VM63091 | ||||||||
With MTU size of 1500 QDIO did slightly better than Guest LAN
QDIO in both throughput and efficiency (CPU_msec/MB).
With MTU size of 8K or 8992,
Guest LAN QDIO is similar to Guest HiperSockets,
QDIO and real HiperSockets.
Table 2. Throughput - CRR - 10 clients
runid Connectivity Type MTU | gcn1002 GuestQDIO 1500 | qcn10x3 QDIO 1500 | hc081002 GuestHipr 8K | rc081002 Real Hipr 8K | gcj1003 GuestQDIO 8992 | qcj10x3 QDIO 8992 | hc561002 GuestHipr 56K | rc561002 Real Hipr 56K |
|---|---|---|---|---|---|---|---|---|
trans/sec total_cpu_util | 81.80 55.90 | 85.76 56.10 | 82.91 60.80 | 85.05 60.40 | 85.52 58.30 | 84.30 61.50 | 89.72 59.10 | 88.04 59.00 |
tcpip2_tot_cpu_util tcpip1_tot_cpu_util | 95.33 4.67 | 94.00 4.67 | 88.00 20.67 | 88.00 22.00 | 91.33 15.33 | 90.00 21.33 | 89.33 18.67 | 90.00 18.00 |
cpu_msec/trans emul_msec/trans cp_msec/trans | 13.67 12.91 0.76 | 13.43 12.62 0.81 | 14.67 13.89 0.77 | 14.20 13.62 0.59 | 13.63 13.00 0.63 | 14.59 13.97 0.62 | 13.17 12.57 0.60 | 13.40 12.88 0.52 |
tcpip2_cpu_msec/trans tcpip2_vcpu_msec/trans tcpip2_ccpu_msec/trans tcpip1_cpu_msec/trans tcpip1_vcpu_msec/trans tcpip1_ccpu_msec/trans | 11.65 11.49 0.16 0.57 0.33 0.24 | 10.96 10.81 0.16 0.54 0.31 0.23 | 10.61 10.45 0.16 2.49 2.25 0.24 | 10.35 10.27 0.08 2.59 2.43 0.16 | 10.68 10.52 0.16 1.79 1.56 0.23 | 10.68 10.52 0.16 2.53 2.37 0.16 | 9.96 9.81 0.15 2.08 1.86 0.22 | 10.22 10.07 0.15 2.04 1.89 0.15 |
| Note: 2064-109; z/VM 4.3.0 with 64-bit CP; TCP/IP 430; APAR VM63091 | ||||||||
Again, with MTU size of 1500, QDIO did slightly better than Guest
LAN QDIO. However with similar size MTU (8K or 8992), Guest LAN
QDIO is more efficient, and gets slightly better throughput, than
the other three cases. This is an example of simulation of a device
not costing more than the real device.
Table 3. Throughput - RR - 10 clients
runid Connectivity Type MTU | grn1001 GuestQDIO 1500 | qrn10x1 QDIO 1500 | hr081003 GuestHipr 8K | rr081003 Real Hipr 8K | grj1003 GuestQDIO 8992 | qrj10x3 QDIO 8992 | hr561001 GuestHipr 56K | rr561001 Real Hipr 56K |
|---|---|---|---|---|---|---|---|---|
trans/sec total_cpu_util | 2138.17 98.50 | 2169.16 94.20 | 2188.28 99.00 | 2332.76 99.10 | 2176.10 98.80 | 2021.99 95.00 | 2249.09 98.80 | 2309.78 99.00 |
tcpip2_tot_cpu_util tcpip1_tot_cpu_util | 44.00 43.33 | 36.67 36.67 | 43.33 43.33 | 40.67 40.67 | 44.00 44.00 | 36.00 36.00 | 43.33 43.33 | 41.33 40.67 |
cpu_msec/trans emul_msec/trans cp_msec/trans | 0.92 0.62 0.30 | 0.87 0.62 0.25 | 0.90 0.62 0.29 | 0.85 0.61 0.24 | 0.91 0.61 0.30 | 0.94 0.68 0.26 | 0.88 0.60 0.28 | 0.86 0.62 0.24 |
tcpip2_cpu_msec/trans tcpip2_vcpu_msec/trans tcpip2_ccpu_msec/trans tcpip1_cpu_msec/trans tcpip1_vcpu_msec/trans tcpip1_ccpu_msec/trans | 0.21 0.09 0.12 0.20 0.09 0.11 | 0.17 0.09 0.08 0.17 0.09 0.08 | 0.20 0.09 0.08 0.17 0.09 0.08 | 0.17 0.09 0.08 2.59 2.43 0.16 | 0.20 0.09 0.11 0.20 0.09 0.11 | 0.18 0.09 0.08 0.18 0.09 0.08 | 0.19 0.09 0.10 0.19 0.09 0.10 | 0.18 0.10 0.08 0.18 0.10 0.08 |
| Note: 2064-109; z/VM 4.3.0 with 64-bit CP; TCP/IP 430; APAR VM63091 | ||||||||
Results for an MTU size of 1500 were similar to the previous two workloads. Results for similar MTU (8K or 8992) show Guest LAN QDIO performance that is similar to the other three cases.
The complete results are summarized in the following tables (showing all workloads and all client-server pairs).
A few runs (not shown) were done on a 2064-109 in
an LPAR with 3 dedicated processors
to see what effect another engine would have. The tests were
done with QDIO and real HiperSockets and showed a dramatic improvement
in throughput with 1, 5 and 10 clients and matching throughput for
20 clients. The CPU_msec/MB results were approximately the same
as for the 2-processor runs. This confirmed our suspicion that,
with 2 processors, there were times when one or more of the participating
virtual machines were waiting on
CPU, even though the averages did not show we were using all the CPU
cycles.
Number of clients runid MTU 1500 | 01 qsn01x2
| 05 qsn05x2
| 10 qsn10x3
| 20 qsn20x2
|
|---|---|---|---|---|
MB/sec response time (msec) total_cpu_util | 42.02 475.98 57.90 | 46.74 2142.49 76.20 | 47.11 4262.10 82.30 | 46.09 8694.61 88.70 |
tcpip2_tot_cpu_util tcpip1_tot_cpu_util | 43.94 45.76 | 56.67 56.97 | 59.70 60.00 | 61.52 62.73 |
cpu_msec/MB emul_msec/MB cp_msec/MB | 27.56 20.37 7.19 | 32.61 24.13 8.47 | 34.94 25.73 9.21 | 38.49 28.25 10.24 |
tcpip2_cpu_msec/MB tcpip2_vcpu_msec/MB tcpip2_ccpu_msec/MB tcpip1_cpu_msec/MB tcpip1_vcpu_msec/MB tcpip1_ccpu_msec/MB | 10.46 7.64 2.81 10.89 7.57 3.32 | 12.12 8.88 3.24 12.19 8.30 3.89 | 12.67 9.20 3.47 12.74 8.43 4.31 | 13.35 9.60 3.75 13.61 8.74 4.87 |
runid MTU 8992 | qsj01x1
| qsj05x1
| qsj10x1
| qsj20x1
|
MB/sec response time (msec) total_cpu_util | 95.52 209.38 86.40 | 97.22 1028.50 97.10 | 98.14 2038.36 99.40 | 87.80 4563.48 99.00 |
tcpip2_tot_cpu_util tcpip1_tot_cpu_util | 60.91 63.03 | 70.30 68.18 | 77.58 68.18 | 78.48 65.45 |
cpu_msec/MB emul_msec/MB cp_msec/MB | 18.09 10.99 7.10 | 19.98 12.28 7.69 | 20.26 12.37 7.89 | 22.55 13.90 8.66 |
tcpip2_cpu_msec/MB tcpip2_vcpu_msec/MB tcpip2_ccpu_msec/MB tcpip1_cpu_msec/MB tcpip1_vcpu_msec/MB tcpip1_ccpu_msec/MB | 6.38 3.36 3.01 6.60 3.46 3.14 | 7.23 3.83 3.40 7.01 3.68 3.34 | 7.90 4.26 3.64 6.95 3.58 3.37 | 8.94 4.87 4.07 7.45 3.66 3.80 |
| Note: 2064-109; z/VM 4.3.0 with 64-bit CP; TCP/IP 430; APAR VM63091 | ||||
Number of clients runid MTU 1500 | 01 qcn01x2
| 05 qcn05x2
| 10 qcn10x3
| 20 qcn20x2
|
|---|---|---|---|---|
trans/sec response time (msec) total_cpu_util | 68.84 14.52 51.30 | 80.50 62.11 55.70 | 85.76 116.60 56.10 | 82.21 243.29 56.10 |
tcpip2_tot_cpu_util tcpip1_tot_cpu_util | 87.33 4.67 | 94.00 4.67 | 94.00 4.67 | 93.33 4.67 |
cpu_msec/trans emul_msec/trans cp_msec/trans | 14.90 14.03 0.87 | 13.84 13.09 0.75 | 13.43 12.62 0.81 | 13.65 12.94 0.71 |
tcpip2_cpu_msec/trans tcpip2_vcpu_msec/trans tcpip2_ccpu_msec/trans tcpip1_cpu_msec/trans tcpip1_vcpu_msec/trans tcpip1_ccpu_msec/trans | 12.69 12.49 0.19 0.68 0.39 0.29 | 11.68 11.51 0.17 0.58 0.33 0.25 | 10.96 10.81 0.16 0.54 0.31 0.23 | 11.07 10.91 0.16 0.55 0.32 0.24 |
runid MTU 8992 | qcj01x1
| qcj05x3
| qcj10x3
| qcj20x2
|
trans/sec response time (msec) total_cpu_util | 75.34 13.27 60.50 | 85.05 58.79 60.00 | 84.30 118.62 61.50 | 82.55 242.27 57.40 |
tcpip2_tot_cpu_util tcpip1_tot_cpu_util | 79.17 33.33 | 87.33 21.33 | 90.00 21.33 | 92.67 4.67 |
cpu_msec/trans emul_msec/trans cp_msec/trans | 16.06 15.42 0.64 | 14.11 13.47 0.63 | 14.59 13.97 0.62 | 13.91 13.03 0.87 |
tcpip2_cpu_msec/trans tcpip2_vcpu_msec/trans tcpip2_ccpu_msec/trans tcpip1_cpu_msec/trans tcpip1_vcpu_msec/trans tcpip1_ccpu_msec/trans | 10.51 10.40 0.11 4.42 4.20 0.22 | 10.27 10.03 0.24 2.51 2.35 0.16 | 10.68 10.52 0.16 2.53 2.37 0.16 | 11.23 10.98 0.24 0.57 0.32 0.24 |
| Note: 2064-109; z/VM 4.3.0 with 64-bit CP; TCP/IP 430; APAR VM63091 | ||||
Number of clients runid MTU 1500 | 01 qrn01x3
| 05 qrn05x1
| 10 qrn10x1
| 20 qrn20x3
|
|---|---|---|---|---|
trans/sec response time (msec) total_cpu_util | 1001.73 1.00 47.20 | 2198.87 2.27 96.90 | 2169.16 4.61 94.20 | 1864.28 10.73 79.30 |
tcpip2_tot_cpu_util tcpip1_tot_cpu_util | 21.33 21.33 | 40.00 40.00 | 36.67 36.67 | 28.67 28.00 |
cpu_msec/trans emul_msec/trans cp_msec/trans | 0.94 0.65 0.29 | 0.88 0.63 0.25 | 0.87 0.62 0.25 | 0.85 0.62 0.23 |
tcpip2_cpu_msec/trans tcpip2_vcpu_msec/trans tcpip2_ccpu_msec/trans tcpip1_cpu_msec/trans tcpip1_vcpu_msec/trans tcpip1_ccpu_msec/trans | 0.21 0.12 0.09 0.21 0.12 0.09 | 0.18 0.10 0.08 0.18 0.10 0.08 | 0.17 0.09 0.08 0.17 0.09 0.08 | 0.15 0.08 0.08 0.15 0.08 0.08 |
runid MTU 8992 | qrj01x1
| qrj05x3
| qrj10x3
| qrj20x1
|
trans/sec response time (msec) total_cpu_util | 988.24 1.01 47.60 | 2093.29 2.38 97.00 | 2021.99 4.94 95.00 | 1725.07 11.59 86.90 |
tcpip2_tot_cpu_util tcpip1_tot_cpu_util | 22.00 21.33 | 40.00 39.33 | 36.00 36.00 | 29.33 28.67 |
cpu_msec/trans emul_msec/trans cp_msec/trans | 0.96 0.67 0.30 | 0.93 0.66 0.26 | 0.94 0.68 0.26 | 1.01 0.75 0.26 |
tcpip2_cpu_msec/trans tcpip2_vcpu_msec/trans tcpip2_ccpu_msec/trans tcpip1_cpu_msec/trans tcpip1_vcpu_msec/trans tcpip1_ccpu_msec/trans | 0.22 0.12 0.10 0.22 0.12 0.09 | 0.19 0.10 0.09 0.19 0.10 0.09 | 0.18 0.09 0.08 0.18 0.09 0.08 | 0.17 0.09 0.09 0.17 0.08 0.09 |
| Note: 2064-109; z/VM 4.3.0 with 64-bit CP; TCP/IP 430; APAR VM63091 | ||||
Table 7. Guest LAN QDIO - Streaming
Number of clients runid MTU 1500 | 01 gsn0101
| 05 gsn0503
| 10 gsn1003
| 20 gsn2003
|
|---|---|---|---|---|
MB/sec response time (msec) total_cpu_util | 60.35 331.39 80.10 | 51.41 2130.46 75.80 | 46.72 6748.96 74.20 | 41.09 15390.66 73.10 |
tcpip2_tot_cpu_util tcpip1_tot_cpu_util | 73.64 67.27 | 70.61 58.48 | 67.88 55.76 | 63.03 53.64 |
cpu_msec/MB emul_msec/MB cp_msec/MB | 26.55 16.67 9.88 | 29.49 18.91 10.58 | 31.76 20.33 11.43 | 35.58 22.93 12.66 |
tcpip2_cpu_msec/MB tcpip2_vcpu_msec/MB tcpip2_ccpu_msec/MB tcpip1_cpu_msec/MB tcpip1_vcpu_msec/MB tcpip1_ccpu_msec/MB | 12.20 7.28 4.92 11.15 6.73 4.42 | 13.73 8.25 5.48 11.38 6.84 4.54 | 14.53 8.69 5.84 11.93 7.00 4.93 | 15.34 9.22 6.12 13.05 7.37 5.68 |
runid MTU 8992 | gsj0102
| gsj0502
| gsj1001
| gsj2002
|
MB/sec response time (msec) total_cpu_util | 92.74 215.66 82.90 | 100.02 999.84 98.80 | 83.57 2393.79 99.30 | 72.22 5539.92 98.80 |
tcpip2_tot_cpu_util tcpip1_tot_cpu_util | 67.27 69.39 | 80.91 80.30 | 79.70 75.76 | 79.70 72.42 |
cpu_msec/MB emul_msec/MB cp_msec/MB | 17.88 8.76 9.12 | 19.76 9.84 9.92 | 23.76 12.37 11.39 | 27.36 14.65 12.71 |
tcpip2_cpu_msec/MB tcpip2_vcpu_msec/MB tcpip2_ccpu_msec/MB tcpip1_cpu_msec/MB tcpip1_vcpu_msec/MB tcpip1_ccpu_msec/MB | 7.25 3.23 4.02 7.48 2.88 4.61 | 8.09 3.67 4.42 8.03 3.03 5.00 | 9.54 4.39 5.15 9.07 3.41 5.66 | 11.04 5.37 5.66 10.03 3.69 6.34 |
| Note: 2064-109; z/VM 4.3.0 with 64-bit CP; TCP/IP 430; APAR VM63091 | ||||
Number of clients runid MTU 1500 | 01 gcn0102
| 05 gcn0502
| 10 gcn1002
| 20 gcn2002
|
|---|---|---|---|---|
trans/sec response time (msec) total_cpu_util | 76.08 13.14 55.20 | 83.58 59.82 56.80 | 81.80 122.25 55.90 | 80.35 248.93 56.20 |
tcpip2_tot_cpu_util tcpip1_tot_cpu_util | 79.33 18.67 | 94.00 6.00 | 95.33 4.67 | 94.67 4.67 |
cpu_msec/trans emul_msec/trans cp_msec/trans | 14.51 13.28 1.24 | 13.59 12.66 0.93 | 13.67 12.91 0.76 | 13.99 13.22 0.77 |
tcpip2_cpu_msec/trans tcpip2_vcpu_msec/trans tcpip2_ccpu_msec/trans tcpip1_cpu_msec/trans tcpip1_vcpu_msec/trans tcpip1_ccpu_msec/trans | 10.43 10.08 0.35 2.45 2.02 0.44 | 11.25 11.01 0.24 0.72 0.40 0.32 | 11.65 11.49 0.16 0.57 0.33 0.24 | 11.78 11.62 0.17 0.58 0.33 0.25 |
runid MTU 8992 | gcj0102
| gcj0502
| gcj1003
| gcj2001
|
trans/sec response time (msec) total_cpu_util | 73.91 13.53 62.00 | 87.61 57.07 58.50 | 85.52 116.94 58.30 | 82.13 243.52 58.50 |
tcpip2_tot_cpu_util tcpip1_tot_cpu_util | 73.33 40.00 | 89.33 18.00 | 91.33 15.33 | 92.00 14.67 |
cpu_msec/trans emul_msec/trans cp_msec/trans | 16.78 15.69 1.08 | 13.35 12.72 0.64 | 13.63 13.00 0.63 | 14.25 13.64 0.61 |
tcpip2_cpu_msec/trans tcpip2_vcpu_msec/trans tcpip2_ccpu_msec/trans tcpip1_cpu_msec/trans tcpip1_vcpu_msec/trans tcpip1_ccpu_msec/trans | 9.92 9.56 0.36 5.41 5.05 0.36 | 10.20 9.97 0.23 2.05 1.83 0.23 | 10.68 10.52 0.16 1.79 1.56 0.23 | 11.20 11.04 0.16 1.79 1.62 0.16 |
| Note: 2064-109; z/VM 4.3.0 with 64-bit CP; TCP/IP 430; APAR VM63091 | ||||
Number of clients runid MTU 1500 | 01 grn0101
| 05 grn0502
| 10 grn1001
| 20 grn2003
|
|---|---|---|---|---|
trans/sec response time (msec) total_cpu_util | 1158.25 0.86 52.20 | 2156.14 2.32 99.20 | 2138.17 4.67 98.50 | 1982.01 10.09 91.20 |
tcpip2_tot_cpu_util tcpip1_tot_cpu_util | 28.67 28.67 | 46.67 46.67 | 44.00 43.33 | 34.67 34.67 |
cpu_msec/trans emul_msec/trans cp_msec/trans | 0.90 0.58 0.32 | 0.92 0.61 0.31 | 0.92 0.62 0.30 | 0.92 0.65 0.27 |
tcpip2_cpu_msec/trans tcpip2_vcpu_msec/trans tcpip2_ccpu_msec/trans tcpip1_cpu_msec/trans tcpip1_vcpu_msec/trans tcpip1_ccpu_msec/trans | 0.25 0.12 0.13 0.25 0.12 0.13 | 0.22 0.10 0.12 0.22 0.10 0.12 | 0.21 0.09 0.12 0.20 0.09 0.11 | 0.17 0.08 0.09 0.17 0.08 0.09 |
runid MTU 8992 | grj0101
| grj0501
| grj1003
| grj2001
|
trans/sec response time (msec) total_cpu_util | 1165.89 0.86 52.40 | 2158.08 2.31 99.30 | 2176.10 4.59 98.80 | 2014.65 9.92 89.50 |
tcpip2_tot_cpu_util tcpip1_tot_cpu_util | 29.33 29.33 | 46.67 46.67 | 44.00 44.00 | 34.00 34.00 |
cpu_msec/trans emul_msec/trans cp_msec/trans | 0.90 0.58 0.32 | 0.92 0.61 0.31 | 0.91 0.61 0.30 | 0.89 0.63 0.26 |
tcpip2_cpu_msec/trans tcpip2_vcpu_msec/trans tcpip2_ccpu_msec/trans tcpip1_cpu_msec/trans tcpip1_vcpu_msec/trans tcpip1_ccpu_msec/trans | 0.25 0.12 0.13 0.25 0.12 0.13 | 0.22 0.10 0.12 0.22 0.10 0.12 | 0.20 0.09 0.11 0.20 0.09 0.11 | 0.17 0.08 0.09 0.17 0.08 0.09 |
| Note: 2064-109; z/VM 4.3.0 with 64-bit CP; TCP/IP 430; APAR VM63091 | ||||
Table 10. Guest LAN HiperSockets - Streaming
Number of clients runid MTU 8K | 01 hs080101
| 05 hs080502
| 10 hs081001
| 20 hs082003
|
|---|---|---|---|---|
MB/sec response time (msec) total_cpu_util | 46.31 431.90 52.70 | 87.98 1136.92 98.80 | 81.69 2450.18 98.50 | 76.42 5249.40 97.30 |
tcpip2_tot_cpu_util tcpip1_tot_cpu_util | 46.67 38.79 | 88.48 68.79 | 86.67 66.06 | 84.24 62.73 |
cpu_msec/MB emul_msec/MB cp_msec/MB | 22.76 12.14 10.62 | 22.46 11.87 10.59 | 24.12 12.98 11.14 | 25.46 14.05 11.41 |
tcpip2_cpu_msec/MB tcpip2_vcpu_msec/MB tcpip2_ccpu_msec/MB tcpip1_cpu_msec/MB tcpip1_vcpu_msec/MB tcpip1_ccpu_msec/MB | 10.08 3.86 6.22 8.38 4.71 3.66 | 10.06 3.65 6.41 7.82 4.34 3.48 | 10.61 3.93 6.68 8.09 4.41 3.67 | 11.02 4.24 6.78 8.21 4.40 3.81 |
runid MTU 56K | hs560101
| hs560501
| hs561002
| hs562002
|
MB/sec response time (msec) total_cpu_util | 5.24 3814.20 3.30 | 58.72 1744.83 51.80 | 91.37 2245.39 74.70 | 111.54 3622.69 91.90 |
tcpip2_tot_cpu_util tcpip1_tot_cpu_util | 2.73 2.42 | 45.15 38.79 | 64.85 55.15 | 79.70 67.27 |
cpu_msec/MB emul_msec/MB cp_msec/MB | 12.60 6.49 6.11 | 17.64 8.96 8.69 | 16.35 8.21 8.14 | 16.48 8.34 8.14 |
tcpip2_cpu_msec/MB tcpip2_vcpu_msec/MB tcpip2_ccpu_msec/MB tcpip1_cpu_msec/MB tcpip1_vcpu_msec/MB tcpip1_ccpu_msec/MB | 5.20 1.73 3.47 4.63 2.31 2.31 | 7.69 2.68 5.01 6.61 3.46 3.15 | 7.10 2.39 4.71 6.04 3.12 2.92 | 7.15 2.45 4.70 6.03 3.12 2.91 |
| Note: 2064-109; z/VM 4.3.0 with 64-bit CP; TCP/IP 430; APAR VM63091 | ||||
Table 11. Guest LAN HiperSockets - CRR
Number of clients runid MTU 8K | 01 hc080103
| 05 hc080502
| 10 hc081002
| 20 hc082002
|
|---|---|---|---|---|
trans/sec response time (msec) total_cpu_util | 71.89 13.91 61.90 | 84.92 58.87 58.20 | 82.91 120.61 60.80 | 80.68 247.90 60.70 |
tcpip_2tot_cpu_util tcpip1_tot_cpu_util | 76.00 38.67 | 87.33 18.67 | 88.00 20.67 | 90.00 19.33 |
cpu_msec/trans emul_msec/trans cp_msec/trans | 17.22 16.39 0.83 | 13.71 13.07 0.64 | 14.67 13.89 0.77 | 15.05 14.34 0.69 |
tcpip_2cpu_msec/trans tcpip_2vcpu_msec/trans tcpip_2ccpu_msec/trans tcpip1_cpu_msec/trans tcpip1_vcpu_msec/trans tcpip1_ccpu_msec/trans | 10.57 10.29 0.28 5.38 5.10 0.28 | 10.28 10.13 0.16 2.20 2.04 0.16 | 10.61 10.45 0.16 2.49 2.25 0.24 | 11.16 10.99 0.17 2.40 2.23 0.17 |
runid MTU 56K | hc560101
| hc560502
| hc561002
| hc562003
|
trans/sec response time (msec) total_cpu_util | 77.98 13.03 63.00 | 90.25 55.43 59.10 | 89.72 111.74 59.10 | 87.62 231.83 59.70 |
tcpip_2tot_cpu_util tcpip1_tot_cpu_util | 72.67 44.00 | 86.00 22.00 | 89.33 18.67 | 89.17 20.00 |
cpu_msec/trans emul_msec/trans cp_msec/trans | 16.16 15.36 0.80 | 13.10 12.50 0.60 | 13.17 12.57 0.60 | 13.63 13.06 0.57 |
tcpip_2cpu_msec/trans tcpip_2vcpu_msec/trans tcpip_2ccpu_msec/trans tcpip1_cpu_msec/trans tcpip1_vcpu_msec/trans tcpip1_ccpu_msec/trans | 9.32 9.15 0.17 5.64 5.39 0.26 | 9.53 9.38 0.15 2.44 2.22 0.22 | 9.96 9.81 0.15 2.08 1.86 0.22 | 10.18 10.08 0.10 2.28 2.09 0.19 |
| Note: 2064-109; z/VM 4.3.0 with 64-bit CP; TCP/IP 430; APAR VM63091 | ||||
Table 12. Guest LAN HiperSockets - RR
Number of clients runid MTU 8K | 01 hr080101
| 05 hr080503
| 10 hr081003
| 20 hr082001
|
|---|---|---|---|---|
trans/sec response time (msec) total_cpu_util | 1181.15 0.84 50.40 | 2102.09 2.38 99.40 | 2188.28 4.57 99.00 | 2030.54 9.85 94.20 |
tcpip2_tot_cpu_util tcpip1_tot_cpu_util | 26.67 26.67 | 44.00 43.33 | 43.33 43.33 | 37.33 37.33 |
cpu_msec/trans emul_msec/trans cp_msec/trans | 0.85 0.57 0.28 | 0.95 0.65 0.29 | 0.90 0.62 0.29 | 0.93 0.65 0.28 |
tcpip2_cpu_msec/trans tcpip2_vcpu_msec/trans tcpip2_ccpu_msec/trans tcpip1_cpu_msec/trans tcpip1_vcpu_msec/trans tcpip1_ccpu_msec/trans | 0.23 0.12 0.11 0.23 0.12 0.11 | 0.21 0.10 0.11 0.21 0.10 0.11 | 0.20 0.09 0.11 0.20 0.09 0.11 | 0.18 0.09 0.10 0.18 0.09 0.10 |
runid MTU 56K | hr560102
| hr560501
| hr561001
| hr562001
|
trans/sec response time (msec) total_cpu_util | 1203.37 0.83 50.50 | 2249.50 2.22 99.30 | 2249.09 4.44 98.80 | 2114.04 9.46 91.60 |
tcpip2_tot_cpu_util tcpip1_tot_cpu_util | 27.33 26.67 | 45.33 45.33 | 43.33 43.33 | 36.00 36.00 |
cpu_msec/trans emul_msec/trans cp_msec/trans | 0.84 0.56 0.28 | 0.88 0.60 0.28 | 0.88 0.60 0.28 | 0.87 0.61 0.26 |
tcpip2_cpu_msec/trans tcpip2_vcpu_msec/trans tcpip2_ccpu_msec/trans tcpip1_cpu_msec/trans tcpip1_vcpu_msec/trans tcpip1_ccpu_msec/trans | 0.23 0.12 0.11 0.22 0.12 0.11 | 0.20 0.09 0.11 0.20 0.09 0.11 | 0.19 0.09 0.10 0.19 0.09 0.10 | 0.17 0.08 0.09 0.17 0.08 0.09 |
| Note: 2064-109; z/VM 4.3.0 with 64-bit CP; TCP/IP 430; APAR VM63091 | ||||
Table 13. HiperSockets - Streaming
Number of clients runid MTU 8K | 01 rs080101
| 05 rs080503
| 10 rs081002
| 20 rs082001
|
|---|---|---|---|---|
MB/sec response time (msec) total_cpu_util | 41.45 482.47 34.90 | 105.67 946.89 91.50 | 108.80 1839.06 98.60 | 102.10 3929.42 99.30 |
tcpip2_tot_cpu_util tcpip1_tot_cpu_util | 29.39 25.45 | 77.58 65.45 | 83.33 68.79 | 83.64 66.36 |
cpu_msec/MB emul_msec/MB cp_msec/MB | 16.84 10.62 6.22 | 17.32 11.02 6.30 | 18.13 11.64 6.49 | 19.45 12.67 6.78 |
tcpip2_cpu_msec/MB tcpip2_vcpu_msec/MB tcpip2_ccpu_msec/MB tcpip1_cpu_msec/MB tcpip1_vcpu_msec/MB tcpip1_ccpu_msec/MB | 7.09 4.31 2.78 6.14 3.36 2.78 | 7.34 4.50 2.84 6.19 3.38 2.81 | 7.66 4.73 2.92 6.32 3.45 2.87 | 8.19 5.13 3.06 6.50 3.50 3.00 |
runid MTU 56K | rs560103
| rs560501
| rs561002
| rs562002
|
MB/sec response time (msec) total_cpu_util | 37.52 533.04 26.10 | 88.41 1141.63 64.80 | 116.52 1784.76 85.90 | 131.17 3119.22 96.30 |
tcpip2_tot_cpu_util tcpip1_tot_cpu_util | 22.12 19.39 | 54.85 47.58 | 72.73 62.42 | 81.82 68.79 |
cpu_msec/MB emul_msec/MB cp_msec/MB | 13.91 8.05 5.86 | 14.66 8.46 6.20 | 14.74 8.55 6.20 | 14.68 8.60 6.08 |
tcpip2_cpu_msec/MB tcpip2_vcpu_msec/MB tcpip2_ccpu_msec/MB tcpip1_cpu_msec/MB tcpip1_vcpu_msec/MB tcpip1_ccpu_msec/MB | 5.90 3.15 2.75 5.17 2.67 2.50 | 6.20 3.32 2.88 5.38 2.71 2.67 | 6.24 3.35 2.89 5.36 2.68 2.68 | 6.24 3.37 2.86 5.24 2.61 2.63 |
| Note: 2064-109; z/VM 4.3.0 with 64-bit CP; TCP/IP 430; APAR VM63091 | ||||
Number of clients runid MTU 8K | 01 rc080101
| 05 rc080503
| 10 rc081002
| 20 rc082002
|
|---|---|---|---|---|
trans/sec response time (msec) total_cpu_util | 73.83 13.54 63.20 | 86.57 57.75 58.80 | 85.05 117.58 60.40 | 82.27 243.12 60.10 |
tcpip2_tot_cpu_util tcpip1_tot_cpu_util | 76.67 40.67 | 88.00 20.00 | 88.00 22.00 | 90.00 19.33 |
cpu_msec/trans emul_msec/trans cp_msec/trans | 17.12 16.50 0.62 | 13.58 13.03 0.55 | 14.20 13.62 0.59 | 14.61 14.00 0.61 |
tcpip2_cpu_msec/trans tcpip2_vcpu_msec/trans tcpip2_ccpu_msec/trans tcpip1_cpu_msec/trans tcpip1_vcpu_msec/trans tcpip1_ccpu_msec/trans | 10.38 10.29 0.09 5.51 5.33 0.18 | 10.17 10.01 0.15 2.31 2.16 0.15 | 10.35 10.27 0.08 2.59 2.43 0.16 | 10.94 10.86 0.08 2.35 2.19 0.16 |
runid MTU 56K | rc560102
| rc560502
| rc561002
| rc562003
|
trans/sec response time (msec) total_cpu_util | 74.42 13.43 64.00 | 89.08 56.17 59.10 | 88.04 113.93 59.00 | 85.40 235.91 59.20 |
tcpip2_tot_cpu_util tcpip1_tot_cpu_util | 75.33 42.67 | 87.33 20.67 | 90.00 18.00 | 90.00 18.00 |
cpu_msec/trans emul_msec/trans cp_msec/trans | 17.20 16.47 0.73 | 13.27 12.73 0.54 | 13.40 12.88 0.52 | 13.86 13.30 0.56 |
tcpip2_cpu_msec/trans tcpip2_vcpu_msec/trans tcpip2_ccpu_msec/trans tcpip1_cpu_msec/trans tcpip1_vcpu_msec/trans tcpip1_ccpu_msec/trans | 10.12 9.94 0.18 5.73 5.55 0.18 | 9.80 9.65 0.15 2.32 2.17 0.15 | 10.22 10.07 0.15 2.04 1.89 0.15 | 10.54 10.38 0.16 2.11 1.95 0.16 |
| Note: 2064-109; z/VM 4.3.0 with 64-bit CP; TCP/IP 430; APAR VM63091 | ||||
Number of clients runid MTU 8K | 01 rr080101
| 05 rr080503
| 10 rr081003
| 20 rr082002
|
|---|---|---|---|---|
trans/sec response time (msec) total_cpu_util | 1962.96 0.51 82.20 | 2346.05 2.13 99.40 | 2332.76 4.28 99.10 | 2193.04 9.11 93.70 |
tcpip2_tot_cpu_util tcpip1_tot_cpu_util | 36.67 36.67 | 42.00 42.00 | 40.67 40.67 | 35.33 35.33 |
cpu_msec/trans emul_msec/trans cp_msec/trans | 0.84 0.59 0.24 | 0.85 0.61 0.24 | 0.85 0.61 0.24 | 0.85 0.62 0.23 |
tcpip2_cpu_msec/trans tcpip2_vcpu_msec/trans tcpip2_ccpu_msec/trans tcpip1_cpu_msec/trans tcpip1_vcpu_msec/trans tcpip1_ccpu_msec/trans | 0.19 0.11 0.08 0.19 0.11 0.08 | 0.18 0.10 0.08 0.18 0.10 0.08 | 0.17 0.09 0.08 0.17 0.09 0.08 | 0.16 0.08 0.08 0.16 0.08 0.08 |
runid MTU 56K | rr560102
| rr560501
| rr561001
| rr562001
|
trans/sec response time (msec) total_cpu_util | 1942.90 0.51 82.70 | 2318.29 2.15 99.40 | 2309.78 4.32 99.00 | 2154.46 9.28 92.00 |
tcpip2_tot_cpu_util tcpip1_tot_cpu_util | 38.00 37.33 | 42.67 42.67 | 41.33 40.67 | 34.67 34.00 |
cpu_msec/trans emul_msec/trans cp_msec/trans | 0.85 0.60 0.25 | 0.86 0.61 0.24 | 0.86 0.62 0.24 | 0.85 0.62 0.23 |
tcpip2_cpu_msec/trans tcpip2_vcpu_msec/trans tcpip2_ccpu_msec/trans tcpip1_cpu_msec/trans tcpip1_vcpu_msec/trans tcpip1_ccpu_msec/trans | 0.20 0.11 0.09 0.19 0.11 0.09 | 0.18 0.10 0.08 0.18 0.10 0.08 | 0.18 0.10 0.08 0.18 0.10 0.08 | 0.16 0.08 0.08 0.16 0.08 0.08 |
| Note: 2064-109; z/VM 4.3.0 with 64-bit CP; TCP/IP 430; APAR VM63091 | ||||
Back to Table of Contents.
Linux Guest Crypto Support
z/VM supports the IBM PCICA (PCI Cryptographic Accelerator) and the IBM PCICC (PCI Cryptographic Coprocessor) for Linux guest virtual machines. This support, first provided on z/VM 4.2.0 with APAR VM62905, has been integrated into z/VM 4.3.0. It enables hardware SSL acceleration for Linux on zSeries and S/390 servers, resulting in greatly improved throughput relative to using software encryption/decryption.
The z/VM support allows for an unlimited number of Linux guests to be sharing the same PCI cryptographic facilities. Enqueue and dequeue requests by the Linux guests are intercepted by CP which, in turn, submits real enqueue and dequeue requests to the hardware facilities on their behalf. If, when a virtual enqueue request arrives, all of the PCI queues are in use, CP adds that request to a CP-maintained queue of pending virtual enqueue requests and does the real enqueue request later when a PCI queue becomes available.
This section presents and discusses the results of a number of measurements that were designed to understand and quantify the performance characteristics of this support.
The workload consisted of SSL transactions. Each transaction included a connect request, send 2K of data, receive 2K of data, and a disconnect request. Hardware encryption/decryption was only done for data transferred during the initial SSL handshake that occurs during the connect request. The RC4 MD5 US cipher and 1024 bit keys were used. There was no session ID caching.
The workload was generated using a locally-written tool called the SSL Exerciser, which includes both client and server application code. One server application was started for each client to be used. Each client sent SSL transactions to its assigned server. As soon as each transaction completed, the client started the next one (zero think time). The degree of total system loading was varied by changing the number of these client/server pairs that were started.
Clients were distributed across one or more client systems so as to not overload any of those systems. Unless otherwise specified, these client systems were all RS/6000 workstations running AIX.
Servers were distributed across one or more V=V Linux guest virtual machines running in a z/VM 4.3.0 system. There was one SSL Exerciser server application per Linux guest. The z/VM system was run in a dedicated LPAR of a 2064-116 zSeries processor. This LPAR was configured with one or more PCICA cards, depending on the measurement. Gb Ethernet was used to connect the workstations and the zSeries system.
Unless otherwise stated, Linux 2.4.7 (internal driver 12) and the 11/01/01 level of the z90crypt Linux crypto driver were used.
For any given measurement, the server application was first started in the Linux guest(s). All the clients were then started. After a 5-minute stabilization period, hardware instrumentation and (for most of the measurements) CP monitor data were collected during a 20-minute measurement interval. The CP monitor data were reduced using VMPRF. Throughput results were provided by the client applications.
Comparison to Software Encryption:
Measurements were obtained to compare the performance
of the SSL workload with and without the use of hardware
encryption. For these measurements, there was one Linux guest
running in an LPAR with 4 dedicated processors. The LPAR was
configured with one domain of a PCICA card. The results are
summarized in Table 1.
Table 1. The Benefits of Hardware Encryption
Hardware Encryption? Clients Client Workstations Run ID | no 20 1 E2110BV1 | yes 20 1 E1B08BV1 | yes 180 9 E1C17BV1 |
|---|---|---|---|
Tx/sec | 74.80 | 157.38 | 561.92 |
Total Util/Proc (h) CP Util/Proc (h) Emul Util/Proc (h) Percent CP (h) | 98.31 1.86 96.45 1.9 | 32.21 8.04 24.18 25.0 | 95.89 17.98 77.91 18.8 |
Total CPU/Tx (h) CP CPU/Tx (h) Emul CPU/Tx (h) | 52.570 0.994 51.575 | 8.187 2.042 6.144 | 6.825 1.280 5.546 |
Tx/sec | 1.000 | 2.104 | 7.512 |
Total Util/Proc (h) CP Util/Proc (h) Emul Util/Proc (h) Percent CP (h) | 1.000 1.000 1.000 1.000 | 0.328 4.323 0.251 13.158 | 0.975 9.667 0.808 9.895 |
Total CPU/Tx (h) CP CPU/Tx (h) Emul CPU/Tx (h) | 1.000 1.000 1.000 | 0.156 2.054 0.119 | 0.130 1.288 0.108 |
| Note: 2064-116; 1 PCICA card; LPAR with: 1 PCICA domain, 4 dedicated processors, 2G central storage, no expanded storage; Gb Ethernet; RS/6000 workstations; Workload: SSL exerciser, 2048 bytes each way, 1024 bit keys, RC4 MD5 US cipher, no session id caching; One Linux guest with 4 virtual CPUs; z/VM 4.3.0; Linux 2.4.7 D12; 11/01/01 Linux crypto driver; CPU/Tx is in msec; (h) = hardware instrumentation | |||
Without hardware encryption, throughput was limited by the LPAR's processor capacity, as shown by the very high processor utilization. Most of the processor utilization is in emulation and is primarily due to software encryption/decryption processing in the Linux guest.
When hardware encryption was enabled, this software encryption overhead was eliminated, reducing Total CPU/Tx by 84%. This resulted in a much higher throughput at a much lower processor utilization, allowing the load applied to the system to be increased (by starting more clients). The observed 562 Tx/sec is 7.5 times higher than the 74.8 Tx/sec that could be achieved when software encryption was used.
Percent CP is the percentage of all CPU usage that occurs in CP. It represents processing that would not have occurred had the Linux system been run directly on the LPAR. Percent CP increases in the hardware encryption cases because each crypto request now flows through CP.
The preceding results were for the case of one Linux guest.
Additional measurements were obtained to see how performance is
affected when the applied SSL transaction workload is distributed
across multiple Linux guests. Those results are summarized in Table 2.
Table 2. Horizontal Scaling Study
Linux Guests Virtual CPUs/Guest TCP/IP VM Router? Clients Real Storage Run ID | 1 4 no 180 2G E1C17BV1 | 1 4 yes 180 2G E2128BV2 | 24 1 yes 120 2G E2131BV1 | 118 1 yes 590 6G E2204BV1 |
|---|---|---|---|---|
Tx/sec | 626.86 | 695.55 | 675.55 | 624.87 |
Total Util/Proc (h) CP Util/Proc (h) Emul Util/Proc (h) Percent CP (h) | 95.89 17.98 77.91 18.8 | 99.57 4.12 95.46 4.1 | 99.57 10.05 89.52 10.1 | 96.44 10.55 85.89 10.9 |
Total CPU/Tx (h) | 6.118 | 5.726 | 5.895 | 6.173 |
TCPIP Total CPU/Tx (v) TCPIP Emul CPU/Tx (v) TCPIP CP CPU/Tx (v) | na na na | na na na | 1.004 0.786 0.218 | 1.158 0.958 0.200 |
Linux Total CPU/Tx (v) Linux Emul CPU/Tx (v) Linux CP CPU/Tx (v) Percent Linux CP (v) | 5.865 5.101 0.764 13.0 | na na na na | 4.831 4.537 0.294 6.1 | 4.914 4.570 0.344 7.0 |
Tx/sec (h) | 1.000 | 1.110 | 1.078 | 0.997 |
Total Util/Proc (h) CP Util/Proc (h) Emul Util/Proc (h) Percent CP (h) | 1.000 1.000 1.000 1.000 | 1.038 0.229 1.225 0.218 | 1.038 0.559 1.149 0.537 | 1.006 0.587 1.102 0.580 |
Total CPU/Tx (h) Total CPU/Tx (h) | 1.000 1.068 | 0.936 1.000 | 0.964 1.030 | 1.009 1.078 |
Linux Total CPU/Tx (v) Linux Emul CPU/Tx (v) Linux CP CPU/Tx (v) Percent Linux CP (v) | 1.000 1.000 1.000 1.000 | na na na na | 0.824 0.889 0.385 0.469 | 0.838 0.896 0.450 0.538 |
| Note: 2064-116; 1 PCICA card; LPAR with: 1 PCICA card domain, 4 dedicated processors, 2G central storage, no expanded storage; Gb Ethernet; 9 RS/6000 client workstations; Workload: SSL exerciser, 2048 bytes each way, 1024 bit keys, RC4 MD5 US cipher, no session id caching; z/VM 4.3.0; Linux 2.4.7 D12; 11/01/01 Linux crypto driver; CPU/Tx is in msec; (h) = hardware instrumentation, (v) = VMPRF | ||||
The number of started clients varies for these measurements. In each case, however, the number of clients was more than sufficient to fully load the measured LPAR.
CP monitor records were not collected for run E2128BV2.
It seemed appropriate to make two configuration changes when switching from one to multiple Linux guests. First, we set up a TCP/IP VM stack virtual machine to own the Gb Ethernet adapter and serve as a router for the Linux guests. Virtual channel-to-channel was used to connect the Linux guests to the TCP/IP VM stack. 1 Second, we defined each Linux guest as a virtual uniprocessor because it was no longer necessary to define a virtual 4-way to utilize all four processors and that is a somewhat more efficient way to run Linux. 2
The first two measurements in Table 2 show the transition from Linux communicating directly with the Gb Ethernet adapter to Linux communicating indirectly through the TCP/IP VM router. The 7% drop in Total CPU/Tx is mostly due to the elimination of CP's QDIO shadow queues, which are unnecessary in the TCP/IP VM case because the TCP/IP stack machine fixes the QDIO queue pages in real storage. This improvement more than compensated for the additional processing arising from the more complex router configuration.
Percent Linux CP is the percentage of all CPU time consumed by the Linux guests that is in CP. This CP overhead is partly due to the CP crypto support and partly reflects the normal CP overhead required to support any V=V guest.
The results show that processing efficiency decreases slightly as the workload is distributed across more Linux guests. Relative to 1 Linux guest with TCP/IP VM router (column 2), Total CPU/Tx increased by 3% with 24 Linux guests and by 8% with 118 Linux guests. Analysis of the hardware instrumentation data revealed that most of these increases are in CP and that the increases are not related to the CP crypto support.
Effect of Improved Crypto Driver:
The performance of the Linux crypto driver has recently been improved substantially. The overall effects of this improvement in a multiple Linux guest environment are illustrated in Table 3.
For these measurements, the Linux guests were run in an LPAR with 8 dedicated processors. The LPAR was configured with access to multiple PCICA cards to prevent this resource from limiting throughput. The SSL workload was distributed across multiple TCP/IP VM stack virtual machines to prevent TCP/IP stack utilization from limiting throughput (each TCP/IP VM stack machine can only run on 1 real processor at a time).
For run E2308BV1, all clients were run on a G6 Enterprise Server running z/OS. For run E2415BV1, the clients were distributed across 11 RS/6000 AIX workstations.
RMF data showing PCICA card utilization were also collected for these measurements. This was done from a z/OS system running in a different LPAR.
Table 3. Effect of Improved Crypto Driver
Linux Crypto Driver Linux Guests Linux Gb Ethernet Adapters TCP/IP VM Routers PCICA Cards Domains per PCICA Card Clients Run ID | 11-01-01 118 2.4.7 D12 1 4 2 15 590 E2308BV1 | 03-28-02 116 2.4.17 D22.3 2 6 6 1 548 E2415BV1 |
|
|---|---|---|---|
Tx/sec | 1259.25 | 2409.33 | 1.913 |
Total Util/Proc (h) CP Util/Proc (h) Emul Util/Proc (h) Percent CP (h) | 97.75 14.32 83.43 14.6 | 99.37 30.35 69.02 30.5 | 1.017 2.119 0.827 2.089 |
Avg PCICA Util (rmf) | 57.5 | 37.9 | 0.659 |
Total CPU/Tx (h) CP CPU/Tx (h) Emul CPU/Tx (h) | 5.244 0.768 4.476 | 3.310 1.011 2.299 | 0.631 1.316 0.514 |
Total CPU/Tx (v) | 6.207 | 3.301 | 0.532 |
TCPIP Total CPU/Tx (v) TCPIP Emul CPU/Tx (v) TCPIP CP CPU/Tx (v) | 0.655 0.357 0.298 | 0.750 0.390 0.360 | 1.145 1.092 1.208 |
Linux Total CPU/Tx (v) Linux Emul CPU/Tx (v) Linux CP CPU/Tx (v) Percent Linux CP (v) | 5.441 4.977 0.464 8.5 | 2.449 1.938 0.511 20.9 | 0.450 0.389 1.101 2.459 |
| Note: 2064-116; LPAR with: 8 dedicated processors, 14G central storage, no expanded storage; Gb Ethernet; RS/6000 workstations; Workload: SSL exerciser, 2048 bytes each way, 1024 bit keys, RC4 MD5 US cipher, no session id caching; z/VM 4.3.0; 1 virtual CPU per Linux guest; CPU/Tx is in msec; (h) = hardware instrumentation, (v) = VMPRF | |||
Several aspects of the configuration were changed between these two runs, mostly to accommodate the higher throughput. For example, the number of PCICA cards and the number of TCP/IP stack machines were increased. A more recent level of the Linux kernel was also used for the second measurement.
Although these changes had some effect on the comparison results, nearly all of the observed performance changes are due to the crypto driver improvement, which caused a 61% reduction in Linux Emul CPU/Tx. This allowed throughput achieved by the measured configuration to be increased by 91%.
CP CPU/Tx increased by 32%, partly due to increased CP CPU usage by the TCP/IP stack machines and partly due to increased MP lock contention resulting from the much higher throughput. None of the CP CPU/Tx increases are related to the CP crypto support.
Percent Linux CP increased from 8.5% TO 20.9%. Most of this increase is due to the large decrease in Linux Emul CPU/Tx caused by the Linux crypto driver improvement.
Footnotes:
- 1
- These choices were rather arbitrary. We could have instead, for example, set up another Linux guest to serve as the router and used VM Guest LAN for communication between it and the other Linux guests and that would have worked quite well.
- 2
- The same MP-capable Linux kernal was used. It is possible to generate a Linux kernel that does not include MP locks but we did not try this.
Back to Table of Contents.
Improved Utilization of Large Real Storage
CP's page steal mechanism has been modified in z/VM 4.3.0 to more effectively use real storage above the 2G line 1 in environments where there is little or no expanded storage. The page steal selection algorithm remains the same but what happens to the stolen pages is different. Previously, modified stolen pages were paged out to expanded storage (if available) or DASD. With z/VM 4.3.0, when expanded storage is unavailable, full, or nearly full and there are frames not being used in storage above the 2G line, page steal copies pages from stolen frames below 2G to these unused frames above 2G.
This section presents and discusses a pair of measurements that illustrate the performance effects of this improvement.
The CMS1 workload (see CMS-Intensive (CMS1)), generated by internal TPNS, was used. 10,800 CMS1 users were run on a 2046-1C8 8-way processor that was run in basic mode. It was configured with 8G real storage but no expanded storage. There were 16, 3390-3 volumes (in RVA T82 subsystems) available for paging.
The CP LOCK command was used to fix 896M of an inactive user's virtual storage. This caused 896M worth of page frames residing below the 2G line to become unavailable to the system for other purposes. This could represent, for example, the presence of a large V=R area.
The two measurements were equivalent except for the level of CP used: z/VM 4.2.0 (previous page steal) and z/VM 4.3.0 (revised page steal). TPNS throughput data, hardware instrumentation data, and CP monitor data (reduced by VMPRF) were collected for both measurements.
The measurement results are summarized in Table 1.
Table 1. Real Storage Utilization Improvement
CP Level Run ID | 4.2.0 E12187E0 | 4.3.0 E01307E0 |
|---|---|---|
Tx/sec (t) Total Util/Proc (v) Total CPU/Tx (v) 2G Page Move Rate (m) Avg % Page Vol Busy (v) DASD Pages/Tx (v) | 765.74 65.8 6.874 1105.4 94.8 3.173 | 1069.01 86.9 6.503 2080.3 28.2 0.853 |
Tx/sec (t) Total Util/Proc (v) Total CPU/Tx (v) 2G Page Move Rate (m) Avg % Page Vol Busy (v) DASD Pages/Tx (v) | 1.000 1.000 1.000 1.000 1.000 1.000 | 1.396 1.321 0.946 1.882 0.297 0.269 |
| Note: 2064-1C8; 8G central storage with 896M below the 2G line fixed; no expanded storage; 700M real MDC; (t) = TPNS, (h) = hardware instrumentation, (v) = VMPRF, (m) = CP monitor | ||
The 8G of real storage was chosen to be large enough so that if all of that storage were available, the CMS1 users would have run with very little DASD paging. In addition, all their requirements for page frames below the 2G line would have fit into the available space. However, with 896M of storage below the 2G line made unavailable, there were not enough page frames below the 2G line to meet those requirements. This resulted in a constant movement of pages from above the 2G line to below the 2G line, as shown by "2G Page Move Rate". 2
In the base case, any modified pages that were stolen to make room for these moved pages were paged out to DASD and, if later referenced, had to be read from DASD back into real storage (above or below the 2G line). This DASD paging resulted in a substantial reduction in system throughput by causing the capacity of the page I/O subsystem to be reached. This is shown by the high device utilizations on the DASD page volumes.
With z/VM 4.3.0, these stolen pages were instead moved, when possible, to available page frames above the 2G line, thus eliminating this cause of DASD paging. With the page I/O subsystem no longer a bottleneck, throughput rose to nearly the same level seen for unconstrained measurements. The only remaining DASD paging is normal paging caused by the 896M reduction in total available real storage.
The 5% decrease in Total CPU/Tx was unexpected. Investigation revealed that this was caused by a shift in the distribution of command execution frequency that occurred in the paging-constrained base run and is not an actual benefit of the page steal improvement.
The page steal improvement will not affect performance unless all of the following conditions are present:
- There are unused page frames above the 2G line.
- There are not enough available page frames below the 2G line to satisfy the demand.
- There is no expanded storage available for paging (because none was defined, it is currently full, or page migration is in progress).
The largest benefits will arise in environments characterized by a very high rate of movement of pages from above the 2G line to below the 2G line and a low-capacity paging I/O subsystem, but where total real storage is sufficient to eliminate normal DASD paging.
Footnotes:
- 1
- One of the restrictions of the CP 64-bit support is that most data referenced by CP are required to be below the 2G line. In addition to CP's own code and control blocks, this also includes most data that CP needs to reference in the virtual machine address spaces. This includes I/O buffers, IUCV parameter lists, and the like. When CP needs to reference a page that resides in a real storage frame that is above the 2G line, CP, when necessary, dynamically relocates that page to a frame that is below the 2G line.
- 2
- This field is not externalized by VMPRF so it was extracted directly from the CP monitor data (SYTRSP_PLSMVB2G in domain 0 record 4).
Back to Table of Contents.
Accounting for Virtualized Network Devices
z/VM 4.3.0 installed accounting into IUCV connections, VM guest LAN connections, and virtual CTC connections. The accounting logic accrues bytes moved. For a VM guest LAN, the accrual is separated according to whether the data are flowing to a router virtual machine or a non-router virtual machine, said distinction being drawn using entries in the CP directory.
In this experiment we sought to determine whether the accrual of said accounting information had an impact on the performance of the communication link. We measured link throughput in transactions per second. We measured link resource consumption in CPU time per transaction.
We ran the experiment for only a VM guest LAN in HiperSockets mode. Based on our review of the code involved, we would expect similar performance effect on VM guest LAN in QDIO mode, virtual CTC, and IUCV connections.
We found that collecting accounting data did not significantly affect networking performance.
Hardware
2064-109, LPAR, 2 CPUs dedicated to LPAR, 1 GB real for LPAR, 2 GB XSTORE for LPAR.
Software
z/VM 4.3.0. A 2.4.7-level internal Linux development driver. This was the same Linux used for the z/VM 4.2.0 Linux networking performance experiments. To produce the network loads, we used an IBM internal tool that can induce networking workloads for selected periods of time. The tool is able to record the transaction rates and counts it experiences during the run.
Configuration
Two Linux guests connected to one another via VM guest LAN. The Linux guests were 512 MB virtual uniprocessors, configured with no swap partition. MTU size was 56 KB for all experiments.
Experiment
We ran the following workloads on this configuration, each with accounting turned off and then with accounting turned on: 1
- Request-response, 200/1000, 50 concurrent connections
- Connect-request-response, 64/8192, 50 concurrent connections
- Streaming get, 20/20M, 50 concurrent connections
For each run we collected wall clock duration and CPU consumption. We also collected transaction rate information from the output of the network load inducer.
Results
In these tables we compare the results of our two runs.
Table 1. Transactions Per Second
| Accounting | RR | % change | CRR | % change | STRG | % change |
|---|---|---|---|---|---|---|
| OFF | 15998.35 |
| 3578.88 |
| 8.40 |
|
| ON | 15844.28 | -0.1 | 3532.52 | -1.3 | 8.38 | -0.2 |
| Note: 2064-109, LPAR with 2 dedicated CPUs, 1 GB real, 2 GB XSTORE, LPAR dedicated to these runs. RAMAC-1 behind 3990-6. z/VM 4.3.0. Linux 2.4.7, 31-bit, internal lab driver. 512 MB Linux virtual machine, no swap partition, Linux DASD is DEDICATEd volume. | ||||||
Table 2. CPU Per Transaction (msec)
| Accounting | RR | % change | CRR | % change | STRG | % change |
|---|---|---|---|---|---|---|
| OFF | 0.12 |
| 0.54 |
| 180.91 |
|
| ON | 0.12 | 0.0 | 0.55 | 1.9 | 181.26 | 0.2 |
| Note: 2064-109, LPAR with 2 dedicated CPUs, 1 GB real, 2 GB XSTORE, LPAR dedicated to these runs. RAMAC-1 behind 3990-6. z/VM 4.3.0. Linux 2.4.7, 31-bit, internal lab driver. 512 MB Linux virtual machine, no swap partition, Linux DASD is DEDICATEd volume. | ||||||
Conclusion
This enhancement does not appreciably degrade the performance of VM guest LAN connections in the configurations we measured.
Footnotes:
- 1
- For more description and explanation of these workloads, see the "Linux Networking Performance" section of this report.
Back to Table of Contents.
Large Volume CMS Minidisks
In z/VM 4.3.0 the performance of the CMS file system was enhanced to reduce the amount of DASD I/O performed at file commit time. Previously, the entire file allocation map was rewritten to DASD every time a file was committed. The file allocation map is one of the control files residing on every CMS minidisk. The map contains one bit for every minidisk block indicating the allocation status of the block. In z/VM 4.3.0 the code was changed to write only the modified allocation blocks when the file is committed.
This section presents and discusses measurements that illustrate the performance effects of this improvement.
The CMS file system commands CREATE, COPY, RENAME and ERASE, all of which commit the file at end of command, were used to validate the performance improvement. All four commands were each issued fifty times in both z/VM 4.2.0 and z/VM 4.3.0 on files composed of 10 blocks. The use of 10-block files allowed the scenarios to remain the same for the different size minidisks. The number of DASD I/Os was measured using the number of virtual I/Os displayed by the CP QUERY INDICATE USER (EXP command. The measurements were recorded using different size minidisks formatted with a block size of 4096. Minidisks formatted with a smaller block size will produce similar results.
The measurement results are summarized in Table 1.
Table 1. Large Volume Minidisk DASD I/O Reduction
z/VM Level | 4.2.0 | 4.3.0 |
|---|---|---|
10 Cylinders CREATE COPY RENAME ERASE |
|
|
100 Cylinders CREATE COPY RENAME ERASE |
|
|
1000 Cylinders CREATE COPY RENAME ERASE |
|
|
3338 Cylinders CREATE COPY RENAME ERASE |
|
|
10020 Cylinders CREATE COPY RENAME ERASE |
|
|
32760 Cylinders CREATE COPY RENAME ERASE |
|
|
| Note: For 10-3338 Cylinders, 3390 Mod 3 DASD used. For 10020-32760 Cylinders, Shark Large Volume DASD used. All minidisks were formatted with a block size of 4096. | ||
In the base case, z/VM 4.2.0, the number of virtual I/Os increases as the size of the minidisk increases. Any change to the file allocation map causes the entire map to be rewritten to DASD. This is shown in Table 1 by the increase in the number of virtual I/Os as the size of the minidisk gets larger.
With the new performance enhancement in z/VM 4.3.0, the number of virtual I/Os remains almost constant as the size of the minidisk gets larger. In this case, writing only the modified file allocation blocks has decreased the number of DASD I/Os necessary for the large cylinder minidisks.
As seen in Table 1, the benefits of the CMS Large Volume Minidisk improvement does not impact small minidisks whose file allocation maps are also small. Even in the base case, writing the entire map to DASD involved only minimal DASD I/Os. However, as the number of minidisk cylinders increases, the benefit of the performance improvement can be realized. The largest benefits will be seen when there is a high rate of file activity on very large minidisks.
Back to Table of Contents.
TCP/IP Stack Performance Improvements
VM's TCP/IP stack can act as a router for other VM TCP/IP stacks, or for guests such as Linux. Enhancements were made to TCP/IP 430 to improve performance of the VM TCP/IP stack by optimizing high-use paths, improving algorithms and implementing performance related features. All improvements made were in the device driver layer. The focus of this work was primarily on the performance of the stack when it is acting as a router. However, it was found that the performance was improved not only for the router case but for the stack in general.
Methodology: This section summarizes the results of a performance evaluation comparing TCP/IP 420 with TCP/IP 430 for HiperSockets, Guest LAN (HiperSockets virtualization), QDIO GbE on OSA Express (QDIO), CLAW and virtual CTC. An LCS device was also measured but the results are not shown here since there was virtually no difference between 420 and 430.
Measurements were done using 420 CP with APAR VM62938 applied and TCP/IP 420 with APAR PQ51738 applied (HiperSockets enablement) or 430 CP and TCP/IP 430.
An internal tool was used to drive request-response (RR), connect-request-response (CRR) and streaming (S) workloads. The RR workload consisted of the client sending 200 bytes to the server and the server responding with 1000 bytes. The CRR workload had the client connecting, sending 64 bytes to the server, the server responding with 8K and the client then disconnecting. The streaming workload consisted of the client sending 20 bytes to the server and the server responding with 20MB.
Each workload was run using HiperSockets, Guest LAN (HiperSockets virtualization), QDIO, CLAW and VCTC connectivity with different MTU sizes. For HiperSockets and Guest LAN, 56K and 1500 were chosen for the streaming workloads, 1500 for CRR workloads and for RR workloads. For QDIO, 8992 and 1500 were chosen for streaming workloads, and 1500 for CRR and RR workloads. For CLAW and VCTC, 2000 and 1500 respectively were used for all workloads. All measurements included 1, 5 and 10 client-server pairs.
The measurements were done on a 2064-109 in an LPAR with 2 dedicated processors. The LPAR had 1GB central storage and 2GB expanded storage. CP monitor data were captured during the measurement run and reduced using VMPRF.
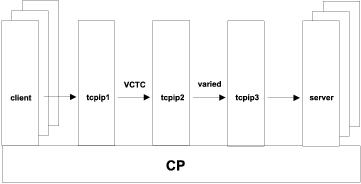 |
The following charts show the comparison between results on TCP/IP 420 and the enhancements on TCP/IP 430. The charts show the ratio between the two releases for router stack (TCPIP2) CPU time, server stack (TCPIP3) CPU time, and throughput. For all these charts, a ratio of 1 signifies equivalence between the two releases. The charts show the ratios for the 10 client case, but the ratios for 1 and 5 clients are similar. Specific details are mentioned, as appropriate, after the charts.
Figure 2. Router Stack CPU Time Ratios - 10 clients
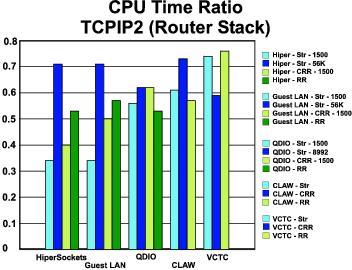 |
The shorter the bar, the larger the gain in efficiency for the router. Larger gains were seen for both HiperSockets and Guest LAN when the MTU size was 1500. With the larger MTU size it makes sense that the benefit would be less since larger packets mean we cross the device driver interface fewer times for the same amount of data. All connectivity types gained for all workloads.
Figure 3. Server Stack CPU Time Ratios - 10 clients
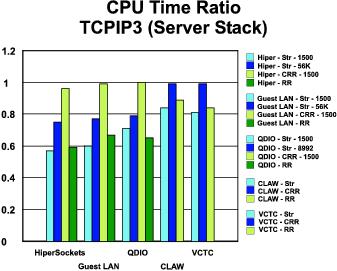 |
The server stack shows the same trend as the router stack by gaining the most with HiperSockets and Guest LAN when the MTU size is 1500. The CRR workload showed the smallest improvement for this stack. The gains, in this case, are not as great because the base costs are higher due to the overhead of managing connect-disconnect.
Figure 4. Throughput Ratios - 10 clients
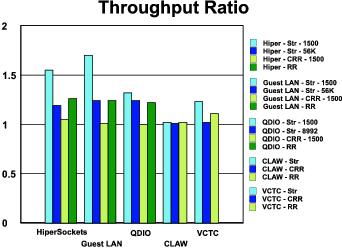 |
For this chart, the taller the bar the better. Both HiperSockets and Guest LAN with MTU size of 1500 showed the greatest increase while CRR again shows a small improvement. By looking at the tables later in this section, we can see that the server stack (tcpip3) is the bottleneck, using more than 90% of one CPU.
Figure 5. CPU msec/MB Streaming with HiperSockets
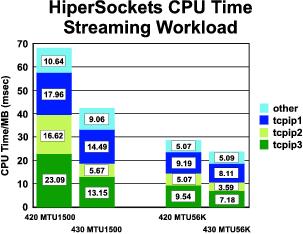 |
This chart, and the next one, show a comparison for CPU usage for the whole system. These are a sample of the data collected. For full data refer to the tables that follow. In these charts the stacks are broken out with the category "other" including the client and server workload tool.
Since one of the drivers targeted for improvement was VCTC, and TCPIP1 communicated with the router stack using VCTC, an improvement is seen for this stack as well.
Figure 6. CPU msec/trans CRR with HiperSockets
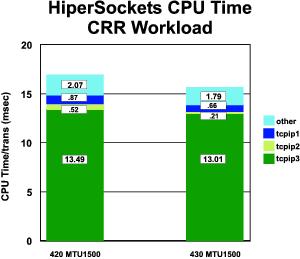 |
This one is interesting as it shows that the Server stack has very high CPU Time as compared to the other stacks and to "other".
Results: The results are summarized in the following tables. MB/sec (megabytes per second) or trans/sec (transactions per second) was supplied by the workload driver and shows the throughput rate. All other values are from CP monitor data or derived from CP monitor data.
Total_cpu_util | This field was obtained from the SYSTEM_SUMMARY_BY_TIME VMPRF report that shows the average of both processors out of 100%. |
tcpip_tot_cpu_util | This field was calculated from the USER_RESOURCE_UTILIZATION VMPRF report (CPU seconds, total). 100% is the equivalent of one fully utilized processor. |
cpu_msec/MB | This field was calculated from the previous tot_cpu_util divided by the number of megabytes per second to show the number of milliseconds of time per megabyte. |
cpu_msec/trans | This field was calculated from the previous tot_cpu_util divided by the number of transactions per second to show the number of milliseconds of time per transaction. |
Table 1. HiperSockets - Streaming 1500
Number of clients runid TCPIP level | 01 420hss12 420 | 01 311hss13 430 | 01
| 05 420hss51 420 | 05 311hss52 430 | 05
| 10 420hssa3 420 | 10 311hssa2 430 | 10
|
|---|---|---|---|---|---|---|---|---|---|
MB/sec total_cpu_util | 25.58 82.10 | 40.48 72.10 | 1.58 0.88 | 26.54 88.80 | 40.41 77.80 | 1.52 0.88 | 24.80 84.70 | 38.47 81.50 | 1.55 0.96 |
tcpip1_tot_cpu_util tcpip2_tot_cpu_util tcpip3_tot_cpu_util | 40.61 48.18 56.97 | 52.12 22.12 48.18 | 1.28 0.46 0.85 | 45.15 47.27 59.70 | 54.55 21.21 50.61 | 1.21 0.45 0.85 | 44.55 41.21 57.27 | 55.76 21.82 50.61 | 1.25 0.53 0.88 |
cpu_msec/MB emul_msec/MB cp_msec/MB | 64.19 49.65 14.54 | 35.62 23.91 11.71 | 0.55 0.48 0.81 | 66.92 51.85 15.07 | 38.51 26.38 12.13 | 0.58 0.51 0.80 | 68.31 52.90 15.40 | 42.37 29.06 13.31 | 0.62 0.55 0.86 |
tcpip1_cpu_msec/MB tcpip1_vcpu_msec/MB tcpip1_ccpu_msec/MB | 15.87 9.60 6.28 | 12.88 7.04 5.84 | 0.81 0.73 0.93 | 17.01 9.93 7.08 | 13.50 7.35 6.15 | 0.79 0.74 0.87 | 17.96 9.90 8.06 | 14.49 7.72 6.77 | 0.81 0.78 0.84 |
tcpip2_cpu_msec/MB tcpip2_vcpu_msec/MB tcpip2_ccpu_msec/MB | 18.84 15.16 3.67 | 5.46 3.67 1.80 | 0.29 0.24 0.49 | 17.81 14.73 3.08 | 5.25 3.67 1.57 | 0.29 0.25 0.51 | 16.62 14.54 2.08 | 5.67 3.78 1.89 | 0.34 0.26 0.91 |
tcpip3_cpu_msec/MB tcpip3_vcpu_msec/MB tcpip3_ccpu_msec/MB | 22.27 19.19 3.08 | 11.90 9.06 2.84 | 0.53 0.47 0.92 | 22.49 19.41 3.08 | 12.52 9.60 2.92 | 0.56 0.49 0.95 | 23.09 19.79 3.30 | 13.15 10.08 3.07 | 0.57 0.51 0.93 |
| Note: 2064-109; LPAR with 2 dedicated processors | |||||||||
Table 2. HiperSockets - Streaming 56K
Number of clients runid TCPIP level | 01 420hsb11 420 | 01 311hsb13 430 | 01
| 05 420hsb52 420 | 05 311hsb52 430 | 05
| 10 420hsba3 420 | 10 311hsba3 430 | 10
|
|---|---|---|---|---|---|---|---|---|---|
MB/sec total_cpu_util | 58.51 84.00 | 63.14 73.60 | 1.08 0.88 | 62.51 88.10 | 72.35 84.30 | 1.16 0.96 | 60.34 87.10 | 71.76 86.00 | 1.19 0.99 |
tcpip1_tot_cpu_util tcpip2_tot_cpu_util tcpip3_tot_cpu_util | 51.21 36.67 51.52 | 49.39 24.55 41.82 | 0.96 0.67 0.81 | 56.36 32.42 57.88 | 57.27 26.36 49.39 | 1.02 0.81 0.85 | 55.45 30.61 57.58 | 58.18 25.76 51.52 | 1.05 0.84 0.89 |
cpu_msec/MB emul_msec/MB cp_msec/MB | 28.71 16.95 11.76 | 23.31 12.23 11.09 | 0.81 0.72 0.94 | 28.19 16.61 11.58 | 23.30 12.30 11.00 | 0.83 0.74 0.95 | 28.87 17.14 11.73 | 23.97 12.85 11.12 | 0.83 0.75 0.95 |
tcpip1_cpu_msec/MB tcpip1_vcpu_msec/MB tcpip1_ccpu_msec/MB | 8.75 2.90 5.85 | 7.82 2.54 5.28 | 0.89 0.88 0.90 | 9.02 2.76 6.25 | 7.92 2.51 5.40 | 0.88 0.91 0.86 | 9.19 2.81 6.38 | 8.11 2.62 5.49 | 0.88 0.93 0.86 |
tcpip2_cpu_msec/MB tcpip2_vcpu_msec/MB tcpip2_ccpu_msec/MB | 6.27 4.40 1.86 | 3.89 2.06 1.82 | 0.62 0.47 0.98 | 5.19 3.98 1.21 | 3.64 2.01 1.63 | 0.70 0.51 1.35 | 5.07 3.97 1.10 | 3.59 2.07 1.52 | 0.71 0.52 1.38 |
tcpip3_cpu_msec/MB tcpip3_vcpu_msec/MB tcpip3_ccpu_msec/MB | 8.80 5.90 2.90 | 6.62 3.79 2.83 | 0.75 0.64 0.98 | 9.26 6.16 3.10 | 6.83 3.94 2.89 | 0.74 0.64 0.93 | 9.54 6.38 3.16 | 7.18 4.22 2.96 | 0.75 0.66 0.94 |
| Note: 2064-109; LPAR with 2 dedicated processors | |||||||||
Table 3. HiperSockets - CRR 1500
Number of clients runid TCPIP level | 01 420hcs12 420 | 01 311hcs13 430 | 01
| 05 420hcs53 420 | 05 311hcs52 430 | 05
| 10 420hcsa1 420 | 10 311hcsa2 430 | 10
|
|---|---|---|---|---|---|---|---|---|---|
trans/sec total_cpu_util | 60.84 57.60 | 63.61 55.90 | 1.05 0.97 | 70.28 59.40 | 75.31 57.30 | 1.07 0.96 | 69.87 59.20 | 73.15 57.30 | 1.05 0.97 |
tcpip1_tot_cpu_util tcpip2_tot_cpu_util tcpip3_tot_cpu_util | 6.67 7.58 89.39 | 5.45 3.33 91.21 | 0.82 0.44 1.02 | 6.36 4.85 94.55 | 4.85 1.82 95.76 | 0.76 0.38 1.01 | 6.06 3.64 94.24 | 4.85 1.52 95.15 | 0.80 0.42 1.01 |
cpu_msec/trans emul_msec/trans cp_msec/trans | 18.93 17.42 1.51 | 17.58 16.13 1.45 | 0.93 0.93 0.96 | 16.90 15.74 1.17 | 15.22 14.23 0.98 | 0.90 0.90 0.84 | 16.95 15.83 1.12 | 15.67 14.71 0.96 | 0.92 0.93 0.86 |
tcpip1_cpu_msec/trans tcpip1_vcpu_msec/trans tcpip1_ccpu_msec/trans | 1.10 0.65 0.45 | 0.86 0.43 0.43 | 0.78 0.66 0.96 | 0.91 0.52 0.39 | 0.64 0.32 0.32 | 0.70 0.62 0.82 | 0.87 0.52 0.35 | 0.66 0.37 0.29 | 0.76 0.71 0.83 |
tcpip2_cpu_msec/trans tcpip2_vcpu_msec/trans tcpip2_ccpu_msec/trans | 1.25 0.95 0.30 | 0.52 0.24 0.29 | 0.42 0.25 0.97 | 0.69 0.52 0.17 | 0.24 0.12 0.12 | 0.35 0.23 0.71 | 0.52 0.43 0.09 | 0.21 0.12 0.08 | 0.40 0.28 0.89 |
tcpip3_cpu_msec/trans tcpip3_vcpu_msec/trans tcpip3_ccpu_msec/trans | 14.69 14.49 0.20 | 14.34 14.15 0.19 | 0.98 0.98 0.95 | 13.45 13.28 0.17 | 12.72 12.55 0.16 | 0.95 0.95 0.94 | 13.49 13.31 0.17 | 13.01 12.84 0.17 | 0.96 0.96 1.00 |
| Note: 2064-109; LPAR with 2 dedicated processors | |||||||||
Table 4. HiperSockets - RR 1500
Number of clients runid TCPIP level | 01 420hrs13 420 | 01 311hrs11 430 | 01
| 05 420hrs51 420 | 05 311hrs52 430 | 05
| 10 420hrsa2 420 | 10 311hrsa2 430 | 10
|
|---|---|---|---|---|---|---|---|---|---|
trans/sec total_cpu_util | 912.16 80.50 | 1234.67 72.40 | 1.35 0.90 | 1426.26 98.10 | 1917.20 99.10 | 1.34 1.01 | 1577.28 96.80 | 1993.94 98.40 | 1.26 1.02 |
tcpip1_tot_cpu_util tcpip2_tot_cpu_util tcpip3_tot_cpu_util | 29.39 39.09 41.21 | 33.33 21.21 25.45 | 1.13 0.54 0.62 | 36.97 38.18 47.58 | 42.73 23.64 35.15 | 1.16 0.62 0.74 | 35.76 30.61 45.15 | 40.61 19.09 34.85 | 1.14 0.62 0.77 |
cpu_msec/trans emul_msec/trans cp_msec/trans | 1.77 1.29 0.47 | 1.17 0.73 0.44 | 0.66 0.57 0.94 | 1.38 1.01 0.36 | 1.03 0.67 0.36 | 0.75 0.66 1.00 | 1.23 0.91 0.32 | 0.99 0.66 0.33 | 0.80 0.73 1.03 |
tcpip1_cpu_msec/trans tcpip1_vcpu_msec/trans tcpip1_ccpu_msec/trans | 0.32 0.16 0.16 | 0.27 0.11 0.16 | 0.84 0.69 1.00 | 0.26 0.13 0.13 | 0.22 0.09 0.13 | 0.85 0.69 1.00 | 0.23 0.11 0.11 | 0.20 0.09 0.12 | 0.87 0.82 1.09 |
tcpip2_cpu_msec/trans tcpip2_vcpu_msec/trans tcpip2_ccpu_msec/trans | 0.43 0.33 0.10 | 0.17 0.08 0.09 | 0.40 0.24 0.90 | 0.27 0.20 0.06 | 0.12 0.06 0.07 | 0.44 0.30 1.17 | 0.19 0.15 0.04 | 0.10 0.05 0.05 | 0.53 0.33 1.25 |
tcpip3_cpu_msec/trans tcpip3_vcpu_msec/trans tcpip3_ccpu_msec/trans | 0.45 0.36 0.10 | 0.21 0.12 0.09 | 0.47 0.33 0.90 | 0.33 0.25 0.08 | 0.18 0.10 0.08 | 0.55 0.40 1.00 | 0.29 0.20 0.08 | 0.17 0.10 0.08 | 0.59 0.50 1.00 |
| Note: 2064-109; LPAR with 2 dedicated processors | |||||||||
Table 5. Guest LAN HIPER - Streaming 1500
Number of clients runid TCPIP level | 01 420gss13 420 | 01 311gss12 430 | 01
| 05 420gss52 420 | 05 311gss53 430 | 05
| 10 420gssa2 420 | 10 311gssa3 430 | 10
|
|---|---|---|---|---|---|---|---|---|---|
MB/sec total_cpu_util | 23.66 83.90 | 39.31 80.30 | 1.66 0.96 | 24.82 93.80 | 44.11 94.60 | 1.78 1.01 | 23.77 93.10 | 40.44 93.70 | 1.70 1.01 |
tcpip2_tot_cpu_util tcpip3_tot_cpu_util | 47.88 65.45 | 26.97 62.42 | 0.56 0.95 | 48.48 71.52 | 28.48 72.73 | 0.59 1.02 | 45.15 69.09 | 26.36 70.00 | 0.58 1.01 |
cpu_msec/MB emul_msec/MB cp_msec/MB | 70.92 49.62 21.30 | 40.85 23.00 17.86 | 0.58 0.46 0.84 | 75.58 53.02 22.56 | 42.89 24.80 18.09 | 0.57 0.47 0.80 | 78.33 55.11 23.22 | 46.34 27.25 19.09 | 0.59 0.49 0.82 |
tcpip2_cpu_msec/MB tcpip2_vcpu_msec/MB tcpip2_ccpu_msec/MB | 20.24 15.63 4.61 | 6.86 4.09 2.78 | 0.34 0.26 0.60 | 19.53 15.26 4.27 | 6.46 3.98 2.47 | 0.33 0.26 0.58 | 19.00 15.30 3.70 | 6.52 4.05 2.47 | 0.34 0.26 0.67 |
tcpip3_cpu_msec/MB tcpip3_vcpu_msec/MB tcpip3_ccpu_msec/MB | 27.66 18.70 8.97 | 15.88 7.86 8.02 | 0.57 0.42 0.89 | 28.81 19.29 9.52 | 16.49 8.38 8.11 | 0.57 0.43 0.85 | 29.07 19.38 9.69 | 17.31 8.84 8.47 | 0.60 0.46 0.87 |
| Note: 2064-109; LPAR with 2 dedicated processors | |||||||||
Table 6. Guest LAN HIPER - Streaming 56K
Number of clients runid TCPIP level | 01 420gsb11 420 | 01 311gsb13 430 | 01
| 05 420gsb52 420 | 05 311gsb51 430 | 05
| 10 420gsba3 420 | 10 311gsba3 430 | 10
|
|---|---|---|---|---|---|---|---|---|---|
MB/sec total_cpu_util | 53.34 84.40 | 54.81 64.70 | 1.03 0.77 | 59.93 88.00 | 70.06 85.00 | 1.17 0.97 | 57.25 87.20 | 71.06 88.10 | 1.24 1.01 |
tcpip2_tot_cpu_util tcpip3_tot_cpu_util | 41.52 52.73 | 24.24 40.00 | 0.58 0.76 | 35.45 58.48 | 29.39 53.33 | 0.83 0.91 | 33.33 58.79 | 29.39 56.06 | 0.88 0.95 |
cpu_msec/MB emul_msec/MB cp_msec/MB | 31.65 17.44 14.21 | 23.61 11.17 12.44 | 0.75 0.64 0.88 | 29.37 15.85 13.52 | 24.26 11.56 12.70 | 0.83 0.73 0.94 | 30.46 16.63 13.83 | 24.80 11.96 12.83 | 0.81 0.72 0.93 |
tcpip2_cpu_msec/MB tcpip2_vcpu_msec/MB tcpip2_ccpu_msec/MB | 7.78 5.17 2.61 | 4.42 2.54 1.88 | 0.57 0.49 0.72 | 5.92 4.60 1.31 | 4.20 2.55 1.64 | 0.71 0.55 1.25 | 5.82 4.61 1.22 | 4.14 2.60 1.54 | 0.71 0.56 1.26 |
tcpip3_cpu_msec/MB tcpip3_vcpu_msec/MB tcpip3_ccpu_msec/MB | 9.89 5.06 4.83 | 7.30 2.71 4.59 | 0.74 0.54 0.95 | 9.76 4.85 4.90 | 7.61 2.90 4.71 | 0.78 0.60 0.96 | 10.27 5.19 5.08 | 7.89 3.07 4.82 | 0.77 0.59 0.95 |
| Note: 2064-109; LPAR with 2 dedicated processors | |||||||||
Table 7. Guest LAN HIPER - CRR 1500
Number of clients runid TCPIP level | 01 420gcs12 420 | 01 311gcs12 430 | 01
| 05 420gcs51 420 | 05 311gcs52 430 | 05
| 10 420gcsa2 420 | 10 311gcsa2 430 | 10
|
|---|---|---|---|---|---|---|---|---|---|
trans/sec total_cpu_util | 63.05 57.20 | 65.99 55.30 | 1.05 0.97 | 69.56 59.20 | 72.12 57.50 | 1.04 0.97 | 70.54 58.20 | 70.99 57.40 | 1.01 0.99 |
tcpip2_tot_cpu_util tcpip3_tot_cpu_util | 9.09 83.03 | 4.24 84.24 | 0.47 1.01 | 5.15 93.94 | 2.42 94.55 | 0.47 1.01 | 3.64 94.55 | 1.82 94.55 | 0.50 1.00 |
cpu_msec/trans emul_msec/trans cp_msec/trans | 18.14 16.37 1.78 | 16.76 15.09 1.67 | 0.92 0.92 0.94 | 17.02 15.73 1.29 | 15.95 14.75 1.19 | 0.94 0.94 0.92 | 16.50 15.37 1.13 | 16.17 15.04 1.13 | 0.98 0.98 1.00 |
tcpip2_cpu_msec/trans tcpip2_vcpu_msec/trans tcpip2_ccpu_msec/trans | 1.44 1.01 0.43 | 0.64 0.28 0.37 | 0.44 0.28 0.86 | 0.74 0.52 0.22 | 0.34 0.13 0.21 | 0.46 0.25 0.95 | 0.52 0.39 0.13 | 0.26 0.13 0.13 | 0.50 0.33 1.00 |
tcpip3_cpu_msec/trans tcpip3_vcpu_msec/trans tcpip3_ccpu_msec/trans | 13.17 12.83 0.34 | 12.77 12.40 0.37 | 0.97 0.97 1.09 | 13.50 13.20 0.30 | 13.11 12.86 0.25 | 0.97 0.97 0.83 | 13.40 13.15 0.26 | 13.32 13.06 0.26 | 0.99 0.99 1.00 |
| Note: 2064-109; LPAR with 2 dedicated processors | |||||||||
Table 8. Guest LAN HIPER - RR 1500
Number of clients runid TCPIP level | 01 420grs11 420 | 01 311grs11 430 | 01
| 05 420grs52 420 | 05 311grs52 430 | 05
| 10 420grsa2 420 | 10 311grsa2 430 | 10
|
|---|---|---|---|---|---|---|---|---|---|
trans/sec total_cpu_util | 677.26 57.50 | 958.57 52.30 | 1.42 0.91 | 1414.92 97.50 | 1866.59 99.00 | 1.32 1.02 | 1547.37 97.00 | 1922.05 98.60 | 1.24 1.02 |
tcpip2_tot_cpu_util tcpip3_tot_cpu_util | 30.61 31.21 | 18.18 21.82 | 0.59 0.70 | 39.39 48.48 | 26.06 38.18 | 0.66 0.79 | 32.73 46.67 | 22.12 37.58 | 0.68 0.81 |
cpu_msec/trans emul_msec/trans cp_msec/trans | 1.70 1.21 0.48 | 1.09 0.65 0.44 | 0.64 0.54 0.92 | 1.38 0.98 0.40 | 1.06 0.66 0.40 | 0.77 0.67 1.00 | 1.25 0.90 0.35 | 1.03 0.66 0.37 | 0.82 0.73 1.06 |
tcpip2_cpu_msec/trans tcpip2_vcpu_msec/trans tcpip2_ccpu_msec/trans | 0.45 0.33 0.13 | 0.19 0.08 0.11 | 0.42 0.24 0.85 | 0.28 0.19 0.08 | 0.14 0.05 0.09 | 0.50 0.26 1.13 | 0.21 0.15 0.06 | 0.12 0.04 0.07 | 0.57 0.27 1.17 |
tcpip3_cpu_msec/trans tcpip3_vcpu_msec/trans tcpip3_ccpu_msec/trans | 0.46 0.34 0.12 | 0.23 0.12 0.11 | 0.50 0.35 0.92 | 0.34 0.23 0.11 | 0.20 0.10 0.11 | 0.59 0.43 1.00 | 0.30 0.20 0.10 | 0.20 0.09 0.10 | 0.67 0.45 1.00 |
| Note: 2064-109; LPAR with 2 dedicated processors | |||||||||
Table 9. QDIO - Streaming 1500
Number of clients runid TCPIP level | 01 420qns12 420 | 01 311qns13 430 | 01
| 05 420qns52 420 | 05 311qns52 430 | 05
| 10 420qnsa2 420 | 10 311qnsa3 430 | 10
|
|---|---|---|---|---|---|---|---|---|---|
MB/sec total_cpu_util | 26.38 70.60 | 34.10 69.50 | 1.29 0.98 | 30.64 85.70 | 40.55 84.90 | 1.32 0.99 | 29.48 87.40 | 39.05 87.90 | 1.32 1.01 |
tcpip2_tot_cpu_util tcpip3_tot_cpu_util | 35.15 43.94 | 26.97 40.61 | 0.77 0.92 | 38.48 52.12 | 28.79 46.97 | 0.75 0.90 | 37.67 52.33 | 27.88 48.48 | 0.74 0.93 |
cpu_msec/MB emul_msec/MB cp_msec/MB | 53.53 38.74 14.78 | 40.76 26.28 14.49 | 0.76 0.68 0.98 | 55.94 40.60 15.34 | 41.87 27.47 14.40 | 0.75 0.68 0.94 | 59.29 43.08 16.21 | 45.02 29.65 15.36 | 0.76 0.69 0.95 |
tcpip2_cpu_msec/MB tcpip2_vcpu_msec/MB tcpip2_ccpu_msec/MB | 13.33 10.11 3.22 | 7.91 4.27 3.64 | 0.59 0.42 1.13 | 12.56 9.89 2.67 | 7.10 3.81 3.29 | 0.57 0.39 1.23 | 12.78 10.06 2.71 | 7.14 3.96 3.18 | 0.56 0.39 1.17 |
tcpip3_cpu_msec/MB tcpip3_vcpu_msec/MB tcpip3_ccpu_msec/MB | 16.66 13.55 3.10 | 11.91 8.71 3.20 | 0.71 0.64 1.03 | 17.01 13.85 3.16 | 11.58 8.59 2.99 | 0.68 0.62 0.95 | 17.75 14.36 3.39 | 12.42 9.16 3.26 | 0.70 0.64 0.96 |
| Note: 2064-109; LPAR with 2 dedicated processors | |||||||||
Table 10. QDIO - Streaming 8992
Number of clients runid TCPIP level | 01 420qjs12 420 | 01 311qjs12 430 | 01
| 05 420qjs53 420 | 05 311qjs51 430 | 05
| 10 420qjsa2 420 | 10 311qjsa1 430 | 10
|
|---|---|---|---|---|---|---|---|---|---|
MB/sec total_cpu_util | 46.53 80.20 | 60.16 81.50 | 1.29 1.02 | 53.15 89.20 | 66.67 88.70 | 1.25 0.99 | 49.99 87.20 | 61.89 87.60 | 1.24 1.00 |
tcpip2_tot_cpu_util tcpip3_tot_cpu_util | 38.18 43.94 | 31.21 40.00 | 0.82 0.91 | 38.18 51.21 | 29.39 47.88 | 0.77 0.93 | 35.15 51.82 | 26.97 50.91 | 0.77 0.98 |
cpu_msec/MB emul_msec/MB cp_msec/MB | 34.47 20.89 13.58 | 27.09 14.30 12.80 | 0.79 0.68 0.94 | 33.57 20.13 13.43 | 26.61 14.25 12.36 | 0.79 0.71 0.92 | 34.89 21.08 13.80 | 28.31 15.54 12.76 | 0.81 0.74 0.92 |
tcpip2_cpu_msec/MB tcpip2_vcpu_msec/MB tcpip2_ccpu_msec/MB | 8.21 5.54 2.67 | 5.19 2.47 2.72 | 0.63 0.45 1.02 | 7.18 5.25 1.94 | 4.41 2.45 1.95 | 0.61 0.47 1.01 | 7.03 5.33 1.70 | 4.36 2.69 1.66 | 0.62 0.50 0.98 |
tcpip3_cpu_msec/MB tcpip3_vcpu_msec/MB tcpip3_ccpu_msec/MB | 9.44 6.45 3.00 | 6.65 3.73 2.92 | 0.70 0.58 0.97 | 9.64 6.33 3.31 | 7.18 4.05 3.14 | 0.74 0.64 0.95 | 10.37 6.61 3.76 | 8.23 4.60 3.62 | 0.79 0.70 0.96 |
| Note: 2064-109; LPAR with 2 dedicated processors | |||||||||
Number of clients runid TCPIP level | 01 420qnc13 420 | 01 311qnc11 430 | 01
| 05 420qnc52 420 | 05 311qnc52 430 | 05
| 10 420qnca2 420 | 10 311qnca3 430 | 10
|
|---|---|---|---|---|---|---|---|---|---|
trans/sec total_cpu_util | 60.72 53.10 | 61.27 52.20 | 1.01 0.98 | 71.26 57.60 | 70.91 57.20 | 1.00 0.99 | 70.69 57.00 | 70.99 56.80 | 1.00 1.00 |
tcpip2_tot_cpu_util tcpip3_tot_cpu_util | 7.27 80.91 | 3.33 84.24 | 0.46 1.04 | 3.94 93.33 | 2.12 94.24 | 0.54 1.01 | 2.42 93.64 | 1.52 93.94 | 0.63 1.00 |
cpu_msec/trans emul_msec/trans cp_msec/trans | 17.49 15.94 1.55 | 17.04 15.54 1.50 | 0.97 0.97 0.97 | 16.17 15.10 1.07 | 16.13 15.03 1.10 | 1.00 1.00 1.03 | 16.13 15.14 0.99 | 16.00 14.99 1.01 | 0.99 0.99 1.02 |
tcpip2_cpu_msec/trans tcpip2_vcpu_msec/trans tcpip2_ccpu_msec/trans | 1.20 0.90 0.30 | 0.54 0.25 0.30 | 0.45 0.28 1.00 | 0.55 0.43 0.13 | 0.30 0.13 0.17 | 0.55 0.30 1.31 | 0.34 0.26 0.09 | 0.21 0.13 0.09 | 0.62 0.50 1.00 |
tcpip3_cpu_msec/trans tcpip3_vcpu_msec/trans tcpip3_ccpu_msec/trans | 13.32 13.08 0.25 | 13.75 13.55 0.20 | 1.03 1.04 0.80 | 13.10 12.88 0.21 | 13.29 13.08 0.21 | 1.01 1.02 1.00 | 13.25 13.03 0.21 | 13.23 13.02 0.21 | 1.00 1.00 1.00 |
| Note: 2064-109; LPAR with 2 dedicated processors | |||||||||
Number of clients runid TCPIP level | 01 420qnr12 420 | 01 311qnr13 430 | 01
| 05 420qnr51 420 | 05 311qnr51 430 | 05
| 10 420qnra2 420 | 10 311qnra2 430 | 10
|
|---|---|---|---|---|---|---|---|---|---|
trans/sec total_cpu_util | 661.69 54.50 | 817.55 48.40 | 1.24 0.89 | 1423.79 95.30 | 1820.44 95.90 | 1.28 1.01 | 1591.39 92.20 | 1944.78 94.90 | 1.22 1.03 |
tcpip2_tot_cpu_util tcpip3_tot_cpu_util | 25.76 27.88 | 14.55 16.97 | 0.56 0.61 | 34.85 45.45 | 20.91 34.55 | 0.60 0.76 | 24.55 40.91 | 16.06 33.64 | 0.65 0.82 |
cpu_msec/trans emul_msec/trans cp_msec/trans | 1.65 1.19 0.46 | 1.18 0.72 0.46 | 0.72 0.61 1.00 | 1.34 0.98 0.36 | 1.05 0.69 0.37 | 0.78 0.70 1.03 | 1.16 0.85 0.31 | 0.98 0.65 0.32 | 0.84 0.76 1.03 |
tcpip2_cpu_msec/trans tcpip2_vcpu_msec/trans tcpip2_ccpu_msec/trans | 0.39 0.29 0.10 | 0.18 0.08 0.10 | 0.46 0.28 1.00 | 0.24 0.18 0.06 | 0.11 0.05 0.06 | 0.46 0.28 1.00 | 0.15 0.12 0.04 | 0.08 0.04 0.04 | 0.53 0.33 1.00 |
tcpip3_cpu_msec/trans tcpip3_vcpu_msec/trans tcpip3_ccpu_msec/trans | 0.42 0.33 0.10 | 0.21 0.12 0.09 | 0.50 0.36 0.90 | 0.32 0.23 0.09 | 0.19 0.10 0.09 | 0.59 0.43 1.00 | 0.26 0.17 0.08 | 0.17 0.09 0.08 | 0.65 0.53 1.00 |
| Note: 2064-109; LPAR with 2 dedicated processors | |||||||||
Table 13. CLAW - Streaming 2000
Number of clients runid TCPIP level | 01 420css13 420 | 01 208css13 430 | 01
| 05 420css52 420 | 05 208css53 430 | 05
| 10 420cssa2 420 | 10 208cssa3 430 | 10
|
|---|---|---|---|---|---|---|---|---|---|
MB/sec total_cpu_util | 2.13 8.90 | 2.17 7.00 | 1.02 0.79 | 2.28 9.90 | 2.34 8.00 | 1.03 0.81 | 2.21 10.80 | 2.26 9.10 | 1.02 0.84 |
tcpip2_tot_cpu_util tcpip3_tot_cpu_util | 4.85 3.33 | 3.03 2.73 | 0.62 0.82 | 4.85 3.64 | 3.03 3.03 | 0.62 0.83 | 4.74 3.86 | 2.98 3.33 | 0.63 0.86 |
cpu_msec/MB emul_msec/MB cp_msec/MB | 83.57 53.52 30.05 | 64.52 38.71 25.81 | 0.77 0.72 0.86 | 86.84 57.02 29.82 | 68.38 41.88 26.50 | 0.79 0.73 0.89 | 97.74 64.25 33.48 | 80.53 50.44 30.09 | 0.82 0.79 0.90 |
tcpip2_cpu_msec/MB tcpip2_vcpu_msec/MB tcpip2_ccpu_msec/MB | 22.76 12.80 9.96 | 13.96 5.59 8.38 | 0.61 0.44 0.84 | 21.27 11.96 9.30 | 12.95 5.18 7.77 | 0.61 0.43 0.84 | 21.43 11.91 9.53 | 13.20 5.43 7.76 | 0.62 0.46 0.81 |
tcpip3_cpu_msec/MB tcpip3_vcpu_msec/MB tcpip3_ccpu_msec/MB | 15.65 11.38 4.27 | 12.57 8.38 4.19 | 0.80 0.74 0.98 | 15.95 11.96 3.99 | 12.95 9.07 3.89 | 0.81 0.76 0.97 | 17.46 12.70 4.76 | 14.75 10.09 4.66 | 0.84 0.79 0.98 |
| Note: 2064-109; LPAR with 2 dedicated processors | |||||||||
Number of clients runid TCPIP level | 01 420ccs12 420 | 01 208ccs12 430 | 01
| 05 420ccs52 420 | 05 208ccs52 430 | 05
| 10 420ccsa3 420 | 10 208ccsa3 430 | 10
|
|---|---|---|---|---|---|---|---|---|---|
trans/sec total_cpu_util | 43.01 34.00 | 44.09 32.30 | 1.03 0.95 | 62.09 51.60 | 62.75 51.00 | 1.01 0.99 | 65.46 54.40 | 66.27 53.60 | 1.01 0.99 |
tcpip2_tot_cpu_util tcpip3_tot_cpu_util | 4.55 47.27 | 3.33 46.36 | 0.73 0.98 | 4.55 78.48 | 3.03 79.39 | 0.67 1.01 | 3.33 85.76 | 2.42 85.76 | 0.73 1.00 |
cpu_msec/trans emul_msec/trans cp_msec/trans | 15.81 13.67 2.14 | 14.65 12.57 2.09 | 0.93 0.92 0.98 | 16.62 15.01 1.61 | 16.25 14.66 1.59 | 0.98 0.98 0.99 | 16.62 15.28 1.34 | 16.18 14.85 1.33 | 0.97 0.97 0.99 |
tcpip2_cpu_msec/trans tcpip2_vcpu_msec/trans tcpip2_ccpu_msec/trans | 1.06 0.56 0.49 | 0.76 0.27 0.48 | 0.72 0.48 0.98 | 0.73 0.39 0.34 | 0.48 0.19 0.29 | 0.66 0.49 0.85 | 0.51 0.32 0.19 | 0.37 0.14 0.23 | 0.73 0.44 1.21 |
tcpip3_cpu_msec/trans tcpip3_vcpu_msec/trans tcpip3_ccpu_msec/trans | 10.99 10.71 0.28 | 10.52 10.24 0.27 | 0.96 0.96 0.96 | 12.64 12.40 0.24 | 12.65 12.41 0.24 | 1.00 1.00 1.00 | 13.10 12.87 0.23 | 12.94 12.71 0.23 | 0.99 0.99 1.00 |
| Note: 2064-109; LPAR with 2 dedicated processors | |||||||||
Number of clients runid TCPIP level | 01 420crs11 420 | 01 208crs11 430 | 01
| 05 420crs52 420 | 05 208crs51 430 | 05
| 10 420crsa2 420 | 10 208crsa3 430 | 10
|
|---|---|---|---|---|---|---|---|---|---|
trans/sec total_cpu_util | 258.85 17.40 | 264.54 15.50 | 1.02 0.89 | 461.62 25.80 | 468.94 22.80 | 1.02 0.88 | 494.71 24.80 | 504.52 23.10 | 1.02 0.93 |
tcpip2_tot_cpu_util tcpip3_tot_cpu_util | 6.67 6.33 | 5.15 5.45 | 0.77 0.86 | 5.76 9.09 | 3.94 7.88 | 0.68 0.87 | 3.33 8.79 | 2.12 7.88 | 0.64 0.90 |
cpu_msec/trans emul_msec/trans cp_msec/trans | 1.34 0.83 0.51 | 1.17 0.67 0.50 | 0.87 0.81 0.98 | 1.12 0.76 0.36 | 0.97 0.63 0.34 | 0.87 0.83 0.94 | 1.00 0.72 0.29 | 0.92 0.63 0.28 | 0.92 0.88 0.97 |
tcpip2_cpu_msec/trans tcpip2_vcpu_msec/trans tcpip2_ccpu_msec/trans | 0.26 0.14 0.12 | 0.19 0.07 0.13 | 0.73 0.50 1.08 | 0.12 0.07 0.05 | 0.08 0.03 0.05 | 0.67 0.43 1.00 | 0.07 0.04 0.02 | 0.04 0.02 0.02 | 0.57 0.50 1.00 |
tcpip3_cpu_msec/trans tcpip3_vcpu_msec/trans tcpip3_ccpu_msec/trans | 0.24 0.14 0.10 | 0.21 0.10 0.10 | 0.88 0.71 1.00 | 0.20 0.11 0.09 | 0.17 0.08 0.08 | 0.85 0.73 0.89 | 0.18 0.10 0.08 | 0.16 0.07 0.08 | 0.89 0.70 1.00 |
| Note: 2064-109; LPAR with 2 dedicated processors | |||||||||
Table 16. VCTC - Streaming 1500
Number of clients runid TCPIP level | 01 420vss13 420 | 01 208vss12 430 | 01
| 05 420vss51 420 | 05 208vss52 430 | 05
| 10 420vssa2 420 | 10 208vssa1 430 | 10
|
|---|---|---|---|---|---|---|---|---|---|
MB/sec total_cpu_util | 31.00 80.80 | 35.43 79.50 | 1.14 0.98 | 33.85 95.30 | 40.33 95.40 | 1.19 1.00 | 32.20 96.70 | 39.70 96.40 | 1.23 1.00 |
tcpip2_tot_cpu_util tcpip3_tot_cpu_util | 37.88 52.73 | 32.12 53.64 | 0.85 1.02 | 38.79 59.70 | 34.85 60.91 | 0.90 1.02 | 37.33 59.67 | 33.94 59.70 | 0.91 1.00 |
cpu_msec/MB emul_msec/MB cp_msec/MB | 52.13 31.61 20.52 | 44.88 25.35 19.53 | 0.86 0.80 0.95 | 56.31 34.92 21.39 | 47.31 27.47 19.84 | 0.84 0.79 0.93 | 60.06 37.52 22.55 | 48.56 28.56 20.00 | 0.81 0.76 0.89 |
tcpip2_cpu_msec/MB tcpip2_vcpu_msec/MB tcpip2_ccpu_msec/MB | 12.22 6.65 5.57 | 9.07 3.42 5.64 | 0.74 0.51 1.01 | 11.46 6.62 4.83 | 8.64 3.38 5.26 | 0.75 0.51 1.09 | 11.59 6.73 4.87 | 8.55 3.36 5.19 | 0.74 0.50 1.07 |
tcpip3_cpu_msec/MB tcpip3_vcpu_msec/MB tcpip3_ccpu_msec/MB | 17.01 9.87 7.14 | 15.14 8.13 7.01 | 0.89 0.82 0.98 | 17.64 10.47 7.16 | 15.10 8.34 6.76 | 0.86 0.80 0.94 | 18.53 10.97 7.56 | 15.04 8.40 6.64 | 0.81 0.77 0.88 |
| Note: 2064-109; LPAR with 2 dedicated processors | |||||||||
Number of clients runid TCPIP level | 01 420vcs12 420 | 01 208vcs12 430 | 01
| 05 420vcs52 420 | 05 208vcs52 430 | 05
| 10 420vcsa1 420 | 10 208vcsa2 430 | 10
|
|---|---|---|---|---|---|---|---|---|---|
trans/sec total_cpu_util | 61.07 56.60 | 66.42 56.10 | 1.09 0.99 | 70.91 59.50 | 72.47 58.90 | 1.02 0.99 | 69.33 58.50 | 70.72 58.60 | 1.02 1.00 |
tcpip2_tot_cpu_util tcpip3_tot_cpu_util | 6.06 84.24 | 4.85 78.18 | 0.80 0.93 | 3.94 94.24 | 2.42 94.24 | 0.61 1.00 | 3.03 93.33 | 1.82 94.55 | 0.60 1.01 |
cpu_msec/trans emul_msec/trans cp_msec/trans | 18.54 16.47 2.06 | 16.89 14.91 1.99 | 0.91 0.91 0.97 | 16.78 15.29 1.49 | 16.26 14.99 1.27 | 0.97 0.98 0.85 | 16.88 15.52 1.36 | 16.57 15.41 1.16 | 0.98 0.99 0.85 |
tcpip2_cpu_msec/trans tcpip2_vcpu_msec/trans tcpip2_ccpu_msec/trans | 0.99 0.45 0.55 | 0.73 0.23 0.50 | 0.74 0.51 0.91 | 0.56 0.30 0.26 | 0.33 0.13 0.21 | 0.59 0.43 0.81 | 0.44 0.22 0.22 | 0.26 0.09 0.17 | 0.59 0.41 0.77 |
tcpip3_cpu_msec/trans tcpip3_vcpu_msec/trans tcpip3_ccpu_msec/trans | 13.79 13.25 0.55 | 11.77 11.27 0.50 | 0.85 0.85 0.91 | 13.29 12.91 0.38 | 13.00 12.67 0.33 | 0.98 0.98 0.87 | 13.46 13.11 0.35 | 13.37 13.07 0.30 | 0.99 1.00 0.86 |
| Note: 2064-109; LPAR with 2 dedicated processors | |||||||||
Number of clients runid TCPIP level | 01 420vrs12 420 | 01 208vrs13 430 | 01
| 05 420vrs51 420 | 05 208vrs53 430 | 05
| 10 420vrsa2 420 | 10 208vrsa1 430 | 10
|
|---|---|---|---|---|---|---|---|---|---|
trans/sec total_cpu_util | 811.40 53.30 | 908.05 51.00 | 1.12 0.96 | 1604.08 98.90 | 1792.13 99.00 | 1.12 1.00 | 1680.30 98.80 | 1866.83 99.00 | 1.11 1.00 |
tcpip2_tot_cpu_util tcpip3_tot_cpu_util | 22.42 24.85 | 18.79 23.03 | 0.84 0.93 | 32.73 42.73 | 27.88 40.61 | 0.85 0.95 | 29.39 41.82 | 24.85 39.70 | 0.85 0.95 |
cpu_msec/trans emul_msec/trans cp_msec/trans | 1.31 0.79 0.52 | 1.12 0.62 0.50 | 0.85 0.78 0.96 | 1.23 0.77 0.47 | 1.10 0.65 0.46 | 0.89 0.84 0.98 | 1.18 0.75 0.43 | 1.06 0.64 0.42 | 0.90 0.85 0.98 |
tcpip2_cpu_msec/trans tcpip2_vcpu_msec/trans tcpip2_ccpu_msec/trans | 0.28 0.13 0.15 | 0.21 0.06 0.14 | 0.75 0.46 0.93 | 0.20 0.09 0.11 | 0.16 0.04 0.11 | 0.80 0.44 1.00 | 0.17 0.08 0.10 | 0.13 0.04 0.09 | 0.76 0.50 0.90 |
tcpip3_cpu_msec/trans tcpip3_vcpu_msec/trans tcpip3_ccpu_msec/trans | 0.31 0.16 0.15 | 0.25 0.11 0.14 | 0.81 0.69 0.93 | 0.27 0.13 0.14 | 0.23 0.09 0.14 | 0.85 0.69 1.00 | 0.25 0.12 0.13 | 0.21 0.09 0.13 | 0.84 0.75 1.00 |
| Note: 2064-109; LPAR with 2 dedicated processors | |||||||||
Back to Table of Contents.
z/VM Version 4 Release 2.0
This section summarizes the performance characteristics of z/VM 4.2.0 and the results of the z/VM 4.2.0 performance evaluation.
Back to Table of Contents.
Summary of Key Findings
This section summarizes the performance evaluation of z/VM 4.2.0. For further information on any given topic, refer to the page indicated in parentheses.
z/VM 4.2.0 includes a number of performance enhancements (see Performance Improvements). In addition, some changes were made that affect VM performance management (see Performance Management):
- Performance Improvements
- Fast CCW Translation and Minidisk Caching for 64-bit DASD I/O
- Block Paging Improvement
- DDR LZCOMPACT Option
- Performance Management Changes
- Monitor Enhancements
- Effects on Accounting Data
- VM Performance Products
Regression measurements for the CMS environment (CMS1 workload) and the VSE guest environment (DYNAPACE workload) indicate that the performance of z/VM 4.2.0 is equivalent to z/VM 4.1.0 and that the performance of TCP/IP Level 420 is equivalent to TCP/IP Level 410.
z/VM 4.2.0 provides support for HiperSockets, now available on z/900 and z/800 processors. HiperSockets provides a high-bandwidth communications path within a logical partition (LPAR) and between LPARs within the same processor complex. HiperSockets support is enabled by APARs VM62938 and PQ51738. In addition, VM63034 is recommended. Measurement results using TCP/IP VM (see HiperSockets and VM Guest Lan Support) and using Linux guests (see Linux Connectivity Performance) show that HiperSockets provides excellent performance that compares well with existing facilities such as IUCV and virtual CTC that VM provides for communication within a single VM system.
z/VM 4.2.0 introduces VM Guest LAN, a facility that allows a VM guest to define a virtual HiperSockets adapter and connect it with other virtual HiperSockets adapters on the same VM system to form an emulated LAN segment. This allows for simplified configuration of high speed communication paths between large numbers of virtual machines. Measurement results using TCP/IP VM (see HiperSockets and VM Guest Lan Support) and using Linux guests (see Linux Connectivity Performance) indicate that this support performs well over a wide range of workloads and system configurations.
The CCW translation fast path and minidisk caching have now been extended to include 64-bit DASD I/O, resulting in reduced processing time and I/Os. Which cases are eligible and the degree of improvement are equivalent to what is already experienced with 31-bit I/O. (Exception: FBA devices do have fast CCW translation for 64-bit I/O but not MDC support.) CP CPU time decreases, ranging from 32% to 38%, were observed for the measured workload (see 64-bit Fast CCW Translation).
Guest support for the FICON channel-to-channel adapter is provided by z/VM 4.2.0 with APAR VM62906. Throughput of bulk data transfer was measured to be over twice that obtained using an ESCON connection, while CPU usage per megabyte transferred was similar (see Guest Support for FICON CTCA).
Measurements indicate that the new, 64-bit capable PFAULT service provides performance benefits that are comparable to the existing (31-bit) PAGEX asynchronous page fault service (see 64-bit Asynchronous Page Fault Service (PFAULT)).
In most cases, use of the LZCOMPACT option will reduce the length of tape required to hold a DDR dump relative to using the existing COMPACT option. Decreases ranging from 1% to 28% were observed (see DDR LZCOMPACT Option).
TCP/IP level 420 provides an IMAP server. Measurement results show that one IMAP server running on z/900 hardware can support over 2700 simulated IMAP users with good performance (see IMAP Server).
Measurement results indicate that the usual minidisk cache tuning guidelines apply to the case of Linux guests doing I/O to a VM minidisk. That is, MDC is highly beneficial when most I/Os are reads but causes additional overhead, and therefore should be turned off, for minidisks where many of the I/Os are writes (see Linux Guest DASD Performance).
Back to Table of Contents.
Changes That Affect Performance
This chapter contains descriptions of various changes in z/VM 4.2.0 that affect performance. It is divided into two sections -- Performance Improvements and Performance Management. This information is also available on our VM Performance Changes page, along with corresponding information for previous releases.
Back to Table of Contents.
Performance Improvements
The following items improve performance:
- Fast CCW Translation and Minidisk Caching for 64-bit DASD I/O
- Block Paging Improvement
- DDR LZCOMPACT Option
Fast CCW Translation and Minidisk Caching for 64-bit DASD I/O
The CCW translation fast path and minidisk caching have now been extended to include 64-bit DASD I/O, resulting in reduced processing time and I/Os. Which cases are eligible and the degree of improvement are equivalent to what is already experienced with 31-bit I/O. (Exception: FBA devices do have fast CCW translation for 64-bit I/O but not MDC support.) See 64-bit Fast CCW Translation for measurement results.
Note: Fast CCW translation for both 31-bit and 64-bit channel-to-channel I/O was provided in z/VM 4.1.0. See Fast CCW Translation for Network I/O for additional information.
Block Paging Improvement
For improved efficiency, CP typically writes pages to DASD in blocks consisting of a number of pages that have all been referenced during the same time period. Later, when a page fault occurs for any of those pages, the entire block is read and all of its pages are made valid under the assumption that the pages in the block tend to be used together.
In prior releases, all pages in a given block were required to reside in the same megabyte of virtual storage. With z/VM 4.2.0, this restriction has been removed. As a result, the set of pages that now make up a block will tend to be more closely related in terms of their reference pattern, resulting in faster average page resolution times and a reduction in overall paging.
The amount of improvement is expected to be small for most environments. The most noticeable improvements are expected for environments that have high DASD page rates and DAT ON guests.
DDR LZCOMPACT Option
A new LZCOMPACT option can now be specified on the output I/O definition control statement when using DDR to dump to tape. This provides an alternative to the compression algorithm used by the existing COMPACT option. Unlike the COMPACT option, the data compression done when the LZCOMPACT option is specified can make use of the hardware compression facility to greatly speed up data compression (DUMP) and decompression (RESTORE).
Measurement results indicate that use of the LZCOMPACT option will tend to result in the following performance characteristics relative to the COMPACT option:
Increased processor time and slightly increased elapsed time on processors that do not have the hardware compression facility.
Reduced processor time and slightly decreased elapsed time on processors having the hardware compression facility.
A higher compression ratio.
The same number of tape I/Os.
A decrease in tape length requirements. Decreases ranging from 1% to 28% have been observed for 9 example DASD volumes. This improvement can result in fewer tape cartridges being required, depending on tape cartridge capacity and the amount of data being dumped.
For measurement results and further discussion, see DDR LZCOMPACT Option.
Back to Table of Contents.
Performance Management
These changes affect the performance management of z/VM and TCP/IP VM.
- Monitor Enhancements
- Effects on Accounting Data
- VM Performance Products
Monitor Enhancements
One of the key changes to CP Monitor for z/VM 4.2.0 is that the record layouts are now included on the VM Home Page in the same section as the VM Control Block reference material. Visit our control blocks page for more information.
The changes to data content involved support for the HiperSockets function. Domain 0 Record 20 (Extended Channel Path Measurement Data record) was enhanced to include information on channel paths associated with HiperSockets. This involved adding a new channel model group type. In addition, some information was added to records generated by the VM TCP/IP stack related to the HiperSockets function.
Effects on Accounting Data
None of the z/VM 4.2.0 performance changes are expected to have a significant effect on the values reported in the virtual machine resource usage accounting record.
VM Performance Products
This section contains information on the support for z/VM 4.2.0 provided by VMPRF, RTM, FCON/ESA, and VMPAF.
VMPRF support for z/VM 4.2.0 is provided by VMPRF Function Level 4.1.0, which is a preinstalled, priced feature of z/VM 4.2.0. The latest service is recommended, which includes updates that extend the domain 0 record 20 (Extended Channel Measurement Data) support to include the current control units. VMPRF 4.1.0 can also be used to reduce CP monitor data obtained from any supported VM release.
RTM support for z/VM 4.2.0 is provided by Real Time Monitor Function Level 4.1.0. As with VMPRF, RTM is a preinstalled, priced feature of z/VM 4.2.0. The latest service is recommended, which includes the following additional QUERY ENV display output: processor model, processor configuration data, LPAR configuration data, and (if applicable) second level VM configuration data.
To run FCON/ESA on any level of z/VM, FCON/ESA Version 3.2.02 or higher is required. Version 3.2.03 of the program also implements some new monitor data, and it provides an interface for displaying Linux internal performance data; this is the recommended minimum level for operation with z/VM 4.2.0. The program runs on z/VM systems in both 31-bit and 64-bit mode and on any previous VM/ESA release.
Performance Analysis Facility/VM 1.1.3 (VMPAF) will run on z/VM 4.2.0 with the same support as z/VM 4.1.0.
Back to Table of Contents.
New Functions
This section contains performance evaluation results for the following new functions:
- HiperSockets and VM Guest Lan Support
- 64-bit Fast CCW Translation
- 64-bit Asynchronous Page Fault Service (PFAULT)
- Guest Support for FICON CTCA
- DDR LZCOMPACT Option
- IMAP Server
Back to Table of Contents.
HiperSockets
Starting with the z/900 Model 2064, z/Architecture provides a new type of I/O device called HiperSockets. As an extension to the Queued Direct I/O Hardware Facility, HiperSockets provides a high-bandwidth method for programs to communicate within the same logical partition (LPAR) or across any logical partition within the same Central Electronics Complex (CEC) using traditional TCP/IP socket connections.VM Guest LAN support, also in z/VM 4.2.0, provides the capability for a VM guest to define a virtual HiperSocket adapter and connect it with other virtual network adapters on the same VM host system to form an emulated LAN segment. While real HiperSockets support requires a z/800 or z/900, VM Guest LAN support is available on G5 and G6 processors as well.
This section summarizes the results of a performance evaluation of TCP/IP VM comparing the new HiperSockets and Guest LAN support with existing QDIO, IUCV and VCTC support.
Methodology: An internal tool was used to drive request-response (RR), connect-request-response (CRR) and streaming (S) workloads. The request-response workload consisted of the client sending 200 bytes to the server and the server responding with 1000 bytes. This interaction lasted for 200 seconds. The connect-request-response workload had the client connecting, sending 64 bytes to the server, the server responding with 8K and the client then disconnecting. This same sequence was repeated for 200 seconds. The streaming workload consisted of the client sending 20 bytes to the server and the server responding with 20MB. This sequence was repeated for 400 seconds.
Each workload was run using IUCV, VCTC, HiperSockets, Guest LAN and QDIO connectivity at various MTU sizes. For IUCV, VCTC and QDIO 1500 and 8992 MTU sizes were chosen. For HiperSockets and Guest LAN 8K, 16K, 32K and 56K MTU sizes were used. For HiperSockets, the Maximum Frame Size (MFS) specified on the CHPID definition is also important. The MFS defined for the system were 16K, 24K, 40K and 64K and are associated with MTU sizes of 8K, 16K, 32K and 56K respectively. All measurements included 1, 5, 10, 20 and 50 client-server pairs. The clients and servers ran on the same VM system with a TCPIP stack for the clients and a separate TCPIP stack for the servers.
The measurements were done on a 2064-109 in an LPAR with 2 dedicated processors. The LPAR had 1GB central storage and 2GB expanded storage. APARs VM62938 and PQ51738, which enable HiperSockets support, were applied. CP monitor data was captured during the measurement run, and reduced using VMPRF.
Specifying DATABUFFERLIMITS 10 10 in the TCPIP configuration file helped to increase the throughput. It was also necessary to specify 65536 for DATABUFFERPOOLSIZE and LARGEENVELOPEPOOLSIZE to support the larger MTUs.
Results: The following charts show, for each workload (RR, CRR and streaming), throughput and CPU time. Each chart has a line for each connectivity/MTU pair measured. Throughput for all cases shows generally the same trend of reaching a plateau and then trailing off. The corresponding CPU time, in general, shows the same pattern where time decreases until the throughput plateau is reached. As throughput trails off, the time increases showing we've passed the optimum point. Specific details are mentioned for each workload after the charts for that workload.
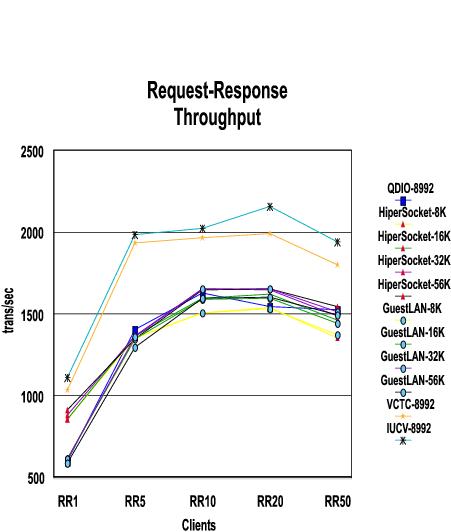 |
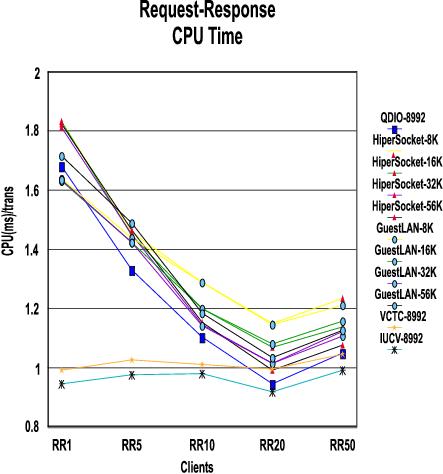 |
The CPU Time shows that while the legacy connectivity types (IUCV and VCTC) have basically the same time no matter how many client-server pairs are running, the others do gain efficiency as the number of connections increases until about 20 connections.
MTU size doesn't have much effect on throughput because of the small amount of data sent in the RR workload.
IUCV and VCTC have better throughput since they have been optimized for VM-to-VM communication whereas the other connectivity types have to support more than just the VM environment and therefore are not as optimized.
The throughput for all connectivity types plateaus at 10 users.
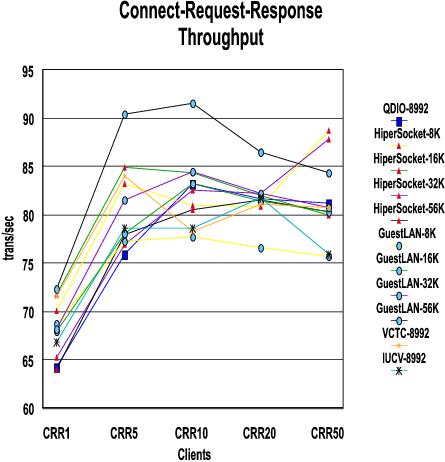 |
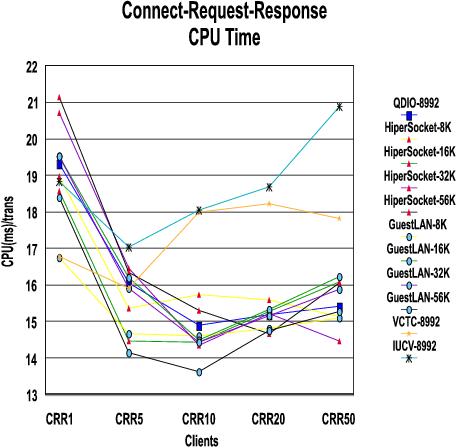 |
With the CRR workload, IUCV and VCTC have lost their advantage because they are not as efficient with connect and disconnect. The optimization done for moving data does not help as much with this workload.
The CPU times are greater for CRR than RR for the same reason (connect and disconnect overhead).
The plateau is reached between 5 and 10 users, depending on the connectivity type.
Guest LAN handles CRR more efficiently than the other types.
Figure 5. Streaming Throughput
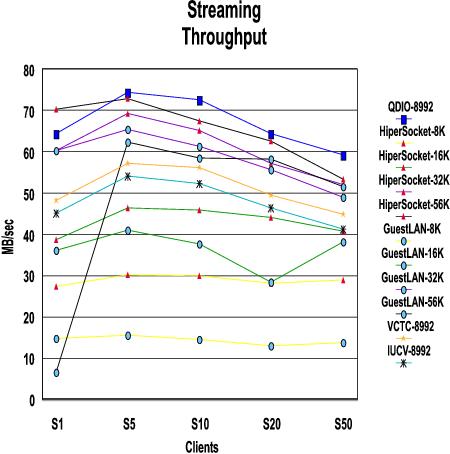 |
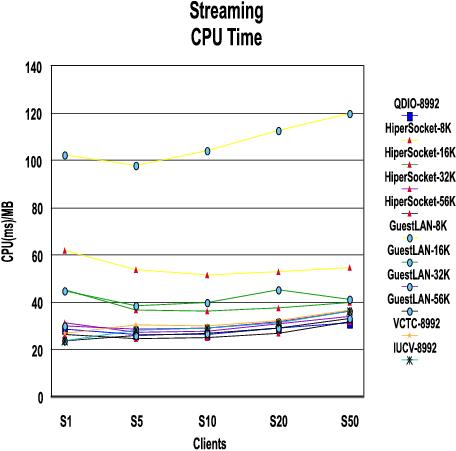 |
The number of connections is not as significant for the streaming workload as it was for RR and CRR.
MTU size, however, does make a difference with this workload because of the large amounts of data being transferred. Bigger is better.
An anomaly was noted for the single user Guest LAN case when running with 56K MTU size. This is currently being investigated.
It is possible that IUCV and VCTC may do better than shown in this chart if an MTU size larger than 8992 is chosen.
The throughput and CPU time results for all runs are summarized in
the following tables (by connectivity type).
Table 1. Throughput and CPU Time: HiperSockets
MTU Size | 8K | 16K | 32K | 56K |
|---|---|---|---|---|
Throughput (trans/sec) |
|
|
|
|
RR1 RR5 RR10 RR20 RR50 | 852.06 1352.97 1508.20 1535.70 1351.26 | 856.69 1365.10 1595.59 1620.41 1462.30 | 877.11 1364.84 1656.22 1648.21 1486.11 | 913.99 1347.30 1646.97 1651.54 1542.31 |
CRR1 CRR5 CRR10 CRR20 CRR50 | 70.10 83.29 80.99 80.90 88.70 | 71.78 84.92 84.32 82.00 79.99 | 65.27 76.98 82.60 82.19 87.89 | 64.04 77.98 80.54 81.58 80.36 |
Throughput (MB/sec) |
|
|
|
|
S1 S5 S10 S20 S50 | 27.45 30.10 29.90 28.27 28.93 | 38.63 46.46 45.98 44.17 40.71 | 60.40 69.33 65.19 57.36 52.07 | 70.43 72.86 67.49 62.72 53.25 |
CPU time (msec/trans) |
|
|
|
|
RR1 RR5 RR10 RR20 RR50 | 1.83 1.46 1.29 1.15 1.24 | 1.83 1.45 1.20 1.07 1.14 | 1.81 1.45 1.15 1.02 1.12 | 1.82 1.47 1.15 0.99 1.08 |
CRR1 CRR5 CRR10 CRR20 CRR50 | 18.97 15.37 15.73 15.60 15.13 | 18.56 14.46 14.44 15.27 16.08 | 20.71 16.47 14.33 15.21 14.47 | 21.14 16.34 15.30 14.66 16.05 |
CPU time (msec/MB) |
|
|
|
|
S1 S5 S10 S20 S50 | 61.86 53.89 51.64 52.92 54.61 | 45.41 36.50 36.45 37.49 39.65 | 31.13 27.23 27.76 30.65 33.99 | 26.44 24.43 25.16 26.75 31.70 |
| Note: 2064-109; z/VM 4.2.0 with 64-bit CP | ||||
Table 2. Throughput and CPU Time: Guest LAN
MTU Size | 8K | 16K | 32K | 56K |
|---|---|---|---|---|
Throughput (trans/sec) |
|
|
|
|
RR1 RR5 RR10 RR20 RR50 | 612.12 1352.50 1507.93 1530.21 1374.24 | 614.10 1349.25 1587.62 1596.38 1444.74 | 614.19 1359.39 1655.89 1654.49 1514.85 | 584.38 1293.02 1597.29 1602.41 1490.61 |
CRR1 CRR5 CRR10 CRR20 CRR50 | 68.67 77.30 77.70 76.63 75.67 | 67.94 78.08 83.21 81.45 80.30 | 68.15 81.55 84.43 82.26 80.74 | 72.35 90.44 91.54 86.51 84.42 |
Throughput (MB/sec) |
|
|
|
|
S1 S5 S10 S20 S50 | 14.89 15.54 14.43 12.94 13.72 | 36.02 40.95 37.65 28.37 38.13 | 60.29 65.36 61.40 55.57 49.03 | 6.46 62.39 58.57 58.30 51.51 |
CPU time (msec/trans) |
|
|
|
|
RR1 RR5 RR10 RR20 RR50 | 1.64 1.44 1.29 1.14 1.21 | 1.63 1.42 1.20 1.08 1.16 | 1.63 1.42 1.14 1.02 1.11 | 1.72 1.49 1.18 1.03 1.13 |
CRR1 CRR5 CRR10 CRR20 CRR50 | 16.75 14.67 14.62 14.80 15.09 | 19.52 16.19 14.49 15.32 16.21 | 19.52 15.92 14.43 15.15 15.88 | 18.38 14.13 13.63 14.75 15.28 |
CPU time (msec/MB) |
|
|
|
|
S1 S5 S10 S20 S50 | 102.22 98.07 104.23 112.98 119.97 | 44.81 38.34 39.73 45.19 41.17 | 29.86 28.43 29.09 31.71 36.26 | 23.53 26.00 26.98 28.99 32.93 |
| Note: 2064-109; z/VM 4.2.0 with 64-bit CP | ||||
Table 3. Throughput and CPU Time: QDIO
MTU Size | 1500 | 8992 |
|---|---|---|
Throughput (trans/sec) |
|
|
RR1 RR5 RR10 RR20 RR50 | 594.29 1410.62 1631.10 1554.05 1527.24 | 596.85 1406.49 1625.78 1547.36 1527.62 |
CRR1 CRR5 CRR10 CRR20 CRR50 | 62.10 75.30 78.08 77.81 77.30 | 64.17 75.96 83.22 81.68 81.19 |
Throughput (MB/sec) |
|
|
S1 S5 S10 S20 S50 | 40.76 28.65 29.54 30.44 28.62 | 64.32 74.45 72.62 64.46 59.22 |
CPU time (msec/trans) |
|
|
RR1 RR5 RR10 RR20 RR50 | 1.68 1.32 1.09 0.94 1.05 | 1.68 1.33 1.10 0.94 1.05 |
CRR1 CRR5 CRR10 CRR20 CRR50 | 16.81 14.98 14.47 14.27 14.54 | 19.32 16.06 14.90 15.18 15.42 |
CPU time (msec/MB) |
|
|
S1 S5 S10 S20 S50 | 43.23 45.45 48.75 52.76 59.89 | 28.64 26.46 26.47 29.23 31.17 |
| Note: 2064-109; z/VM 4.2.0 with 64-bit CP | ||
Table 4. Throughput and CPU Time: IUCV
Throughput MTU Size |
|
|
|---|---|---|
Throughput (trans/sec) |
|
|
RR1 RR5 RR10 RR20 RR50 |
| 1109.99 1985.96 2022.08 2159.24 1942.32 |
CRR1 CRR5 CRR10 CRR20 CRR50 |
| 66.79 78.60 78.61 81.81 75.98 |
Throughput (MB/sec) |
|
|
S1 S5 S10 S20 S50 | 34.39 43.18 40.01 35.75 30.30 | 45.21 54.02 52.32 46.41 41.38 |
CPU time (msec/trans) |
|
|
RR1 RR5 RR10 RR20 RR50 |
| 0.94 0.98 0.98 0.92 0.99 |
CRR1 CRR5 CRR10 CRR20 CRR50 |
| 18.84 17.02 18.06 18.68 20.87 |
CPU time (msec/MB) |
|
|
S1 S5 S10 S20 S50 | 33.91 41.08 45.69 51.08 57.62 | 23.45 28.25 29.09 31.11 36.06 |
| Note: 2064-109; z/VM 4.2.0 with 64-bit CP | ||
Table 5. Throughput and CPU Time: VCTC
MTU Size | 1500 | 8992 |
|---|---|---|
Throughput (trans/sec) |
|
|
RR1 RR5 RR10 RR20 RR50 |
| 1034.59 1933.19 1964.4 1990.4 1799.93 |
CRR1 CRR5 CRR10 CRR20 CRR50 |
| 71.51 84.05 78.25 81.12 80.71 |
Throughput (MB/sec) |
|
|
S1 S5 S10 S20 S50 | 40.58 47.12 46.19 43.30 36.35 | 48.21 57.36 56.14 49.48 44.94 |
CPU time (msec/trans) |
|
|
RR1 RR5 RR10 RR20 RR50 |
| 0.99 1.03 1.01 0.99 1.04 |
CRR1 CRR5 CRR10 CRR20 CRR50 |
| 16.78 15.92 17.99 18.22 17.82 |
CPU time (msec/MB) |
|
|
S1 S5 S10 S20 S50 | 37.11 39.86 41.44 44.16 52.27 | 27.01 30.20 29.96 32.34 36.63 |
| Note: 2064-109; z/VM 4.2.0 with 64-bit CP | ||
Maximum Throughput Results: The maximum throughput for each workload is summarized in the following tables. MB/sec (megabytes per second), trans/sec (transactions per second) and response time were supplied by the workload driver and show the throughput rate. All other values are from CP monitor data or derived from CP monitor data.
Total_cpu_util | This field was obtained from the SYSTEM_SUMMARY_BY_TIME VMPRF report that shows the average of both processors out of 100%. |
tot_cpu_util | This field is calculated from the USER_RESOURCE_UTILIZATION VMPRF report (CPU seconds, total) for the client stack (tcpip1), the server stack (tcpip2) and the driver clients and servers and gives the total system CPU utilization. 100% is the equivalent of one fully utilized processor. |
virt_cpu_util | This field is calculated from the USER_RESOURCE_UTILIZATION VMPRF report (CPU seconds, Virtual) for the client stack (tcpip1), the server stack (tcpip2) and the driver clients and servers (nontcp). This result is the total virtual CPU utilization. |
run+wait | This was calculated from the previous tot_cpu_util plus percent of time waiting on CPU as reported in USER_STATES VMPRF report for each stack (tcpip1 and tcpip2). |
cpu_msec/trans | This field was calculated from the previous tot_cpu_util divided by the number of transactions per second (or number of megabytes per second for the streaming workload) to show the number of milliseconds of time per transaction. |
Table 6. Maximum Throughput: Request-Response
Protocol MTU size Number of clients runid | QDIO 1500 10 qnxr1072 | HIPER 56K 20 h5xr2072 | GUEST 32K 20 g3xr2071 | vCTC 8992 20 vjxr2071 | IUCV 8992 20 ijxr2071 |
|---|---|---|---|---|---|
MB/sec trans/sec response time (msec) elapsed time (sec) total_cpu_util | 1.87 1631.10 6.13 150.00 89.30 | 1.89 1651.54 12.10 150.00 81.90 | 1.89 1654.49 12.08 150.00 84.00 | 2.28 1990.40 10.04 150.00 99.00 | 2.42 2116.14 9.44 150.00 99.20 |
tcpip1_tot_cpu_util tcpip1_virt_cpu_util tcpip1_run+wait | 58.70 45.30 85.40 | 43.30 30.70 66.00 | 47.30 32.00 78.00 | 48.00 22.70 73.30 | 40.00 20.70 69.30 |
tcpip2_tot_cpu_util tcpip2_virt_cpu_util tcpip2_run+wait | 35.30 22.00 48.60 | 32.70 19.30 47.40 | 34.70 19.33 66.70 | 47.30 22.70 76.60 | 40.70 20.70 59.40 |
nontcp_tot_cpu_util nontcp_virt_cpu_util | 80.00 67.33 | 80.00 80.00 | 80.00 80.00 | 106.67 80.00 | 106.67 106.67 |
cpu_msec/trans emul_msec/trans cp_msec/trans | 1.09 0.86 0.24 | 0.99 0.76 0.23 | 1.02 0.76 0.25 | 0.99 0.67 0.33 | 0.94 0.67 0.26 |
tcpip1_cpu_msec/trans tcpip1_vcpu_msec/trans tcpip1_ccpu_msec/trans | 0.36 0.28 0.08 | 0.26 0.19 0.08 | 0.14 0.10 0.05 | 0.24 0.11 0.13 | 0.19 0.10 0.09 |
tcpip2_cpu_msec/trans tcpip2_vcpu_msec/trans tcpip2_ccpu_msec/trans | 0.22 0.13 0.08 | 0.20 0.12 0.08 | 0.10 0.06 0.05 | 0.24 0.11 0.12 | 0.19 0.10 0.09 |
nontcp_cpu_msec/trans nontcp_vcpu_msec/trans nontcp_ccpu_msec/trans | 0.49 0.41 0.08 | 0.48 0.48 0.00 | 0.77 0.61 0.16 | 0.54 0.40 0.13 | 0.50 0.50 0.00 |
| Note: 2064-109; z/VM 4.2.0 with 64-bit CP; TCP/IP 420 | |||||
Both IUCV and vCTC attained 99% CPU utilization for this workload and therefore are gated by the available processors. IUCV had the best throughput with 2116.14 transactions a second.
The driver client virtual machines communicate with the TCPIP2 stack virtual machine. The driver server virtual machines communicate with the TCPIP1 stack virtual machine. All cases show that the driver clients and servers used a large portion of the resources available.
Table 7. Maximum Throughput: Connect-Request-Response
Protocol MTU Size Number of clients runid | QDIO 8992 10 qjxc1071 | HIPER 8K 50 h8xc5071 | GUEST 56K 10 g5xc1073 | vCTC 8992 05 vjxc0572 | IUCV 8992 20 ijxc2072 |
|---|---|---|---|---|---|
MB/sec trans/sec response time (msec) elapsed time (sec) total_cpu_util | 0.66 83.22 120.16 150.00 62.00 | 0.70 88.74 563.71 120.00 67.10 | 0.72 91.54 109.24 150.00 62.40 | 0.66 84.05 59.49 150.00 66.90 | 0.64 81.81 244.47 150.00 76.40 |
tcpip1_tot_cpu_util tcpip1_virt_cpu_util tcpip1_run+wait | 88.70 87.30 98.00 | 85.80 84.20 92.50 | 86.70 84.70 89.40 | 84.70 82.70 99.40 | 92.70 91.30 100.70 |
tcpip2_tot_cpu_util tcpip2_virt_cpu_util tcpip2_run+wait | 24.00 22.70 28.00 | 33.30 31.70 43.30 | 25.30 23.30 29.30 | 38.70 37.30 45.40 | 50.00 48.70 58.00 |
nontcp_tot_cpu_util nontcp_virt_cpu_util | 13.33 13.33 | 0.00 0.00 | 13.33 13.33 | 8.67 6.67 | 0.00 0.00 |
cpu_msec/trans emul_msec/trans cp_msec/trans | 14.90 14.28 0.62 | 15.13 14.27 0.86 | 13.63 12.93 0.71 | 15.92 15.18 0.74 | 18.68 18.07 0.61 |
tcpip1_cpu_msec/trans tcpip1_vcpu_msec/trans tcpip1_ccpu_msec/trans | 10.65 10.49 0.16 | 9.68 9.49 0.19 | 9.47 9.25 0.22 | 10.07 9.84 0.24 | 11.33 11.16 0.16 |
tcpip2_cpu_msec/trans tcpip2_vcpu_msec/trans tcpip2_ccpu/_msec/trans | 2.88 2.72 0.16 | 3.76 3.57 0.19 | 2.77 2.55 0.22 | 4.60 4.44 0.16 | 6.11 5.95 0.16 |
nontcp_cpu_msec/trans nontcp_vcpu_msec/trans nontcp_ccpu_msec/trans | 1.60 1.60 0.00 | 0.00 0.00 0.00 | 1.46 1.46 0.00 | 1.03 0.79 0.24 | 0.00 0.00 0.00 |
| Note: 2064-109; z/VM 4.2.0 with 64-bit CP; TCP/IP 420 | |||||
CRR throughput is less than RR throughput due to the overhead
of connect/disconnect.
Guest LAN seemed to handle the CRR workload the best.
The client stack appeared to be the limiting factor in all cases.
For all cases 90% of the time or greater the stacks were either
running or waiting for the CPU.
Since the stack design is based on a uni-processor model, it will
never be able to exceed 100% of one processor.
Table 8. Maximum Throughput: Streaming
Protocol MTU Size Number of clients runid | QDIO 8992 05 qjxs0573 | HIPER 56K 05 h5xs0573 | GUEST 32K 05 g3xs0573 | vCTC 8992 05 vjxs0573 | IUCV 8992 05 ijxs0572 |
|---|---|---|---|---|---|
MB/sec trans/sec response time(msec) elapsed time (sec) total_cpu_util | 74.45 3.72 1343.24 330.00 98.50 | 72.86 3.64 1372.57 330.00 89.00 | 65.36 3.27 1530.00 330.00 92.97 | 57.36 2.87 1743.30 330.00 86.61 | 54.02 2.70 1851.07 330.00 76.39 |
tcpip1_tot_cpu_util tcpip1_virt_cpu_util tcpip1_run+wait | 93.00 70.30 96.00 | 92.10 70.00 99.40 | 91.50 59.40 98.20 | 60.30 26.10 77.90 | 48.50 26.10 60.00 |
tcpip2_tot_cpu_util tcpip2_virt_cpu_util tcpip2_run+wait | 64.50 40.30 77.20 | 52.10 31.80 63.50 | 57.30 34.50 71.20 | 67.00 26.40 88.80 | 61.50 25.20 76.70 |
nontcp_tot_cpu_util nontcp_virt_cpu_util | 37.88 33.33 | 32.12 24.85 | 36.36 31.82 | 42.73 37.88 | 40.91 34.85 |
cpu_msec/MB emul_msec/MB cp_msec/MB | 26.46 19.23 7.23 | 24.43 17.90 6.53 | 28.43 19.25 9.18 | 30.20 15.73 14.47 | 28.25 16.11 12.14 |
tcpip1_cpu_msec/MB tcpip1_vcpu_msec/MB tcpip1_ccpu_msec/MB | 12.50 9.44 3.05 | 12.64 9.61 3.04 | 14.00 9.09 4.91 | 10.51 4.54 5.97 | 8.98 4.82 4.15 |
tcpip2_cpu_msec/MB tcpip2_vcpu_msec/MB tcpip2_ccpu_msec/MB | 8.67 5.41 3.26 | 7.15 4.37 2.79 | 8.76 5.29 3.48 | 11.68 4.60 7.08 | 11.39 4.66 6.73 |
nontcp_cpu_msec/MB nontcp_vcpu_msec/MB nontcp_ccpu_msec/MB | 5.09 4.48 0.61 | 4.41 3.41 1.00 | 18.18 15.91 4.59 | 7.45 6.60 0.85 | 7.57 6.45 1.12 |
| Note: 2064-109; z/VM 4.2.0 with 64-bit CP; TCP/IP 420 | |||||
QDIO was the winner for the streaming workload. For QDIO, total system CPU utilization limited throughput. For HiperSockets and Guest LAN, the client stack was the limiting factor with more than 95% of the time either running or waiting on the CPU.
Back to Table of Contents.
64-bit Fast CCW Translation
Purpose
In z/VM 4.2.0, IBM extended CP's fast CCW translation facility to provide fast translation support for 64-bit disk I/O. One reason for this enhancement was to give 64-bit guests the reduced CPU consumption benefit of fast translation. Another reason for the enhancement was to to enable 64-bit I/O for minidisk cache (MDC); recall that only those disk I/Os that succeed in using fast translation are eligible for MDC.
The purpose of this experiment was to quantify the CP CPU consumption improvement offered by the 64-bit fast translation extension and compare said improvement to the corresponding improvement fast translation already offers to 31-bit I/O.
We specifically did not design this experiment to measure the impact of MDC on 64-bit disk I/O. This is because the impact of MDC on disk I/O is known from other experiments.
Executive Summary of Results
The new fast translation support reduces CP CPU time per MB for 64-bit Linux DASD I/O by about 38% for writes and by about 33% for reads. This is not quite as dramatic as fast CCW translation's effect on 31-bit Linux DASD I/O, but it is still quite good. We also saw that 64-bit Linux DASD I/O costs about the same (CP CPU time per CCW) as 31-bit I/O.
Hardware
2064-109, LPAR with 2 dedicated CPUs, 1 GB real, 2 GB XSTORE, LPAR dedicated to this experiment during the runs. DASD is RAMAC-1 behind a 3990-6 controller.
Software
z/VM 4.2.0. Also an internal development driver of 64-bit Linux, configured with no swap partition and with one 12 GB LVM logical volume with an ext2 file system thereon. All file systems resided on DEDICATEd full-pack volumes. Finally, we used a DASD I/O exercising tool which opens a Linux file (the "ballast file"), writes it in 16 KB chunks until the desired file size is reached, closes it, then performs N (N>=0) open-read-close passes over the file, reading the file in 16 KB chunks during each pass.
Experiment
The general idea is that we ran the DASD I/O exercising tool a number of times, each run having a different environmental configuration. For each run, we collected elapsed time (seconds, via CP QUERY TIME), virtual CPU time (hundredths of seconds, via CP QUERY TIME), CP CPU time (hundredths of seconds, via CP QUERY TIME), and virtual I/O count (via CP INDICATE USER * EXP). Also, the tool prints its observed write data rate (KB/sec) and observed read data rate (KB/sec) when it finishes its run.
We ran the tool 16 times, varying the Linux virtual machine architecture mode (ESA/390 or z/Architecture), the number of read passes over the ballast file (0 or 1), the setting of CP SET MDCACHE (OFF or ON), and whether fast CCW translation was intentionally disabled via a zap (CP STORE HOST) in CP.
Observations
In the results table, each run name is a six-character token smmffr, where:
Portion | Meaning |
s | 3 for a 128 MB Linux guest doing ESA/390 I/O to a 384 MB ballast file, or 6 for a 3072 MB Linux guest doing z/Architecture I/O to a 9216 MB ballast file |
mm | M1 for MDC enabled, or M0 for MDC disabled |
ff | F1 for fast CCW translation enabled, or F0 for fast CCW translation disabled |
r | The number of read passes over the file, 0 or 1 |
So run 3M0F01 would be the small Linux guest, MDC disabled, fast CCW translation disabled, and one read pass.
Note that Linux automatically selects 31-bit mode or 64-bit mode according to whether the storage size is greater than 2 GB. So, to vary the mode, we just varied the storage size. Note also that we chose the ballast file to be three times the size of the Linux virtual machine, so as to suppress Linux's attempts to use its internal file cache.
Here are the results we collected:
| Run name | CP CPU / MB (msec/MB) | Observed read rate (KB/sec) | Observed write rate (KB/sec) |
|---|---|---|---|
| 3M1F10 | 0.625 | n/a | 2853 |
| 3M0F10 | 0.651 | n/a | 2553 |
| 3M1F00 | 1.589 | n/a | 2551 |
| 3M0F00 | 1.484 | n/a | 3268 |
| 6M1F10 | 2.077 | n/a | 3043 |
| 6M0F10 | 2.064 | n/a | 3056 |
| 6M1F00 | 3.352 | n/a | 3008 |
| 6M0F00 | 3.237 | n/a | 3024 |
| 3M1F11 | 1.224 | 8414 | 2548 |
| 3M0F11 | 1.354 | 8259 | 2580 |
| 3M1F01 | 3.047 | 4973 | 3270 |
| 3M0F01 | 3.021 | 8122 | 2580 |
| 6M1F11 | 4.301 | 2170 | 3047 |
| 6M0F11 | 4.349 | 2063 | 3043 |
| 6M1F01 | 6.373 | 2163 | 3080 |
| 6M0F01 | 6.429 | 2166 | 3055 |
| Note: 2064-109, LPAR with 2 dedicated CPUs, 1 GB real, 2 GB XSTORE, LPAR dedicated to these runs. RAMAC-1 behind 3990-6. z/VM 4.2.0. Internal driver of 64-bit Linux. | |||
We wish to emphasize that previous experience with this DASD I/O tool has shown us that small variations from one "identical" run to another are to be expected. Small unexplainable changes in measured variables are probably due to natural run variation. Unfortunately, this experiment's particular runs are so time-consumptive that doing multiple runs of a given configuration so as to quantify run variability just wasn't practical for this experiment.
Discussion
- We can see that fast CCW translation is definitely working for both the ESA/390 Linux guest and the z/Architecture Linux guest. For the write-only runs, fast translation being enabled reduces CP CPU per MB by about 59% for the small guest and by about 38% for the large guest. For the write-once, read-once runs, fast translation being enabled reduces CP CPU per MB by about 57% for the small guest and by about 33% for the large guest.
- CP CPU per MB for a given large guest run is about
twice the CP CPU per MB for the corresponding small guest
run. This was disconcerting until we looked at I/O traces for
the respective runs. We found that the large Linux guest
performs half as many CCWs per Start Subchannel as the small
guest. We found that
the Linux guest allocates the same size memory buffer for
its channel program, whether it is doing z/Architecture I/O
or ESA/390 I/O. However,
z/Architecture channel programs take twice as much
storage per CCW as ESA/390 channel programs do.
Therefore the large Linux guest is doing twice as many
Start Subchannel operations per MB as the small Linux guest does,
and so the difference in CP CPU time per MB
is easily explained.
We did not collect monitor data to verify that the large guest's Start Subchannel rate is twice the corresponding small guest's rate. The CP CPU time evidence coupled with inspection of the I/O traces satisfied us.
- These experiments read the ballast file at most once. We saw in another experiment (see Linux Guest DASD Performance) that MDC does not come reliably into play until we read the file more than once. So these runs should not be taken to be in any way indicative of MDC effects.
- Readers should note that if an I/O happens to fail the criteria for fast CCW translation, it will also be ineligible for MDC.
Conclusion
z/VM 4.2.0's fast CCW translation for 64-bit DASD I/O is doing what it is supposed to be doing.
Back to Table of Contents.
64-bit Asynchronous Page Fault Service (PFAULT)
Purpose
The purpose of this experiment was to measure the effect of a Linux guest's exploitation of z/VM's PFAULT asynchronous page fault service and compare that effect to the same guest's exploitation of z/VM's similar (but much older) PAGEX asynchronous page fault service.
Executive Summary of Results
As an SPE to z/VM Version 4 Release 2.0, and as service to z/VM 4.1.0 and z/VM 3.1.0, IBM introduced a new asynchronous page fault service, PFAULT. This differs from our previous service, PAGEX, in that PFAULT is both 31-bit-capable and 64-bit-capable. PAGEX is 31-bit only.
We constructed a Linux workload that was both page-fault-intensive and continuously dispatchable. We used said workload to evaluate the benefit Linux could gain from using an asynchronous page fault service such as PFAULT or PAGEX.
We found that the benefit was dramatic. In our experiments, the Linux guest was able to run other work a large fraction of the time it was waiting for a page fault to resolve.
We also found that in our experiments with 31-bit Linux guests, the benefits of PAGEX and PFAULT could not be distinguished from one another.
Hardware
2064-109, LPAR with 2 dedicated CPUs, 1 GB real storage, 2 GB expanded storage, LPAR dedicated to this experiment. DASD is RAMAC-1 behind 3990-6 controller.
Software
System Software: z/VM 4.2.0, with the PFAULT APAR (VM62840) installed. A 31-bit Linux 2.4.7 internal development driver, close to GA level. A 64-bit Linux 2.4.7 internal development driver. We configured each Linux virtual machine with 128 MB of main storage, no swap partition, and its root file system residing on a DEDICATEd 3390 volume.
Applications: We wrote two applications for this measurement:
- The first program was a "thrasher" that randomized page visits. This program allocated 96 MB worth of 4 KB buffers and then ran 10 60-second experiments, sequentially. For each experiment, the program printed a "score" indicating the number of randomized buffer references it completed. It then printed the mean and standard deviation of the scores, released all of the 4 KB buffers, and exited.
- The second was a "CPU burner" that ran a tight loop incrementing a counter. It ran 10 60-second experiments, sequentially, for each experiment printing a "score" indicative of the number of times it incremented the counter. At the end of the 10 experiments, the program printed the mean and standard deviation of the scores and then exited.
Experiment
The basic experiment consisted of this sequence of operations:
- Create three telnet sessions into the Linux guest: a control connection, a thrasher connection, and a burner connection. Log in on all three sessions.
- On the thrasher connection, start the thrasher. Wait for it to print a message indicating that thrashing has begun.
- On the burner connection, start the burner. Wait for it to print a message indicating that looping has begun.
- On the control connection, use Neale Ferguson's cpint package to issue CP QUERY TIME and capture the response.
- Wait for the thrasher and burner to both print the mean and standard deviation of their 10 scores.
- On the control connection, use Neale Ferguson's cpint package to issue CP QUERY TIME and capture the response.
- Wait for the thrasher and burner to return to the shell prompt.
- Logout on all three connections.
We ran our experiment in several different environments:
- Choice of Linux: 31-bit or 64-bit
- Asynchronous page fault method: none, PAGEX, or PFAULT (note: 64-bit Linux does not support PAGEX)
- Storage: storage-rich or storage-constrained
During each experiment, the only virtual machines logged on were the Linux guest itself and a PVM machine.
Some notes about the two storage models we ran:
- For the storage-rich environment, we made sure that the AVAIL value printed by CP QUERY FRAMES showed us that all of our virtual machines completely fit into the CP dynamic paging area (DPA), so that no paging would happen. (In fact we had about four times as much DPA as we needed.)
- For the storage-constrained environment, we used CP's LOCK command to lock the PVM machine's entire address spaces into real storage. We then used CP SET TRACEFRAMES to push AVAIL down to 16384 frames (64 MB) -- that is, 50% of the Linux guest's virtual storage size. We also disabled expanded storage so that all paging would occur to DASD.
Observations
In the following table, the run ID aas8nXm encodes the test environment, like this:
| aa | Architecture mode: 31-bit or 64-bit |
| s | Storage: Rich or Constrained |
| 8n | 80 for PFAULT disabled; 81 for PFAULT enabled |
| Xm | X0 for PAGEX disabled; X1 for PAGEX enabled |
| Run ID | Run duration (mm:ss) | Virtual CPU time (mm:ss.hh) | CP CPU time (mm:ss.hh) | Thrasher score (N/m/sd) | Burner score (N/m/sd) |
|---|---|---|---|---|---|
| 31R80X0 | 10:06 | 10:05.75 | 0.21 | 10/39536259/1763419 | 10/2901/45 |
| 31R80X1 | 10:06 | 10:05.86 | 0.20 | 10/39152366/1767989 | 10/2903/42 |
| 31R81X0 | 10:06 | 10:05.20 | 0.19 | 10/38868525/1515762 | 10/2903/64 |
| 31C80X0 | 11:54 | 4:26.05 | 0.80 | 10/14380/2766 | 10/2576/116 |
| 31C80X1 | 10:51 | 9:44.23 | 0.63 | 10/2489/326 | 10/5672/137 |
| 31C81X0 | 10:06 | 9:49.56 | 0.52 | 10/2545/802 | 10/5652/226 |
| 64R80X0 | 10:06 | 10:05.46 | 0.20 | 10/25875895/1132750 | 10/1342/37 |
| 64R81X0 | 10:06 | 10:05.36 | 0.19 | 10/25884417/1145848 | 10/1342/47 |
| 64C80X0 | 10:07 | 4:27.41 | 0.69 | 10/16179/2755 | 10/1210/55 |
| 64C81X0 | 9:59 | 8:58.97 | 2.12 | 10/27202/3120 | 10/2425/102 |
| Note: 2064-109, LPAR with 2 dedicated CPUs, 1 GB real, 2 GB XSTORE, LPAR dedicated to these runs. RAMAC-1 behind 3990-6. z/VM 4.2.0 with PFAULT APAR. Linux 2.4, 31-bit and 64-bit, internal lab drivers. 128 MB Linux virtual machine, no swap partition, Linux DASD is DEDICATEd 3390 volume, not CMS formatted. Table values of the form N/m/sd decode as number of samples taken, mean of the samples, and standard deviation of the samples. | |||||
Analysis
- We used a twin-tailed t-test to compare the thrasher and burner scores for the 31-bit storage-rich cases. There was no statistically significant difference among either.
- For the storage-rich cases, notice that the Linux guest used almost all of the available wall clock time as CPU time. This is to be expected since the guest was not taking any page faults.
- For the 31-bit, storage-constrained, unassisted case, notice that the Linux machine used only about 4-1/2 minutes of virtual CPU during the run, even though it always had a runnable process. This points out the amount of CPU opportunity the guest missed by not taking advantage of some kind of page fault assist. The "missing CPU time" is the time the Linux guest spent waiting for faults to be resolved instead of running something else.
- For the 31-bit, storage-constrained, PAGEX and PFAULT cases, notice that the guest returned to using nearly all of the run elapsed time as virtual CPU time. This is good news, for it shows that the page fault assist functioned as intended. The Linux guest overlapped execution of the burner process with waiting for CP to resolve page faults for the thrasher.
- We used a twin-tailed t-test to compare the thrasher and burner scores for the two 31-bit, storage-constrained, assisted cases (PAGEX and PFAULT). We found no statistically significant difference between them.
- Comparing the 31-bit, storage-constrained, unassisted case to either of the corresponding assisted cases, we see from the thrasher and burner scores that the burner got more CPU time in the assisted case and the thrasher got less. This makes sense because each time the Linux guest takes a page fault, it stops running the thrasher, switches to the burner, and runs the burner for a whole timer tick. Contrast this with the unassisted case where the thrasher can squeeze in several page faults during its timer tick, even though it spends much of the tick waiting for synchronous resolution of page faults.
- We used a twin-tailed t-test to compare the thrasher and burner scores for the 64-bit storage-rich cases. We found no statistically significant difference.
- For the 64-bit, storage-constrained, unassisted case, notice once again that the Linux guest used just a little less than half of the available CPU time. We again see the missed opportunity for CPU consumption.
- For the 64-bit, storage-constrained, PFAULT-assisted case, notice that the CPU consumption rose dramatically compared to the unassisted case. Here again we see the benefit of the assist.
- In the storage-constrained cases we sometimes found that it took a nontrivial amount of wall clock time to load and run the cpint package in the control connection, especially at the end of the experiment. This was why in some cases the recorded elapsed time was significantly longer than 10 minutes.
- We recognize that using cpint to collect our CPU time samples slightly skews the results, for the package itself uses virtual and CP time to run. We believe the skew is least severe in the storage-rich cases, because no faults happen when cpint runs. We believe the skew is most severe in the storage-constrained, asynchronous-page-fault case, because faults are happening and asynchronous faults are the most expensive ones in terms of CPU time used per fault. Here again we can reinforce the fact that using asynchronous page faults does not decrease the cost of page faults; it just gives the virtual machine an opportunity to run something else while it is waiting for CP to resolve a fault.
Discussion
It is important to realize that the goal of our experiment was to determine whether Linux would consume all of a given wall clock period as virtual CPU, if the Linux guest were known to be continuously dispatchable and if CP were able to inform the Linux guest about page fault waits. We specifically constructed our test case so that the Linux guest always had a runnable process to dispatch. We then played with our machine's real storage configuration so as to force Linux to operate in a page-fault-intensive environment. We watched how Linux responded to the notifications. We saw that Linux did in fact do other work while waiting for CP to resolve faults. We considered this result to constitute "better performance" for our experiment.
In some customer environments, asynchronous page fault resolution might hurt performance rather than help it. If the Linux workload consists of one paging-intensive application and no other runnable work, the extra CPU cost (both CP and virtual) of resolving page faults asynchronously (interrupt delivery, Linux redispatch, and so on) is incurred to no benefit. In other words, because the Linux guest has no other work to which it can switch while waiting for faults to resolve, spending the extra CPU to notify it of these opportunities is pointless and in fact wasteful. In such environments, it would be better to configure the system so that the Linux guest's faults are resolved synchronously. 1
Taking advantage of ready CPU time is not the only reason to configure a Linux system for asynchronous page faults. Improving response time is another possible benefit. If the Linux guest's workload consists of a paging-intensive application and an interactive application, resolving faults asynchronously might let the Linux guest start terminal I/Os while waiting for faults to complete. This might result in the Linux guest exhibiting faster or more consistent response time, albeit at a higher CPU utilization rate.
The bottom line here is that each customer must evaluate the asynchronous page fault technology in his specific environment. He must gather data for both the synchronous and asynchronous page fault cases, compare the two cases, decide which configuration exhibits "better performance", and then deploy accordingly.
Conclusion
PAGEX and PFAULT both give the Linux guest an opportunity to run other work while waiting for a page fault to be resolved. The Linux guest does a good job of putting that time to use. But whether the change in execution characteristics produced by asynchronous page faults constitutes "better performance" is something each customer must decide for himself.
Footnotes:
- 1
- #CP DISABLE DIAGNOSE 258 to disable PFAULT system-wide, or put "nopfault" in the Linux boot parameters to disable it for a specific guest. There is no corresponding "nopagex" parameter, but #CP SET PAGEX OFF when the Linux guest finishes IPLing is a safe way to disable PAGEX.
Back to Table of Contents.
Guest Support for FICON CTCA
z/VM (at the appropriate service level) supports FICON Channel-to-Channel communications between an IBM zSeries 900 and another z900 or an S/390 Parallel Enterprise Server G5 or G6. This enables more reliable and higher bandwidth host-to-host communication than is available with ESCON channels. Note that there are two types of FICON channels which are referred to as FICON and FICON Express. The latter has higher throughput and maximum bandwidth capability. We did not have access to FICON Express and so all references to FICON in this section refer to the former.
Methodology: This section presents and discusses measurement results that assess the performance of the FICON adapter using the support included in z/VM 4.2.0 CP, with APAR VM62906 applied, and comparing it with existing ESCON support.
The workload driver is an internal tool which can be used to simulate such bulk-data transfers as FTP or primitive benchmarks such as streaming or request-response. The data are driven from the application layer of the TCP/IP protocol stack, thus causing the entire networking infrastructure, including the adapter and the TCP/IP protocol code, to be measured. It moves data between client-side memory and server-side memory, eliminating all outside bottlenecks such as DASD or tape.
A client-server pair was used in which the client sent one byte and received 20MB of data (streaming workload) or in which the client sent 200 bytes and received 1000 bytes (request-response workload). Additional client-server pairs were added to determine if throughput would vary with an increase of number of connections.
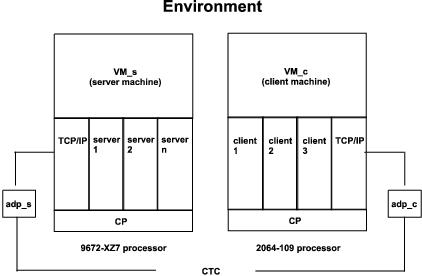 |
While collecting the performance data, it was determined that optimum streaming workload results were achieved when TCP/IP was configured with DATABUFFERPOOLSIZE set to 32760 and DATABUFFERLIMITS set to 10 for both the outbound buffer limit and the inbound buffer limit. These parameters are used to determine the number and size of buffers that may be allocated for a TCP connection that is using window scaling.
It should be noted that it is possible for monitor data to not reflect that a device is a FICON device. This can happen if the device goes offline (someone pops the card) and goes online but without the vary online command being issued. If this situation is ever encountered a vary offline followed by a vary online command will correct the situation.
Each performance run, starting with 1 client-server pair and progressing to 10 client-server pairs, consisted of starting the server(s) on VM_s and then starting the client(s) on VM_c. The client(s) received data for 400 seconds. Monitor data were collected for 330 seconds of that time period. Data were collected only on the client machine.
At least 3 measurement trials were taken for each case, and a representative trial was chosen to show in the results. A complete set of runs was done with the maximum transmission unit (MTU) set to 32760 for streaming, and to 1500 for both streaming and request-response (RR). The CP monitor data for each measurement were reduced by VMPRF.
There are multiple devices associated with a FICON channel and TCPIP can be configured to use just one device or multiple devices. Measurements were done with just one device configured for the 1, 3, 5, and 10 client-server pair runs. Measurements were then done, for comparison purposes, with one device per client-server pair. This was done by specifying a unique device number on each of 10 device statements and associating it with a unique ip address. Note that ESCON does not have the same multiplexing capability that FICON does and therefore does not benefit from this same technique.
The following charts show, for both ESCON and FICON, throughput and CPU time for the streaming and RR workloads. Each chart has a bar for each connectivity/MTU pair measured. Specific details are mentioned for each workload after the charts for that workload.
Figure 2. Throughput - Streaming
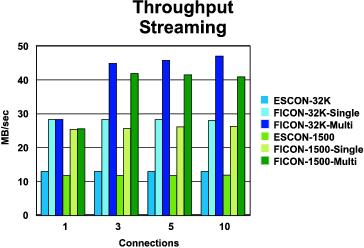 |
Throughput for all cases shows that both ESCON and FICON with a single device maintained the same throughput rate that they achieved with one connection. FICON was able to move about twice as much as ESCON. However, when one device was used per connection, the throughput was much better for both MTU sizes.
Figure 3. CPU Time - Streaming
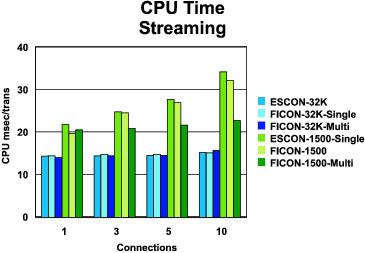 |
The corresponding CPU time, in general, shows the same pattern where time increases with each additional client/server pair. Both FICON and ESCON had approximately the same amount of CPU msec/MB for the 32K MTU case. The 1500 MTU cases showed higher CPU msec/MB with the FICON multiple device case showing higher efficiencies.
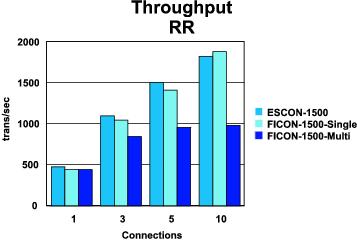 |
Throughput for all cases shows the same trend of increasing as additional connections are made. ESCON leads throughput until 10 connections, where FICON with single devices does better. Note that using multiples devices (one per connection pair) yielded poorer results than either ESCON or FICON with a single device defined.
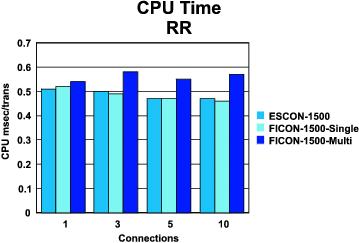 |
CPU time decreases slightly as the workload increases and the system becomes more efficient for both ESCON and FICON with a single device. This was not true for FICON with multiple devices.
Results: The results are summarized in the following tables. MB/sec (megabytes per second) or trans/sec (transactions per second) was supplied by the workload driver and shows the throughput rate. All other values are from CP monitor data or derived from CP monitor data.
Total_cpu_util | This field was obtained from the SYSTEM_SUMMARY_BY_TIME VMPRF report that shows the average of both processors out of 100%. |
tcpip_tot_cpu_util | This field is calculated from the USER_RESOURCE_UTILIZATION VMPRF report (CPU seconds, total) for the client stack (tcpip). 100% is the equivalent of one fully utilized processor. |
cpu_msec/MB | This field was calculated from the previous tot_cpu_util divided by the number of megabytes per second to show the number of milliseconds of time per megabyte. |
cpu_msec/trans | This field was calculated from the previous tot_cpu_util divided by the number of transactions per second to show the number of milliseconds of time per transaction. |
Table 1. ESCON - Streaming 32K
Number of clients runid | 01 ensf0103 | 03 ensf0302 | 05 ensf0502 | 10 ensf1002 |
|---|---|---|---|---|
MB/sec elapsed time (sec) total_cpu_util | 12.88 330.00 9.20 | 12.90 330.00 9.30 | 12.90 330.00 9.40 | 12.90 330.00 9.80 |
tcpip_tot_cpu_util tcpip_virt_cpu_util | 10.60 5.20 | 10.60 5.20 | 10.90 5.20 | 11.20 5.50 |
cpu_msec/MB emul_msec/MB cp_msec/MB | 14.29 8.85 5.43 | 14.42 8.99 5.43 | 14.57 9.15 5.43 | 15.19 9.46 5.74 |
tcpip_cpu_msec/MB tcpip_vcpu/MB tcpip_ccpu/MB | 8.23 4.00 4.23 | 8.22 3.99 4.23 | 8.46 3.99 4.46 | 8.69 4.23 4.46 |
| Note: 2064-109; z/VM 4.2.0 with 64-bit CP; TCP/IP 420; APAR VM62906 | ||||
Table 2. FICON - Streaming 32K - Single Device
Number of clients runid | 01 fnsf0103 | 03 fnsf0301 | 05 fnsf0502 | 10 fnsf1003 |
|---|---|---|---|---|
MB/sec elapsed time (sec) total_cpu_util | 28.23 330.00 20.30 | 28.26 330.00 20.80 | 28.25 330.00 20.80 | 28.00 330.00 21.10 |
tcpip_tot_cpu_util tcpip_virt_cpu_util | 23.90 11.50 | 24.20 11.80 | 24.20 11.80 | 24.50 11.80 |
cpu_msec/MB emul_msec/MB cp_msec/MB | 14.38 9.07 5.31 | 14.72 9.20 5.52 | 14.73 9.27 5.45 | 15.07 9.50 5.57 |
tcpip_cpu_msec/MB tcpip_vcpu_msec/MB tcpip_ccpu_msec/MB | 8.48 4.08 4.40 | 8.58 4.18 4.40 | 8.58 4.18 4.40 | 8.77 4.22 4.55 |
| Note: 2064-109; z/VM 4.2.0 with 64-bit CP; TCP/IP 420; APAR VM62906 | ||||
Table 3. FICON - Streaming 32K - Multiple Devices
Number of clients runid | 01 fjsx0102 | 03 fjsx0301 | 05 fjsx0501 | 10 fjsx1003 |
|---|---|---|---|---|
MB/sec elapsed time (sec) total_cpu_util | 28.25 330.00 19.80 | 44.93 330.00 32.30 | 45.78 330.00 33.40 | 47.02 330.00 36.80 |
tcpip_tot_cpu_util tcpip_virt_cpu_util | 22.70 11.20 | 37.30 18.20 | 38.80 18.80 | 43.00 20.70 |
cpu_msec/MB emul_msec/MB cp_msec/MB | 14.02 8.78 5.24 | 14.38 9.04 5.34 | 14.59 9.17 5.42 | 15.65 9.83 5.83 |
tcpip_cpu_msec/MB tcpip_vcpu_msec/MB tcpip_ccpu_msec/MB | 8.05 3.97 4.08 | 8.30 4.05 4.25 | 8.47 4.10 4.37 | 9.15 4.40 4.75 |
| Note: 2064-109; z/VM 4.2.0 with 64-bit CP; TCP/IP 420; APAR VM62906 | ||||
FICON shows more than twice the throughput as ESCON when using a single device for FICON. When multiple devices are defined, FICON shows more than four times improvement.
Table 4. ESCON - Streaming 1500
Number of clients runid | 01 essf0103 | 03 essf0303 | 05 essf0503 | 10 essf1001 |
|---|---|---|---|---|
MB/sec elapsed time (sec) total_cpu_util | 11.78 330.00 12.80 | 11.78 330.00 14.60 | 11.77 330.00 16.30 | 11.87 330.00 20.30 |
tcpip_tot_cpu_util tcpip_virt_cpu_util | 17.30 11.50 | 18.50 12.40 | 20.00 13.00 | 22.70 14.50 |
cpu_msec/MB emul_msec/MB cp_msec/MB | 21.73 15.79 5.94 | 24.79 18.00 6.79 | 27.70 20.05 7.65 | 34.20 24.77 9.44 |
tcpip_cpu_msec/MB tcpip_vcpu_msec/MB tcpip_ccpu_msec/MB | 14.66 9.78 4.89 | 15.69 10.55 5.14 | 16.99 11.07 5.92 | 19.15 12.25 6.89 |
| Note: 2064-109; z/VM 4.2.0 with 64-bit CP; TCP/IP 420; APAR VM62906 | ||||
Table 5. FICON - Streaming 1500 - Single Device
Number of clients runid | 01 fssf0101 | 03 fssf0302 | 05 fssf0503 | 10 fssf1003 |
|---|---|---|---|---|
MB/sec elapsed time (sec) total_cpu_util | 25.35 300.00 25.00 | 25.69 300.00 31.50 | 26.07 330.00 35.10 | 26.25 330.00 42.10 |
tcpip_tot_cpu_util tcpip_virt_cpu_util | 34.30 23.70 | 39.70 26.70 | 42.40 28.20 | 47.90 30.90 |
cpu_msec/MB emul_msec/MB cp_msec/MB | 19.72 14.44 5.29 | 24.52 17.98 6.54 | 26.93 19.79 7.13 | 32.08 23.39 8.69 |
tcpip_cpu_msec/MB tcpip_vcpu_msec/MB tcpip_ccpu_msec/MB | 13.54 9.34 4.21 | 15.45 10.38 5.07 | 16.27 10.81 5.46 | 18.24 11.77 6.46 |
| Note: 2064-109; z/VM 4.2.0 with 64-bit CP; TCP/IP 420; APAR VM62906 | ||||
Table 6. FICON - Streaming 1500 - Multiple Devices
Number of clients runid | 01 fssx0102 | 03 fssx0301 | 05 fssx0502 | 10 fssx1002 |
|---|---|---|---|---|
MB/sec elapsed time (sec) total_cpu_util | 25.44 330.00 26.10 | 41.85 330.00 43.50 | 41.46 330.00 44.80 | 40.92 330.00 46.40 |
tcpip_tot_cpu_util tcpip_virt_cpu_util | 35.80 24.50 | 60.00 40.70 | 61.20 40.90 | 62.70 41.50 |
cpu_msec/MB emul_msec/MB cp_msec/MB | 20.52 14.86 5.66 | 20.79 15.01 5.78 | 21.61 15.53 6.08 | 22.68 16.18 6.50 |
tcpip_cpu_msec/MB tcpip_vcpu_msec/MB tcpip_ccpu_msec/MB | 14.17 9.65 4.53 | 14.34 9.72 4.62 | 14.76 9.87 4.90 | 15.33 10.15 5.18 |
| Note: 2064-109; z/VM 4.2.0 with 64-bit CP; TCP/IP 420; APAR VM62906 | ||||
Number of clients runid | 01 esrf0101 | 03 esrf0301 | 05 esrf0503 | 10 esrf1003 |
|---|---|---|---|---|
trans/sec elapsed time (sec) total_cpu_util | 476.89 330.00 12.20 | 1096.80 330.00 27.20 | 1505.14 330.00 35.60 | 1824.48 330.00 42.80 |
tcpip_tot_cpu_util tcpip_virt_cpu_util | 12.40 6.40 | 25.80 13.00 | 32.40 16.70 | 37.30 19.40 |
cpu_msec/trans emul_msec/trans cp_msec/trans | 0.51 0.34 0.18 | 0.50 0.33 0.16 | 0.47 0.32 0.15 | 0.47 0.33 0.14 |
tcpip_cpu_msec/trans tcpip_vcpu_msec/trans tcpip_ccpu_msec/trans | 0.26 0.13 0.13 | 0.23 0.12 0.12 | 0.22 0.11 0.10 | 0.20 0.11 0.10 |
| Note: 2064-109; z/VM 4.2.0 with 64-bit CP; TCP/IP 420; APAR VM62906 | ||||
Table 8. FICON - RR 1500 - Single Device
Number of clients runid | 01 fsrf0102 | 03 fsrf0301 | 05 fsrf0502 | 10 fsrf1002 |
|---|---|---|---|---|
trans/sec elapsed time (sec) total_cpu_util | 437.71 330.00 11.40 | 1042.70 330.00 25.30 | 1412.47 300.00 33.20 | 1881.99 330.00 43.20 |
tcpip_tot_cpu_util tcpip_virt_cpu_util | 11.50 5.80 | 24.20 12.40 | 30.30 15.70 | 37.90 19.70 |
cpu_msec/trans emul_msec/trans cp_msec/trans | 0.52 0.33 0.19 | 0.49 0.33 0.16 | 0.47 0.32 0.15 | 0.46 0.32 0.14 |
tcpip_cpu_msec/trans tcpip_vcpu_msec/trans tcpip_ccpu_msec/trans | 0.26 0.13 0.13 | 0.23 0.12 0.11 | 0.21 0.11 0.10 | 0.20 0.10 0.10 |
| Note: 2064-109; z/VM 4.2.0 with 64-bit CP; TCP/IP 420; APAR VM62906 | ||||
Table 9. FICON - RR 1500 - Multiple devices
Number of clients runid | 01 fsrx0102 | 03 fsrx0301 | 05 fsrx0502 | 10 fsrx1001 |
|---|---|---|---|---|
trans/sec elapsed time (sec) total_cpu_util | 437.07 300.00 11.90 | 841.23 330.00 24.30 | 956.42 330.00 26.30 | 978.30 330.00 27.80 |
tcpip_tot_cpu_util tcpip_virt_cpu_util | 11.70 6.00 | 23.60 12.80 | 26.30 13.30 | 27.30 13.90 |
cpu_msec/trans emul_msec/trans cp_msec/trans | 0.54 0.35 0.20 | 0.58 0.39 0.19 | 0.55 0.36 0.19 | 0.57 0.38 0.19 |
tcpip_cpu_msec/trans tcpip_vcpu_msec/trans tcpip_ccpu_msec/trans | 0.28 0.14 0.14 | 0.28 0.14 0.14 | 0.28 0.14 0.14 | 0.28 0.14 0.14 |
| Note: 2064-109; z/VM 4.2.0 with 64-bit CP; TCP/IP 420; APAR VM62906 | ||||
With the smaller amounts of data being transferred, the RR workload favors ESCON with FICON single device being similar. TCPIP uses a 32K buffer when transferring data over CTC and this is most likely the reason that the RR workload did not benefit from using multiple devices.
Back to Table of Contents.
DDR LZCOMPACT Option
A new LZCOMPACT option can now be specified on the output I/O definition control statement when using DDR to dump to tape. This provides an alternative to the compression algorithm used by the existing COMPACT option. Unlike the COMPACT option, the data compression done when the LZCOMPACT option is specified can make use of the hardware compression facility to greatly reduce the amount of processing required for compression (DUMP) and decompression (RESTORE). This section summarizes the results of a performance evaluation of the DDR LZCOMPACT option.
Two separate system configurations were used to collect DDR
measurement data. The first configuration consisted of a 2064-109 with
2 dedicated processors, 1G central storage, and 2G expanded storage. The
second configuration consisted of a 9672-R86 with 8 shared processors,
2G central storage, and 1G expanded storage. Two different tape drives
were used: 3590 and 3480 with autoloaders. A typical VM system
residence volume on 3390 was used for the dumps and restores. Multiple
measurements were run in each environment to verify repeatability. CP
QUERY TIME and CP INDICATE USER data were collected for each
measurement.
Table 1. DDR Dump to 3590 Tape: 9672-R86 and 2064-109
Processor Model Compression Type | 9672-R86 NONE | 9672-R86 COMPACT | 9672-R86 LZCOMP | 2064-109 NONE | 2064-109 COMPACT | 2064-109 LZCOMP |
|---|---|---|---|---|---|---|
Elapsed Time Total CPU Time CP CPU Time Virtual CPU Time Virtual I/Os Compression Ratio Tapes Required | 1299 9.81 9.26 0.55 100185 1.00 1 | 1256 103.85 8.07 95.78 100185 2.29 1 | 1352 204.98 8.26 196.72 100185 2.50 1 | 1291 3.73 3.56 0.16 100185 1.00 1 | 1253 48.38 3.00 45.38 100185 2.29 1 | 1174 34.11 2.92 31.19 100185 2.50 1 |
| Note: z/VM 4.2.0; all times are in seconds | ||||||
The LZCOMPACT option reduced elapsed time in the 2064-108 case by 6% as compared to using the COMPACT option. A reduction of 29% was also observed for total CPU time. This was due to hardware compression on the 2064-109. By contrast, CPU time increased on the 9672-R86, which does not have hardware compression.
Another benefit of the LZCOMPACT option was a 9% improvement in the data compression ratio, which reduces tape requirements. We observed an average 10% saving in tape length used per volume when using LZCOMPACT as compared to the COMPACT option, based on DDR DUMP results for a sample of 8 different DASD volumes. The savings ranged from 1% to 28%.
Note that use of the DDR compression options did not affect the
number of I/Os issued by DDR. This is the reason why DDR compression
has rather small effects on elapsed time. The amount of data
transferred per I/O decreases, but this reduces I/O time only slightly
because much of the delay per I/O is independent of the amount of data
being transferred.
Table 2. DDR Restore from 3590/3480: 2064-109
Tape Type Compression Type | 3590 NONE | 3590 COMPACT | 3590 LZCOMP | 3480 NONE | 3480 COMPACT | 3480 LZCOMP |
|---|---|---|---|---|---|---|
Elapsed Time Total CPU Time CP CPU Time Virtual CPU Time Virtual I/Os Tapes Required | 988 4.71 4.51 0.20 147659 1 | 996 55.99 3.79 52.20 100828 1 | 981 10.75 3.79 6.96 101364 1 | 1975 4.67 4.47 0.20 147691 11 | 1194 56.04 3.84 52.20 100836 3 | 1169 10.86 3.84 7.02 101372 3 |
| Note: z/VM 4.2.0; all times are in seconds | ||||||
Use of the LZCOMPACT option reduced total CPU time required to do the DDR restore by 81% relative to use of the COMPACT option, due to the use of hardware decryption on the 2064-109 processor. In the 3590 case, this had no appreciable effect on elapsed time because the restore was I/O-bound and there were no unload/rewind delays since only one tape was involved. In the 3480 case, elapsed time with either compression option reduced elapsed time substantially relative to the no compression case because there were fewer tapes to unload and rewind.
Back to Table of Contents.
IMAP Server
The Internet Message Access Protocol (IMAP) server, based on RFC 2060, permits a client email program to access remote message folders (called "mailboxes") as if they were local. IMAP's ability to access messages (both new and saved) from more than one computer has become more important as reliance on electronic messaging and use of multiple computers increase. The protocol includes operations for creating, deleting and renaming mailboxes; checking for new messages; permanently removing messages; setting and clearing flags; server-based parsing and searching; and selective fetching of message attributes, texts, and portions thereof for efficiency.TCP/IP level 420, with z/VM 4.2.0, now supports the IMAP server. This section summarizes the results of a performance evaluation of this support.
Methodology: An internal CMS tool was used to simulate user load against an IMAP mail server using custom scripts. The scripts were staggered by using a uniformly distributed random number between 100 and 500 seconds to distribute the load evenly over a one-hour period.
Each simulated client, after logging in, checks its inbox for new messages six times (once at the end of each random period). Each time the inbox is checked, the client downloads five message headers from the inbox, reads those five messages, and then deletes one message. After the sixth iteration, the simulated user logs out and sends a new message (through SMTP). Each instance of sending a request to the IMAP server and receiving a response is considered a transaction. More specifically, a transaction is defined as each request issued by the internal tool to the IMAP server. For example; LOGIN, list INBOX, SELECT, UID fetch are transactions or requests sent to the IMAP server. Each simulated user issues 59 transaction requests to the IMAP server during each measurement run.
All measurements were done on a 2064-109 in an LPAR with 2 dedicated processors. The LPAR had 1GB central storage and 2GB expanded storage. All clients, the IMAP server, SFS server, and TCPIP stack ran on the same LPAR. APAR PQ54859 was applied to the IMAP server because it contained a fix to thread priority that impacted the performance. SFS ran with 504 agents, ensuring that the number of SFS agents was always greater than the number of IMAP threads. Response times were captured by the internal tool and CP monitor data was captured once the workload had reached a steady-state. The CP monitor data was then reduced using VMPRF. Data for SFS and TCP/IP is also shown but the focus is on what we see the IMAP server doing.
Throughput and Response Time Results: The throughput and response time results are summarized in Figure 1 and Figure 2.
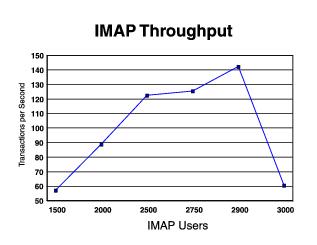 |
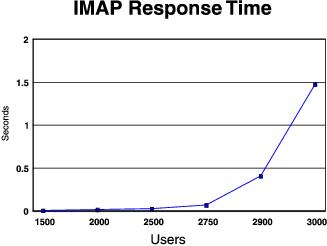 |
The graphs show that response times are good until about 2900 users, when response times begin to rise sharply and transactions per second drop. At 3000 users the IMAP server is either running or waiting on the CPU for almost 90% of the time. So the primary constraint is due to IMAP only being able to run on a single processor at a time.
Detailed Results: The following tables give further detail for each of the measurements. All of the fields were obtained from the workload driver or derived from the CP monitor data, except IMAP threads which was obtained from the IMAP administration command IMAPADM servername STATS. Following is an explanation for each field.
trans/sec (est) | Transactions per second was estimated from monitor data records which show message traffic from TCPIP to the IMAP server. This value was compared to the value reported by the internal tool to ensure reasonableness. This value was then divided by the elapsed time shown in the VMPRF report. |
Response time (driver) | The workload driver kept track of the time elapsed for each transaction request issued to the IMAP server and reported the average transaction time at the end of the run. |
Total CPU Utilization | This field was obtained from the SYSTEM_SUMMARY_BY_TIME VMPRF report that shows the average of both processors. |
IMAP CPU Utilization | This field is calculated from the IMAP entry in the USER_RESOURCE_UTILIZATION VMPRF report. |
IMAP tot CPU msec/trans | This field was calculated from two of the previous fields (IMAP CPU Utilization divided by transactions per second) to show the number of IMAP milliseconds of time to transaction ratio. |
IMAP virt CPU msec/trans | This field is calculated in the same manner as IMAP total CPU msec/trans, using virtual CPU seconds for the IMAP server. |
IMAP CP CPU msec/trans | This is the difference of total CPU msec/trans less virtual CPU msec/trans yielding the time spent in CP on IMAP's behalf. |
SFS CPU Utilization | This field is calculated in the same manner as IMAP CPU Utilization, using the SFS entry in the USER_RESOURCE_UTILIZATION VMPRF report. |
SFS tot CPU msec/trans | See IMAP tot CPU msec/trans. |
SFS virt CPU msec/trans | See IMAP virt CPU msec/trans. |
TCPIP CPU Utilization | See IMAP tot CPU Utilization. |
TCPIP tot CPU msec/trans | See IMAP tot CPU msec/trans. |
TCPIP virt CPU msec/trans | See IMAP virt CPU msec/trans. |
Number of IMAP threads | This number was obtained from the IMAP administration command IMAPADM, specifying the STATS option. |
SFS sec per filepool req | Total Time Per File Pool Request field in SFS_BY_TIME VMPRF report. |
SFS request per trans | Calculated by dividing FPR count from SFS_BY_TIME by Total Msgs from TCPIP to IMAP from USER_TO_USER_VMCOMM VMPRF report. |
Table 1. IMAP Measurement Results
IMAP Clients Run ID | 1500 I50030z3 | 2000 I50040z2 | 2500 I50050z3 | 2750 I50055z2 | 2900 I50058z1 | 3000 I50060ze |
|---|---|---|---|---|---|---|
trans/sec (est) Response time (driver) trans/sec/user Total CPU Utilization | 57.38 0.01 0.04 20.9 | 89.07 0.02 0.04 30.6 | 122.57 0.03 0.05 40.2 | 125.53 0.07 0.05 47.6 | 182.58 0.41 0.06 52.5 | 60.75 1.48 0.02 53.0 |
IMAP CPU Utilization IMAP tot CPU msec/trans IMAP virt CPU msec/trans IMAP CP CPU msec/trans Number of IMAP threads | 26.59 4.63 4.33 0.30 5 | 41.01 4.61 4.34 0.26 5 | 56.59 4.62 4.39 0.23 10 | 67.39 5.41 5.16 0.25 37 | 75.58 4.14 3.95 0.19 30 | 77.07 12.69 12.08 0.60 45 |
SFS CPU Utilization SFS tot CPU msec/trans SFS virt CPU msec/trans SFS CP CPU msec/trans SFS sec per filepool req SFS requests per trans | 2.22 0.39 0.22 0.17 0.001 1.75 | 2.83 0.32 0.19 0.13 0.001 1.42 | 3.41 0.28 0.17 0.11 0.001 1.22 | 3.89 0.31 0.18 0.13 0.001 1.31 | 4.25 0.23 0.14 0.09 0.001 0.96 | 4.47 0.74 0.46 0.27 0.000 2.82 |
TCPIP CPU Utilization TCPIP tot CPU msec/trans TCPIP virt CPU msec/trans TCPIP CP CPU msec/trans | 2.78 0.48 0.29 0.19 | 3.70 0.42 0.26 0.16 | 4.28 0.35 0.21 0.14 | 5.16 0.41 0.30 0.15 | 5.50 0.30 0.19 0.11 | 5.13 0.85 0.49 0.35 |
| Note: 2064-109; z/VM 4.2.0 with 64-bit CP; TCP/IP 420; IMAP with APAR PQ54859 | ||||||
SFS requests are mostly asynchronous and SFS response time is even for all measurements (even the 3000 user case). Therefore SFS is not a factor in the IMAP server response time.
Total CPU utilization shown includes activity in the IMAP clients as well as IMAP, TCPIP and SFS.
The IMAP server scales well to 2500 users. CPU msec/trans stays steady until after 2500 users. It increases slightly at 2750 users and begins to become unstable at 2900 users. By 3000 users the IMAP server cannot keep up with the requests coming in and the backlog affects the response time seen by the client dramatically.
Back to Table of Contents.
Additional Evaluations
This section includes results from additional z/VM and z/VM platform performance measurement evaluations that have been conducted during the z/VM 4.2.0 time frame.
Back to Table of Contents.
Linux Connectivity Performance
Purpose
In this experiment we sought to compare and contrast the networking performance experienced by two Linux guests running on one instance of z/VM 4.2.0, communicating with one another over each of these communication technologies: 1
- Virtual CTC
- OSA Express Gigabit Ethernet, operating in Queued Direct I/O (QDIO) mode
- VM Guest LAN
- HiperSockets
We sought to measure the performance of these configurations under the pressure of three distinct kinds of networking workloads, with the following attendant performance metrics for each workload:
- We use the term request-response (RR) to describe data exchange like what usually happens in interactive environments -- that is, long-running transport connections with small amounts of data being exchanged in a conversational way. For this workload, "networking performance" means transactions per wall clock second and CPU time consumed per transaction.
- By connect-request-response (CRR) we mean the data exchange that usually happens with HTTP servers -- that is, a connection starts, a small amount of data flows in, a moderate amount flows out, and the connection then ends. Here, we're also interested in transactions per wall clock second and CPU time consumed per transaction.
- In a streaming get (STRG) transaction, the connection is persistent, just as in RR. However, the data sent in one direction is very small -- just a few bytes -- and the data sent in the other direction is very large -- 20 MB. This scenario illustrates the best-case rate at which the computing system can pump data across a communication link. In this environment, what interests us are megabytes per wall clock second and CPU time used per megabyte sent.
One environmental consideration that affects networking performance is the number of concurrent connections the two Linux guests are working between them. For example, efficiencies in interrupt handling might be experienced if the two guests have twenty, thirty, or fifty "file downloads" in progress between them simultaneously. We crafted our experiments so that we could assess the impact of the number of concurrent data streams on networking performance. We achieved concurrent data streams by running our benchmarking tool in multiple Linux processes simultaneously, with exactly one connection between each pair of processes. Because of this configuration, we call the number of concurrent data streams the "number of concurrent users", or more simply, just the "number of users".
One other parameter that is known to affect networking performance is a communication link's Maximum Transmission Unit size, or MTU size. This size, expressed in bytes, is the size of the largest frame the communication hardware will "put on the wire". Typical sizes range from 1,500 bytes to 56 KB. We configured our experiments so that we could assess the effect of MTU size on networking performance.
Hardware
2064-109, LPAR with two dedicated CPUs, 1 GB real, 2 GB XSTORE, LPAR dedicated to these experiments. This processor contained the microcode necessary to support HiperSockets. It was also equipped with an OSA Express Gigabit Ethernet card. The rest of the networking devices are virtualized by z/VM CP.
Software
z/VM 4.2.0, with APAR VM62938 ("the HiperSockets APAR") applied. One z/VM fix relevant to QDIO, VM63034, was also applied.
For Linux, we used an internal 2.4.7-level development driver. The qdio.o and qeth.o (HiperSockets and QDIO drivers) we used were the 2.4.7 drivers IBM made available on DeveloperWorks in early February 2002. The Linux virtual machines were 512 MB in size and were virtual uniprocessors.
To produce the network loads, we used an IBM internal tool that can induce RR, CRR, and STRG workloads for selected periods of time. The tool is able to record the transaction rates and counts it experiences during the run.
Method
We defined an experiment as a measurement run that uses a particular transaction type, communication link type, MTU size, and number of users.
For each experiment, we brought up two Linux guests, connecting them by one of the device types under study. Using ifconfig, we set the communication link's MTU size to the desired value. We then ran the network load tool, specifying the kind of workload to simulate, the number of users, and the number of seconds to run the workload. The tool runs the workload for at least the specified number of seconds, and perhaps a little longer if needed to get to the end of its sample.
To collect resource consumption information, we used before-and-after invocations of several CP QUERY commands. The network load tool produced log files that recorded the transaction rates and counts it experienced.
The following sections define the experiments we ran.
OSA Express Gigabit Ethernet in QDIO Mode:
- RR
- We defined one transaction to be 200 bytes sent from Linux A to Linux B, then 1000 bytes sent from B to A.
- We ran each experiment for 600 seconds.
- We used MTU sizes 1500 and 9000.
- We used 1, 10, 20, and 50 users.
- CRR
- We defined one transaction to be connecting from Linux A to Linux B, sending 64 bytes from A to B, sending 8192 bytes from B to A, then disconnecting.
- We ran each experiment for 600 seconds.
- We used MTU sizes 1500 and 9000.
- We used 1, 10, 20, and 50 users.
- STRG
- We defined one transaction to be sending 20 bytes from Linux A to Linux B, then sending 20 MB from B to A.
- We ran each experiment for 600 seconds.
- We used MTU sizes 1500 and 9000.
- We used 1, 10, 20, and 50 users.
HiperSockets and VM Guest LAN: Same as OSA Express Gigabit Ethernet, except we used MTU sizes 8192, 16384, 32768, and 57344 for all experiments.
Virtual CTC: Same as OSA Express Gigabit Ethernet, except we used MTU sizes 1500 and 8192 for the RR and CRR experiments, and we used MTU sizes 1500, 8192, and 32760 for the STRG experiment.
Comparisons
In this section we compare results across device types, using graphs and tables to illustrate the key findings.
RR Performance Comparison: The graphs in Figure 1 and Figure 2 compare the results of our RR runs across all device types. A summary of key findings follows the illustrations.
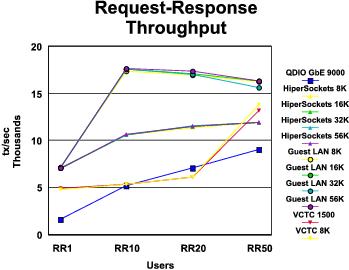 |
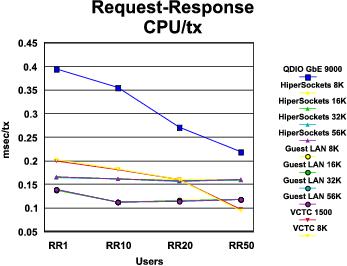 |
Some comments on the graphs:
- Largely speaking, VM guest LAN showed the best transaction rate and lowest transaction cost across all MTU sizes and numbers of users. An exception was the VCTC result for RR50.
- MTU size is clearly not a factor in transaction rate or transaction cost. This makes sense because the transaction sizes we are using are smaller than the smallest MTU size we measured.
Table 1 gives more information on the best RR
results achieved on each device type.
Table 1. Maximum Throughput: Request-Response
Device type MTU size Number of clients Run ID | QDIO GBE 9000 50 NMGBR950 | HIPER 57344 50 NMHIR550 | GUEST 57344 10 NMGLR510 | vCTC 8192 50 NMVCR850 |
|---|---|---|---|---|
MB/sec trans/sec response time (msec) elapsed time (sec) | 10.39 9077.29 0.01 632.00 | 13.65 11926.76 0.00 631.00 | 20.19 17645.51 0.00 603.00 | 15.81 13812.07 0.00 625.00 |
total_LPAR_util virtual_LPAR_util CP_LPAR_util | 96.76 45.62 51.14 | 93.34 45.83 47.50 | 98.27 60.33 37.94 | 64.00 46.65 17.35 |
client_tot_LPAR_util client_virt_LPAR_util client_cp_LPAR_util | 48.40 23.16 25.24 | 47.10 23.37 23.73 | 48.98 30.11 18.87 | 31.77 23.69 8.08 |
server_tot_LPAR_util server_virt_LPAR_util server_cp_LPAR_util | 48.36 22.46 25.90 | 46.24 22.47 23.77 | 49.29 30.22 19.07 | 32.23 22.96 9.27 |
total_cpu_msec/trans total_vcpu_msec/trans total_ccpu_msec/trans | 0.22 0.10 0.12 | 0.16 0.08 0.08 | 0.11 0.07 0.04 | 0.09 0.07 0.03 |
client_cpu_msec/trans client_vcpu_msec/trans client_ccpu_msec/trans | 0.11 0.05 0.06 | 0.08 0.04 0.04 | 0.06 0.03 0.02 | 0.05 0.03 0.01 |
server_cpu_msec/trans server_vcpu_msec/trans server_ccpu_msec/trans | 0.11 0.05 0.06 | 0.08 0.04 0.04 | 0.06 0.03 0.02 | 0.05 0.03 0.01 |
| Note: 2064-109; z/VM 4.2.0 with 64-bit CP; Linux 2.4.7. Utilization numbers are percentages of the LPAR. | ||||
Some comments on the table:
- Total LPAR utilization for the Gigabit Ethernet, HiperSockets, and VM guest LAN devices is about what we expected. However, the virtual CTC case is much lower than we expected.
- Virtual CTC was cheapest in CPU time per transaction, both in virtual time and CP time, the margin in CP time per transaction being particularly notable.
- The completely virtualized devices tended to use less CP CPU time per transaction than the real devices.
CRR Performance Comparison: The graphs in Figure 3 and Figure 4 compare the results of our CRR runs across all device types. A summary of key findings follows the illustrations.
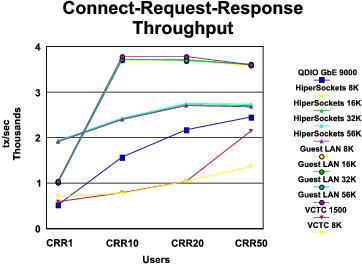 |
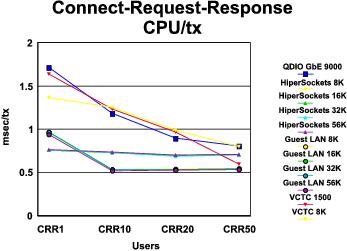 |
Some comments on the graphs:
- VM guest LAN showed the best transaction rate and lowest transaction cost, across all MTU sizes, except for the one-user case.
- MTU size is clearly not a factor in transaction rate or transaction cost.
Table 2 gives more information on the best CRR
results achieved on each device type.
Table 2. Maximum Throughput: Connect-Request-Response
Device type MTU size Number of clients runid | QDIO GBE 9000 50 NMGBC950 | HIPER 32768 20 NMHIC320 | GUEST 57344 20 NMGLC520 | vCTC 1500 50 NMVCC150 |
|---|---|---|---|---|
MB/sec trans/sec response time (msec) elapsed time (sec) | 19.35 2457.53 0.02 631.00 | 21.67 2751.77 0.01 614.00 | 29.84 3789.82 0.01 608.00 | 16.94 2151.78 0.02 637.00 |
total_LPAR_util virtual_LPAR_util CP_LPAR_util | 97.08 47.81 49.27 | 94.48 43.76 50.73 | 99.06 59.58 39.48 | 62.07 42.92 19.14 |
client_tot_LPAR_util client_virt_LPAR_util client_CP_LPAR_util | 48.52 23.76 24.77 | 45.61 21.70 23.91 | 49.59 28.80 20.80 | 30.02 21.21 8.82 |
server_tot_LPAR_util server_virt_LPAR_util server_CP_LPAR_util | 48.56 24.06 24.50 | 48.87 22.06 26.82 | 49.47 30.79 18.68 | 32.04 21.72 10.32 |
total_cpu_msec/trans total_vcpu_msec/trans total_ccpu_msec/trans | 0.81 0.40 0.41 | 0.69 0.32 0.37 | 0.53 0.32 0.21 | 0.60 0.41 0.18 |
client_cpu_msec/trans client_vcpu_msec/trans client_ccpu_msec/trans | 0.40 0.20 0.21 | 0.33 0.16 0.18 | 0.26 0.15 0.11 | 0.29 0.20 0.08 |
server_cpu_msec/trans server_vcpu_msec/trans server_ccpu_msec/trans | 0.40 0.20 0.20 | 0.36 0.16 0.20 | 0.26 0.16 0.10 | 0.31 0.21 0.10 |
| Note: 2064-109; z/VM 4.2.0 with 64-bit CP; Linux 2.4.7. Utilization numbers are percentages of the LPAR. | ||||
Some comments on the table:
- Once again, total LPAR utilization for the Gigabit Ethernet, HiperSockets, and VM guest LAN devices is about what we expected. However, the virtual CTC case is much lower than we expected.
- Once again, the completely virtualized devices tended to use less CP CPU time per transaction than the real devices.
STRG Performance Comparison: The graphs in Figure 5 and Figure 6 compare the results of our STRG runs across all device types. A summary of key findings follows the illustrations.
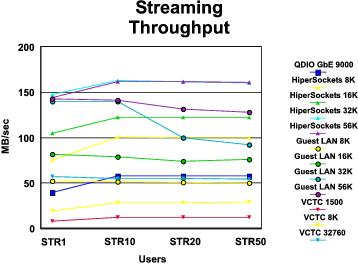 |
Figure 6. STRG CPU Consumption
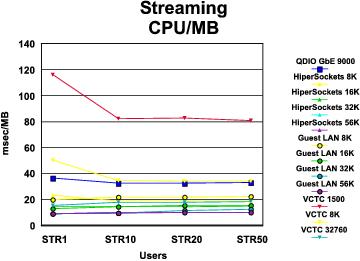 |
Some comments on the graphs:
- Every device type except VM guest LAN sustained its data rate as number of users increased.
- MTU size is clearly a factor here. Every device type "did better" (higher data rate and lower cost per MB) with a larger MTU size than with a smaller one.
- HiperSockets with large MTU (32 KB or greater) showed the best data rate. Guest LAN showed the lowest cost per MB, but its data rate was not as good.
Table 3 gives more information on the best STRG
results achieved on each device type.
Table 3. Maximum Throughput: Streaming
Device type MTU size Number of clients runid | QDIO GBE 9000 50 NMGBS950 | HIPER 32768 10 NMHIS310 | GUEST 57344 1 NMGLS501 | vCTC 32760 1 NMVCS301 |
|---|---|---|---|---|
MB/sec trans/sec response time (msec) elapsed time (sec) | 58.07 2.90 17.25 632.00 | 163.08 8.15 1.23 604.00 | 142.61 7.13 0.14 601.00 | 57.13 2.86 0.35 602.00 |
total_LPAR_util virtual_LPAR_util CP_LPAR_util | 93.57 41.00 52.57 | 81.57 50.05 31.51 | 64.57 46.17 18.40 | 44.07 24.37 19.70 |
client_tot_LPAR_util client_virt_LPAR_util client_CP_LPAR_util | 44.80 18.49 26.31 | 32.31 19.25 13.06 | 22.99 18.86 4.13 | 16.37 10.37 6.00 |
server_tot_LPAR_util server_virt_LPAR_util server_CP_LPAR_util | 48.77 22.51 26.26 | 49.26 30.80 18.45 | 41.58 27.31 14.27 | 27.70 14.00 13.70 |
total_cpu_msec/trans total_vcpu_msec/trans total_ccpu_msec/trans | 660.74 289.50 371.25 | 200.68 123.15 77.53 | 181.35 129.68 51.67 | 309.39 171.08 138.31 |
client_cpu_msec/trans client_vcpu_msec/trans client_ccpu_msec/trans | 316.38 130.58 185.80 | 79.49 47.36 32.13 | 64.57 52.98 11.59 | 114.93 72.79 42.15 |
server_cpu_msec/trans server_vcpu_msec/trans server_ccpu_msec/trans | 344.36 158.92 185.44 | 121.19 75.79 45.40 | 116.78 76.70 40.08 | 194.46 98.29 96.17 |
| Note: 2064-109; z/VM 4.2.0 with 64-bit CP; Linux 2.4.7. Utilization numbers are percentages of the LPAR. | ||||
Some comments on the table:
- The HiperSockets, VM guest LAN, and virtual CTC runs did not utilize the LPAR as much as we expected. For the HiperSockets case, the reason appears to be that the server Linux was loaded to capacity (notice its total LPAR utilization).
Other Observations
This section's tables record our observations for each device type. Along with each table we present a brief summary of the key findings it illustrates.
Table 4. Throughput and CPU Time: QDIO GbE
MTU Size | 1500 | 9000 |
|---|---|---|
Throughput (tx/sec) |
|
|
RR, 1 user RR, 10 users RR, 20 users RR, 50 users | 1661.09 5060.78 6905.31 9055.97 | 1667.89 5204.89 7088.82 9077.29 |
CRR, 1 user CRR, 10 users CRR, 20 users CRR, 50 users | 355.70 1062.42 1495.99 2105.42 | 522.23 1580.37 2169.64 2457.53 |
Throughput (MB/sec) |
|
|
STRG, 1 user STRG, 10 users STRG, 20 users STRG, 50 users | 25.40 35.76 35.25 37.18 | 39.35 57.61 57.75 58.07 |
CPU time (msec/tx) |
|
|
RR, 1 user RR, 10 users RR, 20 users RR, 50 users | 0.41 0.37 0.28 0.22 | 0.39 0.36 0.27 0.22 |
CRR, 1 user CRR, 10 users CRR, 20 users CRR, 50 users | 2.34 1.77 1.29 0.95 | 1.72 1.19 0.90 0.81 |
CPU time (msec/MB) |
|
|
STRG, 1 user STRG, 10 users STRG, 20 users STRG, 50 users | 66.24 52.09 53.46 51.79 | 36.75 32.70 32.81 33.04 |
| Note: 2064-109; z/VM 4.2.0 with 64-bit CP; Linux 2.4.7 | ||
Referring to Table 4, we see:
- The Gigabit Ethernet card gave its best RR performance for the largest number of users we measured. This is expected, because the operating systems' interactions with the adapter carry traffic for multiple users simultaneously, and the cost of these interactions is generally fixed.
- We also see that the card's best CRR performance was obtained for the largest number of users we measured. The same reasoning holds. Note also that the card's CRR performance improved under the influence of a larger MTU size. We did not expect this. We can only speculate that there is something about starting a TCP connection that benefits from an MTU size greater than 1500 bytes.
- We saw that the card's STRG performance peaked quickly, somewhere between 1 and 10 users, and stayed comparatively flat beyond that. Once again, the larger MTU size gives benefit, and this is to be expected.
Table 5. Throughput and CPU Time: Hipersockets
MTU Size | 8192 | 16384 | 32768 | 57344 |
|---|---|---|---|---|
Throughput (tx/sec) |
|
|
|
|
RR, 1 user RR, 10 users RR, 20 users RR, 50 users | 7064.64 10611.77 11350.74 11941.14 | 7050.26 10623.43 11510.30 11922.86 | 7108.46 10625.03 11579.20 11917.49 | 7040.16 10637.53 11502.21 11926.76 |
CRR, 1 user CRR, 10 users CRR, 20 users CRR, 50 users | 1933.65 2419.15 2705.89 2698.36 | 1926.13 2417.73 2716.80 2704.51 | 1937.76 2430.55 2751.77 2736.67 | 1912.99 2400.68 2705.35 2681.10 |
Throughput (MB/sec) |
|
|
|
|
STRG, 1 user STRG, 10 users STRG, 20 users STRG, 50 users | 75.31 100.54 100.28 100.18 | 105.01 122.31 122.36 122.55 | 147.88 163.08 161.75 160.67 | 144.16 161.63 161.93 160.78 |
CPU time (msec/tx) |
|
|
|
|
RR, 1 user RR, 10 users RR, 20 users RR, 50 users | 0.17 0.16 0.16 0.16 | 0.17 0.16 0.16 0.16 | 0.17 0.16 0.16 0.16 | 0.17 0.16 0.16 0.16 |
CRR, 1 user CRR, 10 users CRR, 20 users CRR, 50 users | 0.76 0.73 0.70 0.71 | 0.76 0.73 0.70 0.71 | 0.76 0.73 0.69 0.70 | 0.77 0.74 0.70 0.71 |
CPU time (msec/MB) |
|
|
|
|
STRG, 1 user STRG, 10 users STRG, 20 users STRG, 50 users | 23.11 18.84 18.93 19.11 | 14.46 14.71 14.73 14.80 | 9.16 10.03 10.12 10.24 | 9.23 10.09 10.10 10.23 |
| Note: 2064-109; z/VM 4.2.0 with 64-bit CP; Linux 2.4.7 | ||||
- RR transaction rate does not change with MTU, and it increases with number of users. This is to be expected. Notice also that the cost (CPU time) per transaction is flat with respect to MTU and number of users.
- The aforementioned trends for RR are present in the CRR results too.
- For STRG, data rate levels off somewhere between 1 and 10 users. Larger MTU size definitely helps data rate, except that beyond an MTU size of 32 KB, little if anything is gained. Number of users affects CPU per MB very little. MTU size helps CPU per MB quite a bit.
Table 6. Throughput and CPU Time: VM Guest LAN
MTU Size | 8192 | 16384 | 32768 | 57344 |
|---|---|---|---|---|
Throughput (tx/sec) |
|
|
|
|
RR, 1 user RR, 10 users RR, 20 users RR, 50 users | 7143.14 17383.95 16973.18 16260.21 | 7158.43 17616.71 17096.34 16317.72 | 7131.47 17587.34 17058.12 15657.67 | 7113.95 17645.51 17370.70 16361.98 |
CRR, 1 user CRR, 10 users CRR, 20 users CRR, 50 users | 1022.65 3696.07 3681.89 3584.21 | 1014.48 3706.91 3709.61 3605.35 | 1016.26 3720.78 3703.86 3612.12 | 1042.89 3779.70 3789.82 3605.05 |
Throughput (MB/sec) |
|
|
|
|
STRG, 1 user STRG, 10 users STRG, 20 users STRG, 50 users | 52.59 51.56 50.84 50.06 | 81.77 79.03 74.11 76.07 | 139.87 139.71 99.69 92.03 | 142.61 141.50 131.38 127.75 |
CPU time (msec/tx) |
|
|
|
|
RR, 1 user RR, 10 users RR, 20 users RR, 50 users | 0.14 0.11 0.12 0.12 | 0.14 0.11 0.11 0.12 | 0.14 0.11 0.12 0.12 | 0.14 0.11 0.11 0.12 |
CRR, 1 user CRR, 10 users CRR, 20 users CRR, 50 users | 0.96 0.54 0.54 0.55 | 0.97 0.53 0.54 0.54 | 0.97 0.53 0.54 0.54 | 0.94 0.52 0.53 0.54 |
CPU time (msec/MB) |
|
|
|
|
STRG, 1 user STRG, 10 users STRG, 20 users STRG, 50 users | 20.01 21.68 22.04 22.38 | 13.14 14.68 15.35 15.24 | 9.09 9.68 11.68 12.34 | 9.07 9.62 10.07 10.29 |
| Note: 2064-109; z/VM 4.2.0 with 64-bit CP; Linux 2.4.7 | ||||
- For RR, transaction rate is essentially invariant over MTU size. Adding users helps transaction rate, up to 10 users. We were disappointed to see the RR transaction rate start to roll off beyond 10 users. We were pleased to see that transaction cost was invariant over MTU size and stayed flat as number of users became large.
- For CRR, as in RR, MTU size had no effect. Transaction rate increased with number of users up to 10 but then started to roll off. Transaction cost initially decreased as number of users increased, but then stayed flat.
- In STRG, we saw that as users increased, data rate initially stayed flat but then rolled off significantly. Cost per MB increased slightly with number of users. This suggests that the software failed to fully utilize the LPAR when large numbers of users were involved, and in fact this is the case. We examined LPAR utilization for the guest LAN STRG runs and found that it peaked at around 55%. It is as if something unrelated to number of users stopped guest LAN from using any more of the LPAR's CPU resource. This phenomenon needs more study.
Table 7. Throughput and CPU Time: VCTC
MTU Size | 1500 | 8192 | 32760 |
|---|---|---|---|
Throughput (tx/sec) |
|
|
|
RR, 1 user RR, 10 users RR, 20 users RR, 50 users | 4901.00 5377.88 6132.52 13201.28 | 4817.30 5348.36 6130.99 13812.07 |
|
CRR, 1 user CRR, 10 users CRR, 20 users CRR, 50 users | 589.95 794.68 1038.32 2151.78 | 705.34 781.00 1040.23 1364.64 |
|
Throughput (MB/sec) |
|
|
|
STRG, 1 user STRG, 10 users STRG, 20 users STRG, 50 users | 8.26 12.10 12.03 12.42 | 18.99 28.25 28.76 29.21 | 57.13 54.85 54.78 54.64 |
CPU time (msec/tx) |
|
|
|
RR, 1 user RR, 10 users RR, 20 users RR, 50 users | 0.20 0.18 0.16 0.10 | 0.20 0.18 0.16 0.09 |
|
CRR, 1 user CRR, 10 users CRR, 20 users CRR, 50 users | 1.64 1.24 0.97 0.60 | 1.37 1.26 0.99 0.80 |
|
CPU time (msec/MB) |
|
|
|
STRG, 1 user STRG, 10 users STRG, 20 users STRG, 50 users | 116.35 82.52 82.77 80.74 | 50.33 34.72 34.38 34.12 | 15.47 17.78 17.91 18.18 |
| Note: 2064-109; z/VM 4.2.0 with 64-bit CP; Linux 2.4.7 | |||
- RR performance was not a function of MTU size, as we expected.
- CRR performance was not a function of MTU size either, except for the 50-user, MTU-8192 case, which we are unable to explain.
- STRG performance flattens out somewhere between 1 and 10 users.
Recommendations
For all but streaming workloads, use VM guest LAN. It shows the highest transaction rates and the lowest CPU cost per transaction. It also happens to be the easiest to configure.
For streaming workloads, if HiperSockets hardware is available, use it. No matter which technology you select, though, use the highest MTU size you can.
Footnotes:
- 1
- For results of similar measurements on z/VM TCP/IP, refer to HiperSockets and VM Guest LAN Support. to .
Back to Table of Contents.
Linux Guest DASD Performance
Purpose
The purpose of this experiment was to measure the disk I/O performance of an ESA/390 Linux 2.4 guest on z/VM 4.2.0. We sought to measure write performance, non-cached (minidisk cache (MDC) OFF) read performance, and cached (MDC ON) read performance.
Executive Summary of Results
We found that CP spends about 11% more CPU on writes when MDC is on. We also found that CP spends about 285% more CPU on a read when it has to do an MDC insertion as a result of the read.
Together, these results suggest that setting MDC ON for a Linux guest's DASD volumes is a good idea only when the I/O to the disk is known to be mostly reads.
Hardware
2064-109, LPAR with 2 dedicated CPUs, 1 GB real, 2 GB XSTORE, LPAR dedicated to this experiment. DASD is RAMAC-1 behind 3990-6 controller. 1
Software
z/VM 4.2.0. An early internal development driver of 31-bit Linux 2.4.5. We configured the Linux virtual machine with 128 MB of main storage, no swap partition, and its root file system residing on a 3000-cylinder minidisk. Finally, we used a DASD I/O exercising tool which opens a new Linux file (the "ballast file"), writes it in 16 KB chunks until the desired file size is reached, closes it, then performs N (N>=0) open-read-close passes over the file, reading the file in 16 KB chunks during each pass.We used a 512 MB ballast file for these experiments. We chose 512 MB because it was large enough to prohibit a 128 MB Linux guest from using its own internal file cache yet small enough to fit completely in our 2 GB of XSTORE (minidisk cache).
Experiment
We ran the disk exerciser in several different configurations, varying the setting of MDC and varying the number of read passes over the ballast file. The configuration used is encoded in the run name. Each run name is Mmnn, where the name decodes as follows:
Portion | Meaning |
Mm | M0 for MDC OFF, and M1 for MDC ON. |
nn | The number of read passes over the file: 0, 1, 2, or 10. |
We also synthesized some runs by subtracting actual runs' resource consumption from one another. We did this to isolate the resource consumption incurred during one read pass of the ballast file under various conditions. These are our "synthetic" runs:
- Run NCR0 is the non-cached (i.e., first-pass) read performance for MDC OFF. Its resource consumption is the difference between what M01 consumed and what M00 consumed.
- Run NCR1 is the non-cached (i.e., first-pass) read performance for MDC ON. Its resource consumption is the difference between what M11 consumed and what M10 consumed.
- Run CR is the cached (i.e., second-pass) read performance. Its resource consumption is the difference between what M12 consumed and what M11 consumed.
We used CP QUERY TIME to record virtual CPU time, CP CPU time, and elapsed time for each run. We also used CP INDICATE USER * EXP to record virtual I/O count for each run. Also, the disk exerciser tool prints its observed write data rate (KB/sec) and observed read data rate (KB/sec) when it finishes its run.
Finally, for each configuration, we ran the exerciser 10 times. We computed the mean and standard deviation of the samples for each configuration, so as to get a measure of natural run variability and so we could reliably compare runs using a twin-tailed t-test.
Observations
| Run ID | Virtual CPU time (hundredths of seconds) | CP CPU time (hundredths of seconds) | Tool-reported read rate (KB/sec) | Tool-reported write rate (KB/sec) |
|---|---|---|---|---|
| M00 | 10/16499.3/1426 | 10/38.9/1.221 | n/a | 10/3029.5/10.93 |
| M01 | 10/17382.4/23.62 | 10/75.2/1.887 | 10/5376.8/36.14 | 10/3037.5/3.557 |
| M10 | 10/17184.1/21.76 | 10/43.1/1.578 | n/a | 10/3036.8/1.939 |
| M11 | 10/17386.5/30.94 | 10/183/1.789 | 10/4360.3/16.86 | 10/3037.2/3.709 |
| M12 | 10/17564/39.51 | 10/268.1/2.211 | 10/8531/48.23 | 10/3035.9/5.87 |
| M110 | 10/18943.4/40.52 | 10/955.8/4.167 | 10/36439.9/149.7 | 10/3037.9/7.203 |
| NCR0 | 10/883.1/1434 | 10/36.3/2.410 | see M01 | n/a |
| NCR1 | 10/202.4/42.82 | 10/139.9/2.773 | see M11 | n/a |
| CR | 10/177.5/35.40 | 10/85.1/2.548 | 10/217950/79475 (see below) | n/a |
| Note: 2064-109, LPAR with 2 dedicated CPUs, 1 GB real, 2 GB XSTORE, LPAR dedicated to these runs. RAMAC-1 behind 3990-6. z/VM 4.2.0. Linux 2.4, 31-bit, internal lab driver. 128 MB Linux virtual machine, no swap partition, Linux DASD is 3000-cylinder minidisk, not CMS formatted. Values in this table are recorded as N/m/sd, where N is the number of samples taken, m is the mean of the samples, and sd is the standard deviation of the samples. | ||||
Analysis
In the analysis below, all comparisons of runs were done using a twin-tailed t-test with 95% confidence level cutoff.
- The disk exerciser tool reports a write rate of right around 3030 KB/sec, or 2.96 MB/sec. Note that the write-only runs' CPU time is almost entirely virtual time. It takes the Linux guest much more CPU time to figure out what to write than it does CP to actually write it. This is not unexpected.
-
Comparing write performance for MDC OFF (M00) to MDC ON (M10), we
see that there is no statistically
significant difference in any performance measure except CP CPU
time, where the t-test yields a 99% confidence level:
M00.CPcpu vs. M10.CPcpu: cl=99%, delta=10.79%
This shows that for MDC ON, writes cost about 11% more CP CPU than for MDC OFF. We expect that this CP CPU time increase is due to MDC maintenance (e.g., invalidation). -
The tool-reported read rate for MDC OFF is 5376 KB/sec.
With MDC ON, the tool reports the first read (run M11) took
place at 4360 KB/sec, which is slower than the MDC OFF read rate.
This makes sense, because when MDC is ON,
CP takes CPU time to
do MDC insertions, and so the read rate drops.
We can get a look at how much these insertions
cost by comparing the CP CPU time for the synthesized NCR0 and
NCR1 runs:
NCR0.CPcpu vs. NCR1.CPcpu: cl=99%, delta=285.4%
This tells us that an MDC insertion is expensive -- CP CPU goes up by 285% when an insertion happens. - With MDC ON, when we read the file twice (run M12)
instead of once (run M11),
the average tool-reported read rate rises dramatically, from
4360 KB/sec to 8531 KB/sec. This is expected because the second
read is satisfied from MDC.
With further analysis we can compute what data rate M12 experienced on its second read -- in other words, what synthesized run CR's tool-reported read rate would have been. The following sample calculation, using the average read rates experienced by M11 and M12 as inputs, illustrates how the analysis goes:
Let t12 = elapsed time for M12's two reads of the file
        = (2 * 524288 KB / (8531 KB/sec))
        = 122.91 sec

Let t11 = elapsed time for M11's one read of the file
        = 524288 KB / (4360.3 KB/sec)
        = 120.24 sec

Let tr  = time M12 spent in its second read of the file
        = t12 - t11
        = 2.67 seconds

Let dr  = data rate experienced by M12 during second read
        = 524288 KB / 2.67 sec
        = 196000 KB / sec
        = data rate run "CR" would have reported
In spite of this particular calculation's result, the reader is strongly cautioned that the average read rate experienced by our synthesized run CR is not 196000 KB/sec. It is a fallacy to try to calculate CR's average read rate by using the average read rates of M11 and M12 in these formulas. To calculate CR's average read rate, we must do the above calculation for every pair of (M11,M12) read rate samples, and then compute the average of the 10 results of said calculation. Said technique is how we got the table's value for the average read rate experienced by hypothetical run CR. The table's value -- 213 MB/sec -- dramatically illustrates the effectiveness of MDC in speeding up the second read of a file.
-
Comparing runs NCR1 and CR tells us how much CP CPU time
it costs to incur a minidisk cache miss:
NCR1.CPcpu vs: CR.CPcpu: cl=99% delta=-39.17%
When it's a hit in MDC, CP spends 39% less CPU than when it's a miss. Another way to say this is that when it's a miss, CP spends 64% more CPU than when it's a hit.
Recommendations
For a Linux disk that is write-mostly, one will definitely want to set MDC OFF for it. This is because CP spends about 11% more CPU on a write if MDC is ON, doing MDC management.
For a Linux disk that is evenly-mixed I/O, one will still want to set MDC OFF for it. This is because of the high price of MDC insertions on read.
The case where MDC is really helpful is the read-mostly case, where the data rate rises dramatically and where CP CPU time per read is at a minimum.
Footnotes:
- 1
- While the RAMAC-1 is not the most current technology, the purpose of these experiments was to evaluate certain aspects of VM configuration.
Back to Table of Contents.
z/VM Version 4 Release 1.0
This section summarizes the performance characteristics of z/VM 4.1.0 and the results of the z/VM 4.1.0 performance evaluation.
Back to Table of Contents.
Summary of Key Findings
This section summarizes the performance evaluation of z/VM 4.1.0. For further information on any given topic, refer to the page indicated in parentheses.
z/VM 4.1.0 includes a number of performance enhancements (see Performance Improvements). In addition, some changes were made that affect VM performance management (see Performance Management):
- Performance Improvements
- Fast CCW Translation for Network I/O
- Enhanced Guest Page Fault Handling
- CMSINST Shared Segment Addition
- Performance Management Changes
- Monitor Enhancements
- Effects on Accounting Data
- VM Performance Products
Regression measurements for the CMS environment (CMS1 workload) and the VSE guest environment (DYNAPACE workload) indicate that the performance of z/VM 4.1.0 is equivalent to z/VM 3.1.0 and that the performance of TCP/IP Level 410 is equivalent to TCP/IP Level 3A0.
The fast CCW translation extensions improve the efficiency of network I/O issued by guest operating systems. Measurement results for a Linux guest show a 39% decrease in CP CPU time for I/O to an LAN Channel Station (LCS) adapter and a 44% decrease in CP CPU time for I/O to a real CTC adapter (see Fast CCW Translation for Network I/O).
Back to Table of Contents.
Changes That Affect Performance
This chapter contains descriptions of various changes in z/VM 4.1.0 that affect performance. It is divided into two sections -- Performance Improvements and Performance Management. This information is also available on our VM Performance Changes page, along with corresponding information for previous releases.
Back to Table of Contents.
Performance Improvements
The following items improve performance:
- Fast CCW Translation for Network I/O
- Enhanced Guest Page Fault Handling
- CMSINST Shared Segment Addition
Fast CCW Translation for Network I/O
To improve the performance of guest I/O to network devices, the fast CCW translator in CP, previously limited to DASD channel programs, has been extended to handle a wide range of channel programs that perform I/Os to network adapters such as channel-to-channel adapters (CTCA), CLAW, OSA, and LAN Channel Station (LCS) devices. Although the fast CCW translation extensions are based on analysis of Linux guest channel programs, any VM guest that does qualifying I/Os will benefit.
This change improves performance by reducing the processor time required by CP to do guest I/O translation. Measurement results for a Linux guest show a 39% decrease in CP CPU time for I/O to an LCS adapter and a 44% decrease in CP CPU time for I/O to a real CTC adapter. See Fast CCW Translation for Network I/O for measurement details.
Enhanced Guest Page Fault Handling
Page fault handling support within CP has been enhanced to allow 31-bit or 64-bit guests to take full advantage of page fault notifications, allowing the guest to continue processing while the page fault is handled by CP. This support will be provided by APAR VM62840, which also makes it available on z/VM 3.1.0.
This support extends the current PFAULT page fault handshaking service in the following ways:
- the guest does not have to be in access-register mode
- z/Architecture is supported (includes 64-bit addressing)
- the guest can use the PSW to mask off interrupts when not wanted
CMSINST Shared Segment Addition
DMSWRS MODULE has been added to the CMSINST shared segment, eliminating loading time and reducing real storage requirements for CMS environments that use SENDFILE.
Back to Table of Contents.
Performance Management
These changes affect the performance management of z/VM and TCP/IP VM.
- Monitor Enhancements
- Effects on Accounting Data
- VM Performance Products
Monitor Enhancements
There were relatively few changes to monitor this release. The most significant change is the location of the monitor record layout file. Previously, this was shipped as the MONITOR LIST1403 file on MAINT's 194 disk. For this release, the LIST1403 file will not be shipped. The record layouts can be found on our control blocks page.
Three fields were added in support of the fast CCW translation enhancements made this release. Fields have been added to the system global data record (domain 0 record 19, D0/R19) for the following:
- Number of CCWs translated successfully through the fast path for network devices
- Number of CCWs for network devices that were not eligible for the fast path
- Number of CCW for network devices where the fast path was attempted, but had to be aborted.
Comments were also changed on existing CCW translation fields in this record to reflect that they are for DASD devices.
Effects on Accounting Data
None of the z/VM 4.1.0 performance changes are expected to have a significant effect on the values reported in the virtual machine resource usage accounting record.
VM Performance Products
This section contains information on the support for z/VM 4.1.0 provided by VMPRF, RTM, FCON/ESA, and VMPAF.
VMPRF support for z/VM 4.1.0 is provided by VMPRF Function Level 4.1.0, which is a preinstalled, priced feature of z/VM 4.1.0. VMPRF 4.1.0 should be run on z/VM 4.1.0 and can be used to reduce CP monitor data obtained from any supported VM release.
The SYSTEM_FACILITIES_BY_TIME report (PRF104) has been updated to include columns showing counts for the fast CCW translation for guest network I/O that is new to z/VM 4.1.0.
RTM support for z/VM 4.1.0 is provided by Real Time Monitor Function Level 4.1.0. As with VMPRF, RTM is now a preinstalled, priced feature of z/VM 4.1.0.
The RTM SYSTEM screen has been updated to include counts for fast CCW translation for guest network I/O.
To run FCON/ESA on any level of z/VM, FCON/ESA Version 3.2.02 or higher is required. Fix level 26 of the program also implements the new monitor data for fast CCW translation of network adapter CCWs; this is the recommended minimum level for operation with z/VM 4.1.0. The program runs on z/VM systems in both 31-bit and 64-bit mode and on any previous VM/ESA release.
Performance Analysis Facility/VM 1.1.3 (VMPAF) will run on z/VM 4.1.0 with the same support as z/VM 3.1.0.
Back to Table of Contents.
New Functions
This section contains performance evaluation results for the following new functions:
- Fast CCW Translation for Network I/O
Back to Table of Contents.
Fast CCW Translation for Network I/O
Purpose
Our purpose is to measure the effectiveness of the fast CCW translation extensions that have been added to CP in z/VM 4.1.0. This line item is intended to reduce the CP CPU time consumed translating CCWs for guests that do I/O to real CTCs or to LAN Channel Station (LCS) devices. Our experiments showed that for LCS I/O, the line item reduced CP CPU consumption by 39% and total CPU consumption by 25%. For real CTC I/O, the line item reduced CP CPU consumption by 44% and total CPU consumption by 30%.
Hardware
2064-108, LPAR with 2 dedicated engines, 1 GB real, 2 GB expanded, OSA Express Fast Ethernet (LCS mode), wrap-back ESCON channel. MTU 1500 for all cases.
Software
z/VM 4.1.0 with associated TCP/IP; TurboLinux beta 13 (November 2000). 1
LCS Device Experiment
We installed the specified Linux and let it own the LCS device. We placed a 100 MB data file on a nearby workstation on the IBM intranet and set up the Linux guest so that it would do 5 FTP GETs of this file to /dev/null. We measured the Linux guest for virtual CPU consumed, CP CPU consumed, and I/Os performed during the set of GETs. We performed this experiment four times. We computed the mean and standard deviation for the samples.
Next we used the CP STORE HOST command to "zap out" the fast CCW translation path in HCPVDI. In other words, we disabled z/VM 4.1.0's fast CCW translation line item, so that CCW translation would take the customary (z/VM 3.1.0 and earlier) code path. We performed the experiment four more times and computed the means and standard deviations for the samples.
We then performed twin-tailed t-tests over the two sets of samples to look for significance in the difference of the means.
LCS Device Analysis
Measurements are expressed as N/m/sd, where N is the number of samples, m is the mean of the samples, and sd is the standard deviation of the samples.
Result r is our assessment of repeatability: r=1 indicates that the 95% confidence interval on m is contained within the 5% magnitude interval around m.
In the comparisons of means, result cl is the confidence
level the t-test yielded. In other words, it's the certainty we
have that the means truly are different.
Table 1. Fast CCW Translation Results - LCS
| Quantity | Disabled | Enabled | Change |
|---|---|---|---|
| CP CPU (sec) | 4/9.72/0.0277 r=1 | 4/5.91/0.0274 r=1 | cl=99 delta=-39.21% |
| Total CPU (sec) | 4/15.68/0.0526 r=1 | 4/11.7575/0.0396 r=1 | cl=99 delta=-25.03% |
| I/O (count) | 4/306922/701.7 r=1 | 4/307470/1272 r=1 | cl=0 |
| CP CPU per I/O (sec) (calculated) | 3.167E-05 | 1.922E-05 | -39.4% |
| Note: 2064-108, LPAR with 2 dedicated processors, 1 GB main, 2 GB expanded. z/VM 4.1.0. Guests 128 MB; samples / mean / standard deviation | |||
What we see here is that CP CPU time went down 39%, overall CPU time went down 25%, and CP CPU time per I/O went down 39%. There was no change in the number of I/Os started by Linux (we expected that).
Real CTC Experiment
We installed said Linux and connected it via real ESCON (wrap-back) to a VM TCP/IP stack which in turn owned the LCS device. We then ran the same two FTP experiments described previously.
Real CTC Analysis
N/m/sd, r, and cl have the
same meanings as in experiment 1.
Table 2. Fast CCW Translation Results - ESCON
| Quantity | Disabled | Enabled | Change |
|---|---|---|---|
| CP CPU (sec) | 4/14.64/0.1901 r=1 | 4/8.0725/0.0512 r=1 | cl=99 delta=-44.86% |
| Total CPU (sec) | 4/23.5125/0.5512 r=1 | 4/16.4425/0.0810 r=1 | cl=99 delta=-30.07% |
| I/O (count) | 4/325479/3711 r=1 | 4/314870/1086 r=1 | cl=99 delta=-3.26% |
| CP CPU per I/O (sec) (calculated) | 4.498E-05 | 2.564E-05 | -43.0% |
| Note: 2064-108, LPAR with 2 dedicated processors, 1 GB main, 2 GB expanded. z/VM 4.1.0. Guests 128 MB.; samples / mean / standard deviation | |||
We see here that CP CPU time dropped 45%, total CPU time dropped 30%, and Linux I/Os dropped 3%. CP CPU time per I/O dropped by 43%.
Footnotes:
- 1
- uname -a yields Linux linccw1.endicott.ibm.com 2.2.16 #1 SMP Tue Nov 21 12:11:14 PST 2000 s390 unknown.
Back to Table of Contents.
z/VM Version 3 Release 1.0
This section summarizes the z/VM 3.1.0 performance evaluation results along with additional performance results obtained during the time frame of this release.
Back to Table of Contents.
Summary of Key Findings
This section summarizes the performance evaluation of z/VM 3.1.0, including TCP/IP Feature for z/VM, Level 3A0. Measurements were obtained for the CMS-intensive, VSE guest, Telnet, and FTP environments on zSeries 900 and other processors. For further information on any given topic, refer to the page indicated in parentheses.
z/VM 3.1.0 includes a number of performance enhancements (see Performance Improvements). Some changes have the potential to adversely affect performance (see Performance Considerations). Lastly, a number of changes were made that affect VM performance management (see Performance Management):
- Performance Improvements
- 64-Bit Support
- VCTC Pathlength Reduction
- Miscellaneous CMS Improvements
- Gigabit Ethernet Support via QDIO
- Performance Considerations
- MDC Tuning with Large Real Memory
- Large V=R Area
- Performance Management Changes
- Monitor Enhancements
- CP Control Block Changes
- QUERY FRAMES Command
- NETSTAT Command
- Effects on Accounting Data
- VM Performance Products
Migration from VM/ESA 2.4.0 and TCP/IP 320:
Benchmark measurements show the following performance results for z/VM 3.1.0 (31-bit CP and 64-bit CP) relative to VM/ESA 2.4.0:
CMS-intensive | Throughputs and response times were equivalent for all 3 cases. Processor requirements for VM/ESA 2.4.0 and z/VM 3.1.0 with 31-bit CP were equivalent. Processor requirements for z/VM 3.1.0 with 64-bit CP increased by 0.8% to 1.8% for the measured environments as a result of the 64-bit support (see CMS-Intensive). |
VSE guest | The performance of all 3 cases was equivalent for both the V=R and V=V environments (see VSE/ESA Guest). |
TCP/IP stack machine processor requirements for TCP/IP 3A0 decreased by approximately 1% relative to TCP/IP 320 for the measured Telnet and FTP workloads (see TCP/IP).
CMS measurements using the z/VM 3.1.0 64-bit CP running on a 2064-1C8 processor with 8G total storage showed an internal throughput rate (ITR) improvement of 4.6% when most of that storage was configured as real storage as compared to 2G real storage and 6G expanded storage. For 12G total storage, the ITR improvement was 3.8%. Additional measurements in these storage configurations show that it is important to reassess minidisk cache tuning when running in large real storage sizes. Finally, measurements are provided that help to quantify the amount of real storage that needs to be available below the 2G line when VM is run in large real storage sizes. While CP now supports all processor storage being configured as real storage, it is still recommended that some storage be configured as expanded storage (see CP 64-Bit Support).
Measurement results on a 9672-ZZ7 processor demonstrate the ability of the new QDIO support to deliver Gigabit Ethernet throughputs of up to 34 megabytes/second using a 1500 byte packet size and up to 48 megabytes/second using an 8992 byte packet size. The primary limiting factor is TCP/IP stack machine processing requirements, suggesting that even higher throughputs are achievable on a zSeries 900 processor or if 2 or more stack virtual machines are used (see Queued Direct I/O Support).
The data privacy provided by the Secure Socket Layer support increases processor requirements relative to connections that do not use SSL. For connect/disconnect processing, 10x to 28x increases were observed for new sessions, while 6x to 7x increases were observed for resumed sessions. Increases ranging from 4x to 10x were observed for an FTP bulk data transfer workload, depending on the cipher suite used (see Secure Socket Layer Support).
The Linux IUCV driver sustains significantly higher data rates relative to using virtual channel-to-channel (VCTC) through the Linux CTC driver. Measurement results show 1.4-fold to 2.4-fold increases, depending upon data transfer size. These higher throughputs are due to lower processor requirements (see Linux Guest IUCV Driver).
VCTC performance has been significantly improved by VM/ESA 2.4.0 APAR VM62480, now part of z/VM 3.1.0. With this improvement, VCTC processor requirements are similar to real ESCON CTC. Throughput for bulk data transfer is 2.4 times higher than real ESCON CTC for the measured environment due to the absence of real CTC latencies (see Virtual Channel-to-Channel Performance).
Measurement results demonstrate the ability of TCP/IP Telnet to support 5100 CMS users with good performance. Relative to the corresponding VTAM support, however, response times and processor usage were higher due to increased master processor requirements (see Migration from VTAM to Telnet).
Back to Table of Contents.
Changes That Affect Performance
This chapter contains descriptions of various changes in z/VM 3.1.0 that affect performance. It is divided into three sections -- Performance Improvements, Performance Considerations, and Performance Management. This information is also available on our VM Performance Changes page, along with corresponding information for previous releases.
Back to Table of Contents.
Performance Improvements
The following items improve performance.
- CP 64-Bit Support
- VCTC Pathlength Reduction
- Miscellaneous CMS Improvements
- Gigabit Ethernet Support via QDIO
CP 64-Bit Support
The support provided in z/VM 3.1.0 for virtual machine sizes larger than 2 Gigabytes has the potential to result in substantial performance improvements for 64-bit capable guest operating systems that are currently constrained by the 2G limit. The support provided in z/VM 3.1.0 for real storage sizes larger than 2 Gigabytes means that the same applies to z/VM itself when run second level or on actual hardware.
Section Real Storage Sizes above 2G provides some examples of z/VM running CMS workloads in real storage sizes larger than 2G. However, for those examples, z/VM also runs these same workloads quite well in a combination of 2G real storage plus the remainder of total storage configured as expanded storage. Because performance is good to start with, these examples show only incremental performance improvements when additional real storage is substituted for expanded storage.
VCTC Pathlength Reduction
The pathlength in CP that implements virtual channel-to-channel has been reduced significantly by improving the efficiency with which the data are copied from source to target virtual machine. Measurement results (see Virtual Channel-to-Channel Performance) show a 53% reduction in CP CPU time and a 64% increase in throughput. This improvement was first made available in VM/ESA 2.4.0 through APAR VM62480 and has now been incorporated into z/VM 3.1.0.
Miscellaneous CMS Improvements
A performance improvement has been made to the Rexx compiler's runtime library and this improvement has been incorporated into the version of that library that is integrated into CMS for use by CMS functions that are implemented as compiled Rexx programs. This improvement decreases the number of Diagnose 0 requests that the runtime issues in order to determine the level of CP that it is running on. The net result is a decrease in CP CPU time when using the CMS productivity aids (FILELIST, RDRLIST, PEEK, etc.) and other CMS functions that are implemented in compiled Rexx. This improvement reduces total system processor requirements of the CMS1 workload by about 0.2%.
There has been further use of the SUPERSET command to replace multiple instances of the SET command in XEDIT parts used in the CMS productivity aids. This has resulted in reduced processing requirements for CSLLIST, NAMES, CSLMAP, MACLIST, and VMLINK.
Gigabit Ethernet Support via QDIO
The QDIO support in TCP/IP Level 3A0 allows for the support of Gigabit Ethernet connections with a high level of throughput capacity. See Queued Direct I/O Support for additional discussion and measurement results.
Back to Table of Contents.
Performance Considerations
These items warrant consideration since they have potential for a negative impact to performance.
- MDC Tuning with Large Real Memory
- Large V=R Area
MDC Tuning with Large Real Memory
When running in large real memory sizes and particularly in real memory sizes larger than 2 Gigabytes, it is important to review the current minidisk cache tuning settings for possible changes. The most likely tuning action needed will be to ensure that the real MDC does not get too large. See MDC Tuning Recommendations for further information.
Large V=R Area
The V=R area, if present, is used to accommodate preferred guest (V=R and V=F) virtual machines. Be careful not to define a V=R area that is too large. This can cause a performance problem even when running in a large real storage size (greater than 2G). The reason for this is that most real storage frames referenced by CP and the real storage frames occupied by the V=R area itself must reside in the first 2 Gigabytes of real storage. As a result, if the V=R area takes up too many of these real storage frames, the number of remaining available frames below the 2G line may be insufficient to meet the needs of the rest of the system, resulting in a thrashing situation. See The 2G Line for further discussion and measurement results. Those results suggest, as a rough rule-of-thumb, that there should be at least 15-20 4K page frames available below the 2G line per CMS user.
Back to Table of Contents.
Performance Management
These changes affect the performance management of z/VM and TCP/IP VM.
- Monitor Enhancements
- CP Control Block Changes
- QUERY FRAMES Command
- NETSTAT Command
- Effects on Accounting Data
- VM Performance Products
Monitor Enhancements
A number of new monitor fields have been added. Some of the more significant changes are summarized below. For a complete list of changes, see the MONITOR LIST1403 file (on MAINT's 194 disk) for the VM monitor changes and Appendix F of the Performance Manual for changes to TCP/IP Stack application monitor data.
Several changes were made to the monitor in this release for 64-bit support. While the VM control program can run in either 31-bit or 64-bit mode 1 , a common monitor architecture is used. Larger fields were added to accommodate larger storage sizes. These fields can be used when CP is running in either 31-bit or 64-bit mode. The previous, smaller fields remain for compatibility, but are obviously incorrect for the larger storage sizes. While this approach allows some older monitor reduction programs to continue to work, you should see your vendor for any updates to performance products for this new VM release.
Larger fields were added to system, storage, and user domain records to record both virtual and real storage sizes greater than 2G. While virtual pages can reside above the 2G line, there is a requirement for the page to be located below the 2G line for certain CP processing. Fields have been added to the monitor to record the movement across the 2G line for CP. The monitor also records whether a virtual machine has issued the instruction required to enter 64-bit mode.
The data contributed to the monitor data stream by the TCP/IP stack machine were extended for the QDIO support added in TCP/IP Level 3A0. This includes information describing the use of fixed storage pool, PCI rates, and polling process.
APAR VM62794 was opened to correct inaccurate data in monitor record domain 3 record 3. This is the Shared Storage Management record which reports on Named Saved Systems and Discontiguous Saved Segments. Information on the paging activity and page counts for these shared segments is inaccurate without the APAR applied. The APAR is projected to be available on the second RSU for z/VM 3.1.0.
CP Control Block Changes
CP control block layouts are not considered a supported programming interface. However, many customer tools, some used for performance management, use offsets into control blocks to gather information. Changes in the offsets are common for each release and some result in changes to these tools. Most tools of this nature will need to be reviewed this release because of the multitude of changes in control blocks due to 64-bit support. This is true for both 31-bit and 64-bit systems.
QUERY FRAMES Command
The CP QUERY FRAMES command has been enhanced to include additional information when more than 2G of real storage is in use. This information includes the total amount of online and offline storage above the 2G line. Two other values are also reported: the number of pages on the available list and the number of pages that have not yet been initialized. The latter value should only be nonzero for a brief period of time after a system IPL. When VM IPLs, it does not initialize all of storage at once, but just enough to be productive. The remainder of the storage is initialized in the background. QUERY FRAMES will indicate how much storage is left to be initialized.
NETSTAT Command
The NETSTAT command has been enhanced in TCP/IP Level 3A0 in support of the following enhancements: IP Multicasting, Secure Socket Layer (SSL), and Gigabit Ethernet support. The DEVLINKS option includes information on whether multicast support is available for the given link. Information on SSL connections can be see with the CONN option. Also, the NETSTAT POOLSIZE output includes information on the new Fixed Page Storage Pool (FPSP) used with Gigabit Ethernet.
Effects on Accounting Data
None of the z/VM 3.1.0 performance changes are expected to have a significant effect on the values reported in the virtual machine resource usage accounting record.
VM Performance Products
This section contains information on the support for z/VM 3.1.0 provided by VMPRF, RTM/ESA, FCON/ESA, and VMPAF.
VMPRF support for z/VM 3.1.0 is provided by VMPRF 1.2.2. This new VMPRF release also supports VM/ESA 2.3.0 and VM/ESA 2.4.0. Changes have been made to the following reports:
- SYSTEM_SUMMARY_BY_TIME
- PROCESSORS_COMPLEX_BY_TIME
- SYSTEM_CONFIGURATION
- MINIDISK_CACHE_USAGE_BY_TIME
- USER_CONFIGURATION
A number of these changes are to accommodate 64-bit mode operation. In addition, there are some new reports:
- SYSTEM_SUMMARY2_BY_TIME
SIE rates, spin lock rates
- AUXSTORE_BY_TIME
capacity and space utilization data for page, spool, and dump
- NONDASD_BY_ACTIVITY and NONDASD_BY_CONFIG
similar to DASD_BY_ACTIVITY and DASD_BY_CONFIG but for other I/O devices
NONDASD SUMMARY and TREND records have been added. Data have been added to the end of many of the existing SUMMARY and TREND records.
RTM support for z/VM 3.1.0 is provided by Real Time Monitor for z/VM 1.5.3. RTM 1.5.3 includes several notable improvements. RTM operation can now be tailored at startup through use of a configuration file, 370 accommodation is no longer necessary, and new QUERY ENVIRONMENT and QUERY LEVEL commands are provided. The same RTM MODULE supports both the 31-bit and 64-bit versions of CP. RTM 1.5.3 does not support earlier VM releases. That support is provided by RTM 1.5.2.
FCON/ESA Version 3.2.02 is required for z/VM 3.1.0. It provides the same information for z/VM that the previous level, FCON/ESA V.3.2.01, does for VM/ESA 2.4.0, plus a number of additional z/VM specific fields for z/VM running in 64-bit mode. Additional fields provided by TCP/IP Level 3A0 are included as well. The new FCON/ESA level still runs on any previous VM/ESA release too, as usual.
Performance Analysis Facility/VM 1.1.3 (VMPAF) will run on z/VM 3.1.0 with the same support as VM/ESA 2.4.0.
Footnotes:
- 1
- These are more formally known as ESA/390 and zArchitecture.
Back to Table of Contents.
Migration from VM/ESA 2.4.0 and TCP/IP FL 320
This chapter examines the performance effects of migrating from VM/ESA 2.4.0 to z/VM 3.1.0 and from TCP/IP Function Level 320 to TCP/IP Level 3A0. The following environments were measured: CMS-intensive, VSE guest, Telnet, and FTP.
z/VM 3.1.0 provides both a 31-bit and a 64-bit version of CP. The 31 bit version can run on older processors and 64-bit capable processors in 31 bit mode. The 64-bit version can only run on 64-bit capable processors. Because of this, all VM performance regression measurements were set up as a 3-way comparison of VM/ESA 2.4.0, z/VM 3.1.0 with 31-bit CP, and z/VM 3.1.0 with 64-bit CP, all run on an IBM zSeries 900 processor.
Back to Table of Contents.
CMS-Intensive
The following 3 cases were evaluated:
- VM/ESA 2.4.0
- z/VM 3.1.0, 31-bit CP
- z/VM 3.1.0, 64-bit CP
These cases were run in each of the following 3 environments:
- 2064 2-way LPAR, 1G/2G
- 2064-1C8, 2G/6G
- 2064-1C8, 2G/10G
For all 3 environments, throughputs and response times for all 3 cases were equivalent. For all 3 environments, total CPU time per command for VM/ESA 2.4.0 and z/VM 3.1.0 31-bit CP were equivalent within measurement variability. CPU time per command for the z/VM 3.1.0 64-bit case increased relative to the other two cases by 0.8% to 1.8%, depending on the environment. This was due to the 64-bit support, which resulted in CP CPU time per command increases ranging from 5.2% to 7.1%.
All measurements were done using the CMS1 workload. See CMS-Intensive (CMS1) for a description.
Measurement results and discussion for each of these three environments are provided in the following sections.
Back to Table of Contents.
2064 2-Way LPAR, 1G/2G
(Ref #1.)
Workload: CMS1 with External TPNS:
Processor model:   2064-109 LPAR
Processors used:   2 dedicated
Storage:
    Real:          1GB (default MDC)
    Expanded:      2GB (MDC BIAS 0.1)
DASD:
Type of DASD | Control Unit | Number of Paths |
|
| - Number of Volumes - TDSK |
|
|
|
|---|---|---|---|---|---|---|---|---|
| 3390-3 | RAMAC 1 | 4 | | | | 16 | | |
| 3390-3 | RAMAC 1 | 4 | | | | 16 | | |
| 3390-3 | RAMAC 2 | 4 | 18 | 6 | 2 | | | |
| 3390-2 | 3990-3 | 4 | 4 | | 2 | | | 2 |
Note: Each set of RAMAC 1 volumes is behind a 3990-6 control unit with 1024M cache. RAMAC 2 refers to the RAMAC 2 Array Subsystem with 256M cache and drawers in 3390-3 format.
Driver:                   TPNS
Think time distribution:  Bactrian
CMS block size:           4KB

Virtual Machines:
Virtual Machine |
|
| Machine Size |
|
|
|
|---|---|---|---|---|---|---|
| SMART | 1 | RTM | 32M | 3% | 400 | QUICKDSP ON |
| TCPIP | 1 | TCPIP | 256M | 3000 | 14000 | QUICKDSP ON |
| WRITER | 1 | CP monitor | 2M | 100 | | QUICKDSP ON |
| Unnnn | 3420 | Users | 3M | 100 | |
This environment is sufficiently storage constrained that there is heavy paging to expanded storage and moderate paging to DASD.
The measurement results are summarized in the following two tables. The first table contains the absolute results, while the second table show the results as ratios relative to the VM/ESA 2.4.0 base case. Performance terms in the tables are defined in the glossary.
The results show that the total processing requirements (PBT/CMD (H)) of z/VM 3.1.0 with 31-bit CP are equivalent to VM/ESA 2.4.0. The total processing requirements of z/VM 3.1.0 with 64-bit CP are about 0.8% higher as the result of a 5.2% increase in CP CPU time (CP/CMD (H)).
A number of CP control blocks had to be extended for the 64-bit support, resulting in an increase in CP free storage requirements (FREEPGS). Many of these control blocks are used in common by both the 31-bit and 64-bit versions. That is why CP free storage requirements also show increases for z/VM 3.1.0 31-bit CP case.
The z/VM 3.1.0 results reflect the presence of the Rexx runtime improvement (see Miscellaneous CMS Improvements), which reduces total CPU time per command by about 0.2% for this workload. Most of this reduction is in CP.
Table 1. CMS-Intensive Migration from VM/ESA 2.4.0: 2064 2-way LPAR, 1G/2G
Release CP Run ID | 2.4.0 31 bit 72BC3422 | 3.1.0 31 bit 72CC3420 | 3.1.0 64 bit 72CC3421 |
|---|---|---|---|
Response Time TRIV INT NONTRIV INT TOT INT TOT INT ADJ AVG FIRST (T) AVG LAST (T) |
|
|
|
Throughput AVG THINK (T) ETR ETR (T) ETR RATIO ITR (H) ITR EMUL ITR ITRR (H) ITRR |
|
|
|
Proc. Usage PBT/CMD (H) PBT/CMD CP/CMD (H) CP/CMD EMUL/CMD (H) EMUL/CMD |
|
|
|
Processor Util. TOTAL (H) TOTAL UTIL/PROC (H) UTIL/PROC TOTAL EMUL (H) TOTAL EMUL MASTER TOTAL MASTER EMUL TVR(H) TVR |
|
|
|
Storage NUCLEUS SIZE (V) TRACE TABLE (V) WKSET (V) PGBLPGS PGBLPGS/USER TOT PAGES/USER (V) FREEPGS FREE UTIL SHRPGS |
|
|
|
Paging READS/SEC WRITES/SEC PAGE/CMD PAGE IO RATE (V) PAGE IO/CMD (V) XSTOR IN/SEC XSTOR OUT/SEC XSTOR/CMD FAST CLR/CMD |
|
|
|
Queues DISPATCH LIST ELIGIBLE LIST |
|
|
|
I/O VIO RATE VIO/CMD RIO RATE (V) RIO/CMD (V) NONPAGE RIO/CMD (V) DASD RESP TIME (V) MDC REAL SIZE (MB) MDC XSTOR SIZE (MB) MDC READS (I/Os) MDC WRITES (I/Os) MDC AVOID MDC HIT RATIO |
|
|
|
PRIVOPs PRIVOP/CMD DIAG/CMD DIAG 04/CMD DIAG 08/CMD DIAG 0C/CMD DIAG 14/CMD DIAG 58/CMD DIAG 98/CMD DIAG A4/CMD DIAG A8/CMD DIAG 214/CMD DIAG 270/CMD SIE/CMD SIE INTCPT/CMD FREE TOTL/CMD |
|
|
|
TCPIP Machine WKSET (V) TOT CPU/CMD (V) CP CPU/CMD (V) VIRT CPU/CMD (V) DIAG 98/CMD (V) |
|
|
|
| Note: 2064-109; LPAR; 2 dedicated processors; LPAR Storage: 1G central, 2G expanded; real MDC: default; xstor MDC: bias 0.1; 3420 CMS1 users; External TPNS; T=TPNS, V=VMPRF, H=Hardware Monitor, Unmarked=RTM | |||
Table 2. CMS-Intensive Migration from VM/ESA 2.4.0: 2064 2-way LPAR, 1G/2G - Ratios
Release CP Run ID | 2.4.0 31 bit 72BC3422 | 3.1.0 31 bit 72CC3420 | 3.1.0 64 bit 72CC3421 |
|---|---|---|---|
Response Time TRIV INT NONTRIV INT TOT INT TOT INT ADJ AVG FIRST (T) AVG LAST (T) |
|
|
|
Throughput AVG THINK (T) ETR ETR (T) ETR RATIO ITR (H) ITR EMUL ITR |
|
|
|
Proc. Usage PBT/CMD (H) PBT/CMD CP/CMD (H) CP/CMD EMUL/CMD (H) EMUL/CMD |
|
|
|
Processor Util. TOTAL (H) TOTAL UTIL/PROC (H) UTIL/PROC TOTAL EMUL (H) TOTAL EMUL MASTER TOTAL MASTER EMUL TVR(H) TVR |
|
|
|
Storage WKSET (V) PGBLPGS/USER TOT PAGES/USER (V) FREEPGS FREE UTIL SHRPGS |
|
|
|
Paging READS/SEC WRITES/SEC PAGE/CMD XSTOR IN/SEC XSTOR OUT/SEC XSTOR/CMD FAST CLR/CMD |
|
|
|
Queues DISPATCH LIST |
|
|
|
I/O VIO RATE VIO/CMD RIO RATE (V) RIO/CMD (V) NONPAGE RIO/CMD (V) DASD RESP TIME (V) MDC REAL SIZE (MB) MDC XSTOR SIZE (MB) MDC READS (I/Os) MDC WRITES (I/Os) MDC AVOID MDC HIT RATIO |
|
|
|
PRIVOPs PRIVOP/CMD DIAG/CMD DIAG 04/CMD DIAG 08/CMD DIAG 0C/CMD DIAG 14/CMD DIAG 58/CMD DIAG 98/CMD DIAG A4/CMD DIAG A8/CMD DIAG 214/CMD DIAG 270/CMD SIE/CMD SIE INTCPT/CMD FREE TOTL/CMD |
|
|
|
TCPIP Machine WKSET (V) TOT CPU/CMD (V) CP CPU/CMD (V) VIRT CPU/CMD (V) DIAG 98/CMD (V) |
|
|
|
| Note: 2064-109; LPAR; 2 dedicated processors; LPAR Storage: 1G central, 2G expanded; real MDC: default; xstor MDC: bias 0.1; 3420 CMS1 users; External TPNS; T=TPNS, V=VMPRF, H=Hardware Monitor, Unmarked=RTM | |||
Back to Table of Contents.
2064-1C8, 2G/6G
Workload: CMS1 with Internal TPNS: (Ref #1.)
Processor model:            2064-1C8
Processors used:            8
Storage:
    Real:                   2GB (default MDC)
    Expanded:               6GB (MDC fixed at 512M)

DASD:
Type of DASD | Control Unit | Number of Paths |
|
| - Number of Volumes - TDSK |
|
|
|
|---|---|---|---|---|---|---|---|---|
| 3390-3 | RVA T82 | 8 | 15 | 8 | 4 | 150 | | 2 |
Note: The DASD volumes are distributed across 13 RVA T82 subsystems. Each subsystem has 1536M of cache.
Driver:                     TPNS
Think time distribution:    Bactrian
CMS block size:             4KB

Virtual Machines:
Virtual Machine |
|
| Machine Size |
|
|
|
|---|---|---|---|---|---|---|
| TP1 | 1 | TPNS | 256M | 5000 | 14000 | QUICKDSP ON |
| TCPIPn | 4 | TCPIP | 512M | 3000 | 14000 | QUICKDSP ON |
| WRITER | 1 | CP monitor | 2M | 100 | | QUICKDSP ON |
| Unnnnn | 10800 | Users | 3M | 100 | |
This environment is sufficiently storage constrained that there is heavy paging to expanded storage and some paging to DASD.
The measurement results are summarized in the following two tables. The first table contains the absolute results, while the second table show the results as ratios relative to the VM/ESA 2.4.0 base case. RTM and TPNS log data were not collected for these measurements. When available, corresponding VMPRF data has been substituted for the RTM data normally shown.
The results show that z/VM 3.1.0 with 31-bit CP total processing requirements (PBT/CMD (H)) are equivalent to VM/ESA 2.4.0. z/VM 3.1.0 processing requirements are about 1.8% higher as the result of a 7.1% increase in CP CPU time (CP/CMD (H)).
The MASTER CP results suggest that the amount of time that CP must run on the master processor has increased somewhat. This increase is close to run variability for z/VM 3.1.0 with 31-bit CP. For z/VM 3.1.0 with 64-bit CP, the increase was 4.7%. Overall CP CPU utilization grew by 1.9% (calculated as TOTAL (H) - TOTAL EMUL (H)). The increased growth in MASTER CP beyond 1.9% represents an increased tendency to run on the master processor. This does not necessarily mean that there is more CP code that must run on the master processor. It could instead mean that work that no longer needs to run on the master processor is being moved to an alternate processor less quickly.
These results focus on migration of CP to z/VM 3.1.0. The CMS and GCS components were kept at the VM/ESA 2.4.0 level for all three measurements. This means that the z/VM 3.1.0 results do not include the effects of the Rexx runtime improvement (see Miscellaneous CMS Improvements), which reduces total CPU time per command command by about 0.2% for this workload.
Table 1. CMS-Intensive Migration from VM/ESA 2.4.0: 2064-1C8, 2G/6G
Release (CP) CP Run ID | 2.4.0 31 bit E240G822 | 3.1.0 31 bit E1228821 | 3.1.0 64 bit E1228826 |
|---|---|---|---|
Response Time TRIV INT NONTRIV INT TOT INT |
|
|
|
Throughput ETR (T) ITR (H) |
|
|
|
Proc. Usage PBT/CMD (H) CP/CMD (H) EMUL/CMD (H) |
|
|
|
Processor Util. TOTAL (H) UTIL/PROC (H) UTIL/PROC TOTAL EMUL (H) TOTAL EMUL MASTER TOTAL MASTER CP MASTER EMUL TVR(H) TVR |
|
|
|
Paging READS/SEC WRITES/SEC PAGE/CMD PAGE IO RATE PAGE IO/CMD XSTOR IN/SEC XSTOR OUT/SEC XSTOR/CMD |
|
|
|
Queues ELIGIBLE LIST |
|
|
|
I/O RIO RATE RIO/CMD NONPAGE RIO/CMD DASD RESP TIME MDC REAL SIZE (MB) MDC XSTOR SIZE (MB) MDC HIT RATIO |
|
|
|
PRIVOPs PRIVOP/CMD DIAG/CMD |
|
|
|
| Note: 2064-1C8; 8 processors; 2G central storage, 6G expanded storage; real MDC: default, xstor MDC: 512M; 11800 CMS1 users; internal TPNS; CMS and GCS are 2.4.0; T=TPNS, H=Hardware Monitor, Unmarked=VMPRF | |||
Table 2. CMS-Intensive Migration from VM/ESA 2.4.0: 2064-1C8, 2G/6G - Ratios
Release (CP) CP Run ID | 2.4.0 31 bit E240G822 | 3.1.0 31 bit E1228821 | 3.1.0 64 bit E1228826 |
|---|---|---|---|
Response Time TRIV INT NONTRIV INT TOT INT |
|
|
|
Throughput ETR (T) ITR (H) |
|
|
|
Proc. Usage PBT/CMD (H) CP/CMD (H) EMUL/CMD (H) |
|
|
|
Processor Util. TOTAL (H) UTIL/PROC (H) UTIL/PROC TOTAL EMUL (H) TOTAL EMUL MASTER TOTAL MASTER CP MASTER EMUL TVR(H) TVR |
|
|
|
Paging READS/SEC WRITES/SEC PAGE/CMD PAGE IO RATE PAGE IO/CMD XSTOR IN/SEC XSTOR OUT/SEC XSTOR/CMD |
|
|
|
I/O RIO RATE RIO/CMD NONPAGE RIO/CMD DASD RESP TIME MDC REAL SIZE (MB) MDC XSTOR SIZE (MB) MDC HIT RATIO |
|
|
|
PRIVOPs PRIVOP/CMD DIAG/CMD |
|
|
|
| Note: 2064-1C8; 8 processors; 2G central storage, 6G expanded storage; real MDC: default, xstor MDC: 512M; 11800 CMS1 users; internal TPNS; CMS and GCS are 2.4.0; T=TPNS, H=Hardware Monitor, Unmarked=VMPRF | |||
Back to Table of Contents.
2064-1C8, 2G/10G
Workload: CMS1 with Internal TPNS:
Processor model:            2064-1C8
Processors used:            8
Storage:
    Real:                   2GB (default MDC)
    Expanded:               10GB (MDC fixed at 512M)

DASD:
Type of DASD | Control Unit | Number of Paths |
|
| - Number of Volumes - TDSK |
|
|
|
|---|---|---|---|---|---|---|---|---|
| 3390-3 | RVA T82 | 8 | 15 | 8 | 4 | 150 | | 2 |
Note: The DASD volumes are distributed across 13 RVA T82 subsystems. Each subsystem has 1536M of cache.
Driver:                    TPNS
Think time distribution:   Bactrian
CMS block size:            4KB

Virtual Machines:
Virtual Machine |
|
| Machine Size |
|
|
|
|---|---|---|---|---|---|---|
| TP1 | 1 | TPNS | 256M | 5000 | 14000 | QUICKDSP ON |
| TCPIPn | 4 | TCPIP | 512M | 3000 | 14000 | QUICKDSP ON |
| WRITER | 1 | CP monitor | 2M | 100 | | QUICKDSP ON |
| Unnnnn | 10800 | Users | 3M | 100 | |
For this environment, real storage is sufficiently constrained that there is heavy paging to expanded storage. However, expanded storage is sufficiently large that DASD paging is essentially eliminated.
The measurement results are summarized in the following two tables. The first table contains the absolute results, while the second table show the results as ratios relative to the VM/ESA 2.4.0 base case. RTM and TPNS log data were not collected for these measurements. When available, corresponding VMPRF data has been substituted for the RTM data normally shown.
The results show that total processing requirements (PBT/CMD (H)) of z/VM 3.1.0 with 31-bit CP are equivalent to VM/ESA 2.4.0. Total processing requirements of z/VM 3.1.0 with 64-bit CP are about 1.5% higher than these as the result of a 5.7% increase in CP CPU time (CP/CMD (H)).
These results focus on migration of CP to z/VM 3.1.0. The CMS and GCS components were kept at the VM/ESA 2.4.0 level for all three measurements. This means that the z/VM 3.1.0 results do not include the effects of the Rexx runtime improvement (see Miscellaneous CMS Improvements), which reduces total CPU time per command command by about 0.2% for this workload.
Table 1. CMS-Intensive Migration from VM/ESA 2.4.0: 2064-1C8, 2G/10G
Release (CP) CP Run ID | 2.4.0 31 bit E240G823 | 3.1.0 31 bit E1228822 | 3.1.0 64 bit E1228824 |
|---|---|---|---|
Response Time TRIV INT NONTRIV INT TOT INT |
|
|
|
Throughput ETR (T) ITR (H) |
|
|
|
Proc. Usage PBT/CMD (H) CP/CMD (H) EMUL/CMD (H) |
|
|
|
Processor Util. TOTAL (H) UTIL/PROC (H) UTIL/PROC TOTAL EMUL (H) TOTAL EMUL MASTER TOTAL MASTER CP MASTER EMUL TVR(H) TVR |
|
|
|
Paging READS/SEC WRITES/SEC PAGE/CMD PAGE IO RATE PAGE IO/CMD XSTOR IN/SEC XSTOR OUT/SEC XSTOR/CMD |
|
|
|
Queues ELIGIBLE LIST |
|
|
|
I/O RIO RATE RIO/CMD NONPAGE RIO/CMD DASD RESP TIME MDC REAL SIZE (MB) MDC XSTOR SIZE (MB) MDC HIT RATIO |
|
|
|
PRIVOPs PRIVOP/CMD DIAG/CMD |
|
|
|
| Note: 2064-1C8; 8 processors; 2G central storage, 10G expanded storage; real MDC: default, xstor MDC: 512M; 11800 CMS1 users; internal TPNS; CMS and GCS are 2.4.0; T=TPNS, H=Hardware Monitor, Unmarked=VMPRF | |||
Table 2. CMS-Intensive Migration from VM/ESA 2.4.0: 2064-1C8, 2G/10G - Ratios
Release (CP) CP Run ID | 2.4.0 31 bit E240G823 | 3.1.0 31 bit E1228822 | 3.1.0 64 bit E1228824 |
|---|---|---|---|
Response Time TRIV INT NONTRIV INT TOT INT |
|
|
|
Throughput ETR (T) ITR (H) |
|
|
|
Proc. Usage PBT/CMD (H) CP/CMD (H) EMUL/CMD (H) |
|
|
|
Processor Util. TOTAL (H) UTIL/PROC (H) UTIL/PROC TOTAL EMUL (H) TOTAL EMUL MASTER TOTAL MASTER CP MASTER EMUL TVR(H) TVR |
|
|
|
Paging WRITES/SEC PAGE/CMD XSTOR IN/SEC XSTOR OUT/SEC XSTOR/CMD |
|
|
|
I/O RIO RATE RIO/CMD NONPAGE RIO/CMD DASD RESP TIME MDC REAL SIZE (MB) MDC XSTOR SIZE (MB) MDC HIT RATIO |
|
|
|
PRIVOPs PRIVOP/CMD DIAG/CMD |
|
|
|
| Note: 2064-1C8; 8 processors; 2G central storage, 10G expanded storage; real MDC: default, xstor MDC: 512M; 11800 CMS1 users; internal TPNS; CMS and GCS are 2.4.0; T=TPNS, H=Hardware Monitor, Unmarked=VMPRF | |||
Back to Table of Contents.
VSE/ESA Guest
This section examines the performance of migrating a VSE/ESA guest from VM/ESA 2.4.0 to z/VM 3.1.0 31-bit CP and to z/VM 3.1.0 64-bit CP. All measurements were made on a 2048-109 using the DYNAPACE workload. DYNAPACE is a batch workload that is characterized by heavy I/O. See VSE Guest (DYNAPACE) for a description of this workload.
Measurements were obtained with the VSE/ESA system run as a V=R guest and as a V=V guest. The V=R guest environment had dedicated DASD with I/O assist. The V=V guest environment was configured with full pack minidisk DASD with minidisk caching (MDC) active.
Processor model:
    V=R case:               2064-109 in basic mode, 2 processors online
    V=V case:               2064-109 LPAR with 2 dedicated processors
Storage
    Real:                   1GB
    Expanded:               2GB
DASD:
Type of DASD | Control Unit | Number of Paths |
|
| - Number of Volumes - TDSK |
|
|
|
|---|---|---|---|---|---|---|---|---|
| 3390-3 | RAMAC 1 | 4 | | | | 20 | 2 | |
| 3390-3 | RAMAC 2 | 4 | | | | | | 1 |
Note: Each set of RAMAC 1 volumes is behind a 3990-6 control unit with 1024M cache. RAMAC 2 refers to the RAMAC 2 Array Subsystem with 256M cache and drawers in 3390-3 format.
VSE version:  2.1.0 (using the standard dispatcher)

Virtual Machines:
Virtual Machine |
|
| Machine Size/Mode |
|
|
|
|---|---|---|---|---|---|---|
| VSEVR | 1 | VSE V=R | 96MB/ESA | 100 | | IOASSIST ON |
| | | | | | | CCWTRANS OFF |
| or | | | | | | |
| VSEVV | 1 | VSE V=V | 96MB/ESA | 100 | | IOASSIST OFF |
| | ||||||
| WRITER | 1 | CP monitor | 2MB/XA | 100 | | |
| |
Measurement Discussion: The V=R and V=V results are summarized in Table 1 and Table 2 respectively. In each table, the absolute results are shown, followed by the same results expressed as ratios relative to the VM/ESA 2.4.0 base case.
The V=R results for all 3 cases are equivalent within run variability. Likewise, the V=V results are also equivalent within run variability. However, the apparent increases in CP/CMD (H) do suggest that there is some increase in CP overhead as a result of the 64-bit support. These increases, if present, are much lower than the 5.2% to 7.1% increases in CP/CMD (H) that were observed for the z/VM 3.1.0 64-bit case in the CMS-intensive environments (see CMS-Intensive).
Table 1. VSE V=R Guest Migration from VM/ESA 2.4.0
Release CP Runid | 2.4.0 31 bit P3R240G0 | 3.1.0 31 bit P3R12280 | 3.1.0 64 bit P6R12280 |
|---|---|---|---|
UTIL/PROC (H) PBT/CMD (H) CP/CMD (H) EMUL/CMD (H) PERCENT CP (H) RIO/CMD VIO/CMD PRIVOP/CMD DIAG/CMD | 5.54 430.05 23.12 406.93 5.4 855 855 295 268 | 5.48 424.93 22.11 402.82 5.2 854 854 287 268 | 5.50 426.86 23.19 403.67 5.4 855 855 291 271 |
UTIL/PROC (H) PBT/CMD (H) CP/CMD (H) EMUL/CMD (H) PERCENT CP (H) RIO/CMD VIO/CMD PRIVOP/CMD DIAG/CMD | 1.000 1.000 1.000 1.000 1.000 1.000 1.000 1.000 1.000 | 0.989 0.988 0.956 0.990 0.963 0.999 0.999 0.973 1.000 | 0.993 0.993 1.003 0.992 1.000 1.000 1.000 0.986 1.011 |
| Note: 2048-109; basic mode; 2 online processors; 1G/2G central/expanded storage; dedicated DASD; IOASSIST ON; DYNAPACE workload; H=Hardware Monitor, Unmarked=VMPRF | |||
Table 2. VSE V=V Guest Migration from VM/ESA 2.4.0
Release CP Runid | 2.4.0 31 bit P3V240G4 | 3.1.0 31 bit P3V12101 | 3.1.0 64 bit P6V12101 |
|---|---|---|---|
UTIL/PROC (H) PBT/CMD (H) CP/CMD (H) EMUL/CMD (H) PERCENT CP (H) MDC REAL SIZE (MB) MDC XSTOR SIZE (MB) MDC HIT RATIO RIO/CMD VIO/CMD PRIVOP/CMD DIAG/CMD | 8.78 492.79 81.74 411.05 16.6 279 9 95.3 510 1170 9820 269 | 8.76 491.33 82.30 409.03 16.8 290 9 94.7 515 1171 9826 272 | 8.71 488.64 83.52 405.13 17.1 299 8 95.3 510 1171 9828 272 |
UTIL/PROC (H) PBT/CMD (H) CP/CMD (H) EMUL/CMD (H) PERCENT CP (H) MDC REAL SIZE (MB) MDC XSTOR SIZE (MB) MDC HIT RATIO RIO/CMD VIO/CMD PRIVOP/CMD DIAG/CMD | 1.000 1.000 1.000 1.000 1.000 1.000 1.000 1.000 1.000 1.000 1.000 1.000 | 0.998 0.997 1.007 0.995 1.012 1.039 1.000 0.994 1.010 1.001 1.001 1.011 | 0.992 0.992 1.022 0.986 1.030 1.072 0.889 1.000 1.000 1.001 1.001 1.011 |
| Note: 2048-109; LPAR; 2 dedicated processors; 1G/2G central/expanded storage; VSE DASD attached as full pack minidisks; MDC stor: default; MDC xstor: bias 0.1; DYNAPACE workload; H=Hardware Monitor, Unmarked=VMPRF | |||
Back to Table of Contents.
TCP/IP
Telnet and FTP measurements were obtained to evaluate the performance effects of migrating from TCP/IP Function Level 320 to TCP/IP for z/VM Level 3A0. These results are summarized in the following two sections.
Back to Table of Contents.
Telnet
Workload: CMS1 with External TPNS:
Processor model:            2064-109 LPAR
Processors used:            2 dedicated
Storage:
    Real:                   1GB (default MDC)
    Expanded:               2GB (MDC BIAS 0.1)

DASD:
Type of DASD | Control Unit | Number of Paths |
|
| - Number of Volumes - TDSK |
|
|
|
|---|---|---|---|---|---|---|---|---|
| 3390-3 | RAMAC 1 | 4 | | | | 16 | | |
| 3390-3 | RAMAC 1 | 4 | | | | 16 | | |
| 3390-3 | RAMAC 2 | 4 | 18 | 6 | 2 | | | |
| 3390-2 | 3990-3 | 4 | 4 | | 2 | | | 2 |
Note: Each set of RAMAC 1 volumes is behind a 3990-6 control unit with 1024M cache. RAMAC 2 refers to the RAMAC 2 Array Subsystem with 256M cache and drawers in 3390-3 format.
Driver:                    TPNS
Think time distribution:   Bactrian
CMS block size:            4KB

Virtual Machines:
Virtual Machine |
|
| Machine Size |
|
|
|
|---|---|---|---|---|---|---|
| SMART | 1 | RTM | 32M | 3% | 400 | QUICKDSP ON |
| TCPIP | 1 | TCPIP | 256M | 3000 | 14000 | QUICKDSP ON |
| WRITER | 1 | CP monitor | 2M | 100 | | QUICKDSP ON |
| Unnnn | 3420 | Users | 3M | 100 | |
TCP/IP 3A0 performance appears to be slightly better than TCP/IP
320 for the measured Telnet environment, as indicated by TCPIP
Machine TOT CPU/CMD (V). The 0.6% decrease is similar to the
average 1% decrease that was observed for the FTP workloads (see
FTP).
Table 1. Migration from TCP/IP VM FL 320: Telnet
TCP/IP Release Run ID | 320 72BC3421 | 3A0 72BC3420 |
|
|
|---|---|---|---|---|
Response Time TRIV INT NONTRIV INT TOT INT TOT INT ADJ AVG FIRST (T) AVG LAST (T) |
|
|
|
|
Throughput AVG THINK (T) ETR ETR (T) ETR RATIO ITR (H) ITR EMUL ITR ITRR (H) ITRR |
|
|
|
|
Proc. Usage PBT/CMD (H) PBT/CMD CP/CMD (H) CP/CMD EMUL/CMD (H) EMUL/CMD |
|
|
|
|
Processor Util. TOTAL (H) TOTAL UTIL/PROC (H) UTIL/PROC TOTAL EMUL (H) TOTAL EMUL MASTER TOTAL MASTER EMUL TVR(H) TVR |
|
|
|
|
Storage NUCLEUS SIZE (V) TRACE TABLE (V) WKSET (V) PGBLPGS PGBLPGS/USER TOT PAGES/USER (V) FREEPGS FREE UTIL SHRPGS |
|
|
|
|
Paging READS/SEC WRITES/SEC PAGE/CMD PAGE IO RATE (V) PAGE IO/CMD (V) XSTOR IN/SEC XSTOR OUT/SEC XSTOR/CMD FAST CLR/CMD |
|
|
|
|
Queues DISPATCH LIST ELIGIBLE LIST |
|
|
|
|
I/O VIO RATE VIO/CMD RIO RATE (V) RIO/CMD (V) NONPAGE RIO/CMD (V) DASD RESP TIME (V) MDC REAL SIZE (MB) MDC XSTOR SIZE (MB) MDC READS (I/Os) MDC WRITES (I/Os) MDC AVOID MDC HIT RATIO |
|
|
|
|
PRIVOPs PRIVOP/CMD DIAG/CMD DIAG 04/CMD DIAG 08/CMD DIAG 0C/CMD DIAG 14/CMD DIAG 58/CMD DIAG 98/CMD DIAG A4/CMD DIAG A8/CMD DIAG 214/CMD DIAG 270/CMD SIE/CMD SIE INTCPT/CMD FREE TOTL/CMD |
|
|
|
|
TCPIP Machine WKSET (V) TOT CPU/CMD (V) CP CPU/CMD (V) VIRT CPU/CMD (V) DIAG 98/CMD (V) |
|
|
|
|
| Note: 2064-109; LPAR; 2 dedicated processors; LPAR Storage: 1G central, 2G expanded; VM/ESA 2.4.0; real MDC: default; xstor MDC: bias 0.1; 3420 CMS1 users; External TPNS; T=TPNS, V=VMPRF, H=Hardware Monitor, Unmarked=RTM | ||||
Back to Table of Contents.
FTP
The measured system consisted of a 2064-109 processor configured as an LPAR with 2 dedicated processors, 1G of central storage, and 2G of expanded storage. This system was running z/VM 3.1.0 (the 64-bit CP was used) with TCP/IP VM Function Level 320 or 3A0. This system was attached to a 16 Mbit IBM Token Ring through an OSA-2 card. File transfer was to/from an RS/6000 model 250 running AIX 4.2.1 that was connected to the same token ring.
The following TCP/IP tuning was used:
- DATABUFFERPOOLSIZE 32768
- MTU 4000
The workload consisted of a number of consecutive identical FTP file transfers (get or put) initiated by a client virtual machine on the VM system. For the 2 Megabyte files, there were 50 file transfers; for the 24 Kilobyte files, there were 500 file transfers. These file transfers were to/from the client virtual machine's 191 minidisk, which was enabled for minidisk caching and defined on a 3390-3 DASD volume.
The measurement results are summarized in Table 1, Table 2, and Table 3. For each table, the absolute results are first shown, followed by the TCP/IP 3A0 to TCP/IP 320 ratios.
Table 1. FTP Performance: Get 2MB Files
Run Id Mode TCP/IP Release | G2M_AF2A ASCII 320 | G2M_AFAA ASCII 3A0 | G2M_BF2A Binary 320 | G2M_BFAA Binary 3A0 |
|---|---|---|---|---|
Rate (KB/sec) TCPIP CPU/KB (msec) VM Client CPU/KB Total CPU/KB | 458.8 0.022 0.032 0.054 | 459.0 0.022 0.032 0.054 | 920.0 0.021 0.007 0.028 | 920.0 0.020 0.007 0.027 |
Rate (KB/sec) TCPIP CPU/KB (msec) VM Client CPU/KB Total CPU/KB | 1.000 1.000 1.000 1.000 | 1.000 1.000 1.000 1.000 | 1.000 1.000 1.000 1.000 | 1.000 0.952 1.000 0.964 |
| Note: VM client: 2048-109, LPAR, 2 dedicated processors, zVM 3.1.0 with 64 bit CP; AIX server: RS/6000 Model 250; 16 Mbit IBM Token Ring | ||||
Table 2. FTP Performance: Get 24KB Files
Run Id Mode TCP/IP Release | G24KAF2A ASCII 320 | G24KAFAA ASCII 3A0 | G24KBF2A Binary 320 | G24KBFAA Binary 3A0 |
|---|---|---|---|---|
Rate (KB/sec) TCPIP CPU/KB (msec) VM Client CPU/KB Total CPU/KB | 136.4 0.082 0.137 0.219 | 136.2 0.083 0.137 0.220 | 188.7 0.079 0.110 0.189 | 188.1 0.078 0.109 0.187 |
Rate (KB/sec) TCPIP CPU/KB (msec) VM Client CPU/KB Total CPU/KB | 1.000 1.000 1.000 1.000 | 0.999 1.012 1.000 1.005 | 1.000 1.000 1.000 1.000 | 0.997 0.987 0.991 0.989 |
| Note: VM client: 2048-109, LPAR, 2 dedicated processors, zVM 3.1.0 with 64 bit CP; AIX server: RS/6000 Model 250; 16 Mbit IBM Token Ring | ||||
Table 3. FTP Performance: Put 2MB and 24KB Binary Files
Run Id TCP/IP Release | P2M_BF2A 320 | P2M_BFAA 3A0 | P24KBF2A 320 | P24KBFAA 3A0 |
|---|---|---|---|---|
Rate (KB/sec) TCPIP CPU/KB (msec) VM Client CPU/KB Total CPU/KB | 1222.0 0.027 0.005 0.032 | 1227.8 0.027 0.005 0.032 | 560.7 0.093 0.094 0.187 | 558.1 0.093 0.093 0.186 |
Rate (KB/sec) TCPIP CPU/KB (msec) VM Client CPU/KB Total CPU/KB | 1.000 1.000 1.000 1.000 | 1.005 1.000 1.000 1.000 | 1.000 1.000 1.000 1.000 | 0.995 1.000 0.989 0.995 |
| Note: VM client: 2048-109, LPAR, 2 dedicated processors, zVM 3.1.0 with 64 bit CP; AIX server: RS/6000 Model 250; 16 Mbit IBM Token Ring | ||||
The CPU data were obtained from the CP QUERY TIME command. The elapsed times were obtained by summing the elapsed times reported for each file transfer by FTP's console messages. All results shown are the average of 2 trials.
The 6 measured FTP cases showed equivalent throughput and a slight improvement (average of 1%) in total CPU requirements relative to TCP/IP FL 320.
Back to Table of Contents.
Migration from Other VM Releases
The performance results provided here apply to migration from VM/ESA 2.4.0. This section discusses how to use the information in this report along with similar information from earlier reports to get an understanding of the performance of migrating from earlier VM releases.
Note: In this section, VM/ESA releases prior to VM/ESA 2.1.0 are referred to without the version number. For example, VM/ESA 2.2 refers to VM/ESA Version 1 Release 2.2.
Migration Performance Measurements Matrix
The matrix on the following page is provided as an index to all the performance measurements pertaining to VM migration that are available in the VM performance reports. The numbers that appear in the matrix indicate which report includes migration results for that case: (Ref #1.)
10 | VM/ESA Release 1.0 Performance Report |
11 | VM/ESA Release 1.1 Performance Report |
20 | VM/ESA Release 2.0 Performance Report |
21 | VM/ESA Release 2.1 Performance Report |
22 | VM/ESA Release 2.2 Performance Report |
210 | VM/ESA Version 2 Release 1.0 Performance Report |
220 | VM/ESA Version 2 Release 2.0 Performance Report |
230 | VM/ESA Version 2 Release 3.0 Performance Report |
240 | VM/ESA Version 2 Release 4.0 Performance Report |
310 | z/VM Performance Report (this document) |
See Referenced Publications for more information on these reports.
Most of the comparisons listed in the matrix are for two consecutive VM releases. For migrations that skip one or more VM releases, you can get a general idea how the migration will affect performance by studying the applicable results for those two or more comparisons that, in combination, span those VM releases. For example, to get a general understanding of how migrating from VM/ESA 2.3.0 to z/VM 3.1.0 will tend to affect VSE guest performance, look at the VM/ESA 2.3.0 to VM/ESA 2.4.0 comparison measurements and the VM/ESA 2.4.0 to z/VM 3.1.0 comparison measurements. In each case, use the measurements from the system configuration that best approximates your VM system.
The comparisons listed for the CMS-intensive environment include both minidisk-only and SFS measurements. Internal throughput rate ratio (ITRR) information for the minidisk-only CMS-intensive environment has been extracted from the CMS comparisons listed in the matrix and is summarized in "Migration Summary: CMS-Intensive Environment".
Table 1. Sources of VM Migration Performance Measurement Results
|
Source
|
Target
|
Processor
|
Report Number
| |||
|---|---|---|---|---|---|---|
|
CMS
|
OV/VM
|
VSE
Guest
|
MVS
Guest
| |||
VM/SP 5
| VM/ESA 1.0 (370) VM/ESA 1.0 (370) VM/ESA 1.0 (370) VM/ESA 2.0 VM/ESA 2.0 | 4381-13 9221-170 9221-120 9221-170 9221-120 | 10
|
|
|
|
VM/SP 6
| VM/ESA 1.0 (370)
| 4381-13 9370-80 9370-30 | 10 10 10 |
|
|
|
VM/SP HPO5
| VM/ESA 1.0 (ESA) VM/ESA 2.0 VM/ESA 2.0 | 3090*-200J 9121-480 9121-320 | 10 20 20 |
|
|
|
VM/ESA 1.0 (370)
| VM/ESA 1.5 (370) VM/ESA 1.1 VM/ESA 2.0 VM/ESA 2.0 | 9221-120 9221-170 9221-170 9221-120 | 22 11 20 20 |
|
|
|
VM/XA 2.0 | VM/ESA 1.0 (ESA) | 3090-600J | 10 |
|
|
|
VM/XA 2.1
| VM/ESA 1.0 (ESA) VM/ESA 1.0 (ESA) VM/ESA 1.0 (ESA) VM/ESA 1.0 (ESA) VM/ESA 1.1 VM/ESA 1.1 | 3090-600J 3090-200J 9021-720 9121-320 9021-720 9121-320 | 10 10
|
|
| 10
|
VM/ESA 1.0 (ESA)
| VM/ESA 1.1
| 3090-600J 9021-720 9021-580 9121-480 9121-320 9221-170 |
|
|
| 11
|
VM/ESA 1.1
| VM/ESA 2.0
| 9021-900 9021-720 9121-480 9121-320 9221-170 | 20
|
|
| 20
|
VM/ESA 2.0
| VM/ESA 2.1
| 9121-742 9121-480 9121-320 9221-170 | 21 21
| 21 21
|
|
|
VM/ESA 2.1
| VM/ESA 2.2
| 9121-742 9121-480 9121-320 9221-170 | 22 22
|
|
|
|
VM/ESA 2.2
| VM/ESA 2.1.0
| 9121-742 9121-480 9121-320 9221-170 | 210 210
|
|
|
|
VM/ESA 2.1.0
| VM/ESA 2.2.0
| 9121-742 9672-R53 9121-480 9121-320 | 220 220 220
|
|
|
|
VM/ESA 2.2.0
| VM/ESA 2.3.0
| 9121-742 9121-480 9121-320 | 230 230
|
|
|
|
VM/ESA 2.3.0
| VM/ESA 2.4.0
| 9121-742 9121-480 9121-320 | 240 240
|
|
|
|
VM/ESA 2.4.0
| z/VM 3.1.0
| 2064-102 2064-108 | 310 310 |
| 310
|
|
Migration Summary: CMS-Intensive Environment
A large body of performance information for the CMS-intensive environment has been collected over the last several releases of VM. This section summarizes the internal throughput rate (ITR) data from those measurements to show, for CMS-intensive workloads, the approximate changes in processing capacity that may occur when migrating from one VM release to another. As such, this section can serve as one source of migration planning information.
The performance relationships shown here are limited to the minidisk-only CMS-intensive environment. Other types of VM usage may show different relationships. Furthermore, any one measure such as ITR cannot provide a complete picture of the performance differences between VM releases. The VM performance reports can serve as a good source of additional performance information.
Table 2
summarizes the approximate ITR relationships
for the CMS-intensive environment for migrations to z/VM 3.1.0.
Table 2. Approximate z/VM 3.1.0 Relative Capacity: CMS-Intensive Environment
Source | Case | ITRR | Notes |
|---|---|---|---|
VM/SP 5 | 9221-120 | 0.90 | 1,2,5,6 |
VM/SP 6 | 9221-120 | 1.05 | 2,5,6 |
VM/ESA 1.0 (370)
| 9221-120 9221-170 | 0.98 1.05 | 2,5,6 4-6 |
VM/ESA 1.5 (370)
| 9221-120 9221-170 | 0.96 1.03 | 2,5,6 4-6 |
VM/SP HPO 5
| UP MP | 0.99 1.10 | 4-6 3-6 |
VM/XA 2.0 |
| 1.22 | 6 |
VM/XA 2.1 |
| 1.19 | 6 |
VM/ESA 1.0 ESA |
| 1.15 | 6 |
VM/ESA 1.1 |
| 1.10 | 6 |
VM/ESA 2 |
| 1.09 | 6 |
VM/ESA 2.1 |
| 1.08 | 6 |
VM/ESA 2.2 |
| 1.05 | 6 |
VM/ESA 2.1.0 |
| 1.00 |
|
VM/ESA 2.2.0 |
| 0.99 |
|
VM/ESA 2.3.0 |
| 0.99 |
|
VM/ESA 2.4.0 |
| 1.00 |
|
Explanation of columns:
Case | The set of conditions for which the stated ITRR approximately applies. When not specified, no large variations in ITRR were found among the cases that were measured. |
ITRR | z/VM 3.1.0 ITR divided by the source ITR. A number greater than 1.00 indicates an improvement in processor capacity. |
Notes | Applicable notes (described below). |
- The VM/SP 5 system is assumed to include APAR VM30315, the performance SPE that adds segment protection and 4KB key support. Other measurements have shown that VM/SP 5 ITR is 4% to 6% lower without this APAR.
- This includes an increase of central storage from 16MB to 32MB to compensate for VM/ESA's larger storage requirements. The VM/ESA case also includes 16MB of expanded storage for minidisk caching.
- The VM/SP HPO 5 to VM/ESA 1.0 (ESA Feature) portion of the derivation was done with a reduced think time to avoid a 16MB-line real storage constraint in the HPO case. In cases where the base HPO system is 16MB-line constrained, migration to VM/ESA will yield additional performance benefits by eliminating this constraint.
- z/VM 3.1.0 supports a larger real memory size than the stated migration source and this potential benefit is not reflected in the stated ITR ratios. Migrations from memory-constrained environments may yield additional ITRR and other performance benefits when the z/VM 3.1.0 system has additional real storage.
- There has been growth in CMS real storage requirements on a per user basis. This growth is reflected in the ITR ratios to only a limited extent and should therefore be taken into consideration separately. The most significant growth took place in VM/SP 6 and in VM/ESA 2.0. The VM/SP 6 increase can affect the performance of migrations from VM/SP 5 and VM/SP HPO 5. The VM/ESA 2.0 growth can affect the performance of migrations from VM releases prior to VM/ESA 2.0. Storage constrained environments with large numbers of CMS users will be the most affected.
- This ITRR value depends strongly upon the fact that CMS is now shipped with most of its REXX execs and XEDIT macros compiled (see Performance Improvements). If these are already compiled on your system, divide the ITRR shown by 1.07.
The ITRR estimates in Table 2 assume use of the z/VM 3.1.0 31-bit CP. If you are using the 64-bit CP, multiply the ITRR shown by 0.99 and refer to note 4 to see if it applies.
Table 2 only shows performance in terms of ITR ratios (processor capacity). It does not provide, for example, any response time information. An improved ITR tends to result in better response times and vice versa. However, exceptions occur. An especially noteworthy exception is the migration from 370-based VM releases to VM/ESA. In such migrations, response times have frequently been observed to improve significantly, even in the face of an ITR decrease. One pair of measurements, for example, showed a 30% improvement in response time, even though ITR decreased by 5%. When this occurs, factors such as XA I/O architecture and minidisk caching outweigh the adverse effects of increased processor usage. These factors have a positive effect on response time because they reduce I/O wait time, which is often the largest component of system response time.
Keep in mind that in an actual migration to a new VM release, other factors (such as hardware, licensed product release levels, and workload) are often changed in the same time frame. It is not unusual for the performance effects from upgrading VM to be outweighed by the performance effects from these additional changes.
These VM ITRR estimates can be used in conjunction with the appropriate hardware ITRR figures to estimate the overall performance change that would result from migrating both hardware and VM. For example, suppose that the new processor's ITR is 1.30 times that of the current system and suppose that the migration also includes an upgrade from VM/ESA 2.1 to z/VM 3.1.0. From Table 2, the estimated ITRR for migrating from VM/ESA 2.1 to z/VM 3.1.0 is 1.08. Therefore, the estimated overall increase in system capacity is 1.30*1.08 = 1.40.
Table 2 represents CMS-intensive performance for the case where all files are on minidisks. The release-to-release ITR ratios for shared file system (SFS) usage are very similar to the ones shown here.
Back to Table of Contents.
New Functions
A number of the functional enhancements in z/VM 3.1.0 and TCP/IP VM Function Level 3A0 have performance implications. This section contains performance evaluation results for the following functions:
- CP 64 Bit Support
- Queued Direct I/O Support
- Secure Sockets Layer Support
Back to Table of Contents.
CP 64-Bit Support
z/VM 3.1.0 introduces support in CP for 64-bit addressing. One important aspect of this support is that the 64-bit version of CP is now able to run in real storage sizes greater than 2 Gigabytes. The performance implications of this support are the subject of the following 3 sections:
Real Storage Sizes above 2G
Minidisk Cache with Large Real Storage
The 2G Line
Back to Table of Contents.
Real Storage Sizes above 2G
This section presents a series of measurements that explore the performance characteristics of z/VM 3.1.0 when running the 64-bit CP in real storage sizes larger than 2 Gigabytes. The approach taken was to hold total storage constant, while varying the amount of that storage that is configured as real (central) storage versus expanded storage. 1 For each measured storage configuration, multiple measurements were done using various minidisk cache tuning settings. In this section, all results shown are "tuned MDC" cases where the MDC settings gave good results for that storage configuration. The next section, Minidisk Cache with Large Real Storage, focuses on the performance that results from various MDC tuning strategies.
Two sets of measurements are provided: one with total storage fixed at 8G and one with total storage fixed at 12G. The 8G size is small enough that some DASD paging results. With the 12G size, total storage is large enough that DASD paging is essentially eliminated and all remaining paging, if any, occurs to expanded storage.
All measurements were obtained on the same 2064-1C8 8-way configuration described on page , but with various configurations of real and expanded storage. There were 10,800 CMS1 users, driven by internal TPNS, resulting in an average processor utilization of about 90%. Hardware instrumentation, CP monitor, and TPNS throughput data were collected for each measurement.
For the measured 8-way configuration, the results show that increasing real storage beyond 2G does result in improved performance but that the improvements are only on the order of a few percent. This is to be expected because past large system measurements have consistently shown that CP is very efficient at using expanded storage as a place to temporarily put user pages that do not fit into real storage while that user is dormant (thinking) between requests. When the workload is so heavy that the pages needed by actively running users do not all fit into real storage, CP will start forming an eligible list to prevent thrashing between real and expanded storage. It is in that situation where the ability to configure real storage larger than 2G can result in dramatic performance improvements.
Total Storage: 8G
Measurements were obtained in storage configurations ranging from 2G real and 6G expanded (2G/6G) to 8G/0G. The results are summarized in Table 1 and Table 2. Table 1 shows the absolute results, while Table 2 shows the results as ratios relative to the 2G/6G base run.
Table 1. CMS1 with 8G Total Storage
Real Storage Expanded Storage MDC Real MDC Xstor Run ID | 2G 6G default 512M E1228826 | 4G 4G 160M 512M E0104845 | 6G 2G 202M 476M E0104864 | 8G 0G 672M 0M E0104880 |
|---|---|---|---|---|
Response Time TRIV INT NONTRIV INT TOT INT |
|
|
|
|
Throughput ETR (T) ITR (H) |
|
|
|
|
Proc. Usage PBT/CMD (H) CP/CMD (H) EMUL/CMD (H) |
|
|
|
|
Processor Util. TOTAL (H) UTIL/PROC (H) TOTAL EMUL (H) TOTAL EMUL TVR(H) TVR |
|
|
|
|
Paging READS/SEC WRITES/SEC PAGE/CMD PAGE IO RATE PAGE IO/CMD XSTOR IN/SEC XSTOR OUT/SEC XSTOR/CMD |
|
|
|
|
I/O RIO RATE RIO/CMD NONPAGE RIO/CMD DASD RESP TIME MDC REAL SIZE (MB) MDC XSTOR SIZE (MB) MDC TOTAL SIZE (MB) MDC HIT RATIO |
|
|
|
|
PRIVOPs PRIVOP/CMD DIAG/CMD |
|
|
|
|
| Note: 2064-1C8, 8 processors, 10800 users, internal TPNS, T=TPNS, H=Hardware Monitor, Unmarked=VMPRF | ||||
Table 2. CMS1 with 8G Total Storage - Ratios
Real Storage Expanded Storage MDC Real MDC Xstor Run ID | 2G 6G default 512M E1228826 | 4G 4G 160M 512M E0104845 | 6G 2G 202M 476M E0104864 | 8G 0G 672M 0M E0104880 |
|---|---|---|---|---|
Response Time TRIV INT NONTRIV INT TOT INT |
|
|
|
|
Throughput ETR (T) ITR (H) |
|
|
|
|
Proc. Usage PBT/CMD (H) CP/CMD (H) EMUL/CMD (H) |
|
|
|
|
Processor Util. TOTAL (H) UTIL/PROC (H) TOTAL EMUL (H) TOTAL EMUL TVR(H) TVR |
|
|
|
|
Paging READS/SEC WRITES/SEC PAGE/CMD PAGE IO RATE PAGE IO/CMD XSTOR IN/SEC XSTOR OUT/SEC XSTOR/CMD |
|
|
|
|
I/O RIO RATE RIO/CMD NONPAGE RIO/CMD DASD RESP TIME MDC REAL SIZE (MB) MDC XSTOR SIZE (MB) MDC TOTAL SIZE (MB) MDC HIT RATIO |
|
|
|
|
PRIVOPs PRIVOP/CMD DIAG/CMD |
|
|
|
|
| Note: 2064-1C8, 8 processors, 10800 users, internal TPNS, T=TPNS, H=Hardware Monitor, Unmarked=VMPRF | ||||
The best overall performance was achieved in the 6G/2G configuration. Relative to the 2G/6G base measurement, throughput (ETR (T)) was 1.3% better, while processor efficiency, as measured by PBT/CMD (H), was 2.1% better (the ratio is 0.979). The 8G/0G configuration showed even better processor efficiency (a 4.4% improvement relative to the base configuration) but throughput dropped by 5.2%, indicating an increase in external response time. 2 This finding is consistent with what we have observed in the past for smaller storage configurations. It benefits response time to configure some of the storage as expanded storage because it then serves as a high speed paging device that will tend to contain the most frequently needed pages, thus avoiding in many cases the much longer delay of waiting for pages to be brought in from DASD.
Although the 2G/6G base case ran fine with default real MDC tuning (real MDC size selected by the real storage arbiter, bias of 1), we learned that for real storage sizes greater than 2G it was important to constrain the real MDC size in some way in order to get the best performance. This is discussed further in Minidisk Cache with Large Real Storage. For these measurements, we decided to constrain the real storage MDC by setting it to a fixed size chosen such that the total MDC cache size (real MDC plus expanded MDC) is approximately equal to the size that resulted in the 2G/6G base run. This was done in an effort to eliminate total MDC size as a factor influencing overall performance in this series of measurements.
Total Storage: 12G
This total storage size is large enough that DASD paging is essentially eliminated. Measurements were obtained in storage configurations ranging from 2G/10G to 12G/0G. The absolute and relative results are summarized in Table 3 and Table 4 respectively.
Table 3. CMS1 with 12G Total Storage
Real Storage Expanded Storage MDC Real MDC Xstor Run ID | 2G 10G 100M 300M E0104822 | 4G 8G 200M 200M E010484D | 10G 2G 400M none E01048A6 | 12G 0G 400M none E01048C0 |
|---|---|---|---|---|
Response Time TRIV INT NONTRIV INT TOT INT |
|
|
|
|
Throughput ETR (T) ITR (H) |
|
|
|
|
Proc. Usage PBT/CMD (H) CP/CMD (H) EMUL/CMD (H) |
|
|
|
|
Processor Util. TOTAL (H) UTIL/PROC (H) TOTAL EMUL (H) TOTAL EMUL TVR(H) TVR |
|
|
|
|
Paging READS/SEC WRITES/SEC PAGE/CMD PAGE IO RATE PAGE IO/CMD XSTOR IN/SEC XSTOR OUT/SEC XSTOR/CMD |
|
|
|
|
I/O RIO RATE RIO/CMD NONPAGE RIO/CMD DASD RESP TIME MDC REAL SIZE (MB) MDC XSTOR SIZE (MB) MDC TOTAL SIZE (MB) MDC HIT RATIO |
|
|
|
|
PRIVOPs PRIVOP/CMD DIAG/CMD |
|
|
|
|
| Note: 2064-1C8, 8 processors, 10800 users, internal TPNS, T=TPNS, H=Hardware Monitor, Unmarked=VMPRF | ||||
Table 4. CMS1 with 12G Total Storage - Ratios
Real Storage Expanded Storage MDC Real MDC Xstor Run ID | 2G 10G 100M 300M E0104822 | 4G 8G 200M 200M E010484D | 10G 2G 400M none E01048A6 | 12G 0G 400M none E01048C0 |
|---|---|---|---|---|
Response Time TRIV INT NONTRIV INT TOT INT |
|
|
|
|
Throughput ETR (T) ITR (H) |
|
|
|
|
Proc. Usage PBT/CMD (H) CP/CMD (H) EMUL/CMD (H) |
|
|
|
|
Processor Util. TOTAL (H) UTIL/PROC (H) TOTAL EMUL (H) TOTAL EMUL TVR(H) TVR |
|
|
|
|
Paging WRITES/SEC PAGE/CMD XSTOR IN/SEC XSTOR OUT/SEC XSTOR/CMD |
|
|
|
|
I/O RIO RATE RIO/CMD NONPAGE RIO/CMD DASD RESP TIME MDC REAL SIZE (MB) MDC XSTOR SIZE (MB) MDC TOTAL SIZE (MB) MDC HIT RATIO |
|
|
|
|
PRIVOPs PRIVOP/CMD DIAG/CMD |
|
|
|
|
| Note: 2064-1C8, 8 processors, 10800 users, internal TPNS, T=TPNS, H=Hardware Monitor, Unmarked=VMPRF | ||||
With 12G total storage, the 10G/2G configuration showed the best overall performance, although 12G/0G performed just about as well. Unlike what we saw with 8G total storage, the no expanded storage case (12G/0G) did not experience any appreciable throughput decrease relative to the configurations that have expanded storage. This is because 12G is large enough that, for this workload, there is little DASD paging to cause response time delays.
For this measurement series, we chose to keep total MDC size constant at 400M so as to minimize the effects of minidisk cache size changes on the performance results. We found that 400M was more than sufficient and resulted in an excellent MDC hit ratio (around 96%).
Footnotes:
- 1
- Storage can still be defined as real or expanded storage on the zSeries 900 processors and z/VM continues to support expanded storage.
- 2
- External response time data requires TPNS logging, which was disabled for these measurements as a simplification. However, the throughput measured by TPNS (ETR (T)) is a good indicator of what is happening to external response time. This is because throughput per user is 1 command / (think time + response time). Average think time is constant for this workload and, as a result, TPNS throughput varies inversely with average external response time.
Back to Table of Contents.
Minidisk Cache with Large Real Storage
The minidisk cache facility comes with tuning parameters on the SET MDCACHE command that can be used to control the size of the real storage minidisk cache and the expanded storage minidisk cache by establishing various kinds of constraints on the real storage arbiter and expanded storage arbiter. For either kind of storage, you can bias the arbiter in favor or against the use of that storage for minidisk caching (rather than paging), set a minimum size, set a maximum size, or set a fixed size.
It is not clear how well the MDC tuning rules of thumb that have worked in the past apply to configurations having more than 2G of real storage. Accordingly, we have done a series of measurements to explore this question, the results of which are presented and discussed in this section.
The approach taken was to focus on the 6G/2G and 10G/2G configurations presented in Real Storage Sizes above 2G. Of the real/expanded storage configurations measured for the 8G total storage case, the 6G/2G configuration resulted in the best performance. Likewise, for the 12G total storage case, the 10G/2G configuration performed best. For both of these storage configurations, we did a series of measurements using various MDC settings.
All measurements were obtained on the 2064-1C8 8-way configuration described on page , but with the 6G/2G and 10G/2G storage configurations. There were 10,800 CMS1 users, driven by internal TPNS, resulting in an average processor utilization of about 90%. Hardware instrumentation, CP monitor, and TPNS throughput data were collected for each measurement. RTM and TPNS response time data were not collected.
MDC Tuning Variations: 6G/2G Configuration
Measurements were obtained with default settings (no constraints on the MDC arbiters, bias=1), with bias 0.1, and with various fixed MDC sizes. The results are summarized in Table 1 and Table 2. Table 1 shows the absolute results, while Table 2 shows the results as ratios relative to E0104864 (third data column) -- the run that was used for the 8G total storage case in section Real Storage Sizes above 2G.
Table 1. MDC Tuning Variations: 6G/2G Configuration
MDC Real MDC Xstor Run ID | default default E0104862 | bias 0.1 bias 0.1 E0104863 | 202M 476M E0104864 | 200M 200M E0104868 | 400M 0M E0104869 |
|---|---|---|---|---|---|
Response Time TRIV INT NONTRIV INT TOT INT |
|
|
|
|
|
Throughput ETR (T) ITR (H) |
|
|
|
|
|
Proc. Usage PBT/CMD (H) CP/CMD (H) EMUL/CMD (H) |
|
|
|
|
|
Processor Util. TOTAL (H) UTIL/PROC (H) TOTAL EMUL (H) TOTAL EMUL TVR(H) TVR |
|
|
|
|
|
Paging READS/SEC WRITES/SEC PAGE/CMD PAGE IO RATE PAGE IO/CMD XSTOR IN/SEC XSTOR OUT/SEC XSTOR/CMD |
|
|
|
|
|
I/O RIO RATE RIO/CMD NONPAGE RIO/CMD DASD RESP TIME MDC REAL SIZE (MB) MDC XSTOR SIZE (MB) MDC TOTAL SIZE (MB) MDC HIT RATIO |
|
|
|
|
|
PRIVOPs PRIVOP/CMD DIAG/CMD |
|
|
|
|
|
| Note: 2064-1C8, 8 processors, 10800 users, internal TPNS, 6G real storage, 2G expanded storage; T=TPNS, H=Hardware Monitor, Unmarked=VMPRF | |||||
Table 2. MDC Tuning Variations: 6G/2G Configuration - Ratios
MDC Real MDC Xstor Run ID | default default E0104862 | bias 0.1 bias 0.1 E0104863 | 202M 476M E0104864 | 200M 200M E0104868 | 400M 0M E0104869 |
|---|---|---|---|---|---|
Response Time TRIV INT NONTRIV INT TOT INT |
|
|
|
|
|
Throughput ETR (T) ITR (H) |
|
|
|
|
|
Proc. Usage PBT/CMD (H) CP/CMD (H) EMUL/CMD (H) |
|
|
|
|
|
Processor Util. TOTAL (H) UTIL/PROC (H) TOTAL EMUL (H) TOTAL EMUL TVR(H) TVR |
|
|
|
|
|
Paging READS/SEC WRITES/SEC PAGE/CMD PAGE IO RATE PAGE IO/CMD XSTOR IN/SEC XSTOR OUT/SEC XSTOR/CMD |
|
|
|
|
|
I/O RIO RATE RIO/CMD NONPAGE RIO/CMD DASD RESP TIME MDC REAL SIZE (MB) MDC XSTOR SIZE (MB) MDC TOTAL SIZE (MB) MDC HIT RATIO |
|
|
|
|
|
PRIVOPs PRIVOP/CMD DIAG/CMD |
|
|
|
|
|
| Note: 2064-1C8, 8 processors, 10800 users, internal TPNS, 6G real storage, 2G expanded storage; T=TPNS, H=Hardware Monitor, Unmarked=VMPRF | |||||
The first measurement shows that default tuning produced very large minidisk cache sizes, resulting in poor performance.
One way to reduce these sizes is to bias against the use of storage for MDC. The second measurement shows that setting bias to 0.1 for both real storage MDC (real MDC) and expanded storage MDC (xstor MDC) produced much more suitable MDC sizes, resulting in greatly improved performance. Additional MDC tuning variations (see measurements 3 and 4, described below) resulted in only slightly better performance than using bias 0.1 for both real and expanded storage.
For the third measurement, we used fixed MDC sizes and reversed the real and xstor MDC sizes. That is, instead of the 476M real MDC and 202M of xstor MDC that resulted from the bias 0.1 settings, we ran with 202M of real MDC and 476M of xstor MDC. The third measurement (with 202M real MDC) showed somewhat better performance, suggesting that it may be better to place much of the MDC in expanded storage.
The fourth and fifth measurements were done with a total MDC size of 400M to see if a smaller size would be better. The fourth measurement (200M real MDC, 200M xstor MDC) showed performance that was essentially equivalent to the third measurement (202M real MDC, 476M xstor MDC). The MDC hit ratio dropped only slightly. The fifth measurement (400M real MDC, no xstor MDC) was slightly degraded. This finding is consistent with the conclusion drawn from comparing measurements 2 and 3 that it is beneficial to have some of the MDC reside in expanded storage.
MDC Tuning Variations: 10G/2G Configuration
Measurements were obtained with various fixed MDC sizes and with various bias settings. The results are summarized in Table 3 and Table 4. Table 3 shows the absolute results, while Table 4 shows the results as ratios relative to E01048A6 (first data column), the run that was used for the 12G total storage case in Real Storage Sizes above 2G.
Table 3. MDC Tuning Variations: 10G/2G Configuration
MDC Real MDC Xstor Run ID | 400M 0M E01048A6 | 200M 200M E01048AD | 0M 400M E01048AE | bias 0.1 bias 0.1 E01048AC | bias 0.05 bias 0.1 E01048AF |
|---|---|---|---|---|---|
Response Time TRIV INT NONTRIV INT TOT INT |
|
|
|
|
|
Throughput ETR (T) ITR (H) |
|
|
|
|
|
Proc. Usage PBT/CMD (H) CP/CMD (H) EMUL/CMD (H) |
|
|
|
|
|
Processor Util. TOTAL (H) UTIL/PROC (H) TOTAL EMUL (H) TOTAL EMUL TVR(H) TVR |
|
|
|
|
|
Paging READS/SEC WRITES/SEC PAGE/CMD PAGE IO RATE PAGE IO/CMD XSTOR IN/SEC XSTOR OUT/SEC XSTOR/CMD |
|
|
|
|
|
I/O RIO RATE RIO/CMD NONPAGE RIO/CMD DASD RESP TIME MDC REAL SIZE (MB) MDC XSTOR SIZE (MB) MDC TOTAL SIZE (MB) MDC HIT RATIO |
|
|
|
|
|
PRIVOPs PRIVOP/CMD DIAG/CMD |
|
|
|
|
|
| Note: 2064-1C8, 8 processors, 10800 users, internal TPNS, 10G real storage, 2G expanded storage; T=TPNS, H=Hardware Monitor, Unmarked=VMPRF | |||||
Table 4. MDC Tuning Variations: 10G/2G Configuration - Ratios
MDC Real MDC Xstor Run ID | 400M 0M E01048A6 | 200M 200M E01048AD | 0M 400M E01048AE | bias 0.1 bias 0.1 E01048AC | bias 0.05 bias 0.1 E01048AF |
|---|---|---|---|---|---|
Response Time TRIV INT NONTRIV INT TOT INT |
|
|
|
|
|
Throughput ETR (T) ITR (H) |
|
|
|
|
|
Proc. Usage PBT/CMD (H) CP/CMD (H) EMUL/CMD (H) |
|
|
|
|
|
Processor Util. TOTAL (H) UTIL/PROC (H) TOTAL EMUL (H) TOTAL EMUL TVR(H) TVR |
|
|
|
|
|
Paging WRITES/SEC PAGE/CMD XSTOR IN/SEC XSTOR OUT/SEC XSTOR/CMD |
|
|
|
|
|
I/O RIO RATE RIO/CMD NONPAGE RIO/CMD DASD RESP TIME MDC REAL SIZE (MB) MDC TOTAL SIZE (MB) MDC HIT RATIO |
|
|
|
|
|
PRIVOPs PRIVOP/CMD DIAG/CMD |
|
|
|
|
|
| Note: 2064-1C8, 8 processors, 10800 users, internal TPNS, 10G real storage, 2G expanded storage; T=TPNS, H=Hardware Monitor, Unmarked=VMPRF | |||||
The first 3 measurements were done with total MDC size held constant at 400M and the real/xstor MDC apportionments set to 400M/0M, 200M/200M, and 0M/400M respectively. The first 2 measurements performed about the same, while the 0M/400M measurement showed somewhat degraded performance. The lower performance of the 0M/400M measurement is consistent with what we have seen in the past for storage configurations when the real MDC size is set too small. Setting the real MDC size to 0 is not recommended and, in some environments, could result in worse performance than is shown here.
The fourth measurement was run with bias 0.1 for both real and xstor MDC. This resulted in good performance even though the real MDC size (925M) was larger than it needed to be. A fifth measurement was done with MDC real bias reduced to 0.05. This reduced the real MDC to 462M but overall performance was essentially equivalent to the fourth measurement.
This 10G/2G configuration appears to be less sensitive to how MDC is tuned than the 6G/2G configuration shown earlier. This makes sense because the larger memory size is better able to withstand tuning settings that less than optimally apportions that memory between MDC and demand paging. This also means that it advisable to draw MDC tuning conclusions from the 6G/2G results.
MDC Tuning Recommendations
These results suggest the following general MDC tuning recommendations when running in large real memory sizes:
- It is important to override the defaults and constrain both
the real MDC arbiter and the expanded storage MDC arbiter.
In the past, we have recommended constraining the MDC expanded arbiter in some way and we have done most of our measurements with bias 0.1 for expanded storage MDC, while staying with default tuning (no constraints) for real storage MDC. However, these results indicate that it is now important to constrain both MDC arbiters. The best way to do this (bias settings, minimum sizes, maximum sizes, or some combination of these) will vary depending on the nature of the system workload and configuration. These tuning actions are implemented using the SET MDCACHE CP command.
How much constraint is enough? Keep an eye on two things: the MDC hit ratio and the paging rate. For example, if an increased constraint does not reduce the MDC hit ratio appreciably and it reduces paging a lot, that is a good indication that the system has benefitted from MDC being constrained and may benefit some more by being further constrained.
- Use a combination of real storage MDC and expanded storage MDC.
The exact balance is probably not too important but the results suggest that it is good to avoid the extreme cases of either no xstor MDC or no real MDC. The results for this workload further suggest that it is better to have much of the minidisk cache, perhaps something like 80%, in expanded storage.
Back to Table of Contents.
The 2G Line
One of the restrictions of the CP 64-bit support is that most data referenced by CP are required to be below the 2G line. 1 In addition to CP's own code and control blocks, this also includes most data that CP needs to reference in the virtual machine address spaces. This includes I/O buffers, IUCV parameter lists, and the like. When CP needs to reference a page that resides in a real storage frame that is above the 2G line, CP, when necessary, dynamically relocates that page to a frame that is below the 2G line.
This process normally has little effect on performance because the pages that need to be below the line are quickly relocated there and they tend to remain there. However, if there is enough demand for frames below the line, pages that had been moved below the line later have to be paged out in order to make room for other pages that must have frames below the line and get paged back in, often above the 2G line, when they are next referenced. This repeated movement of pages can result in degraded performance. The most likely scenario where this problem could develop is when a large percentage of the frames below the 2G line are taken up by a large V=R area.
Measurements were obtained in environments with progressively fewer frames available below the 2G line in order to better understand CP performance as this thrashing situation is approached and to provide some guidance on how many below-the-line frames tend to be required per CMS user.
The measured system was a 2064-109 LPAR, configured with 2 dedicated processors, 3G of real storage, and 1G of expanded storage. See page for I/O subsystem and virtual machine configuration details. The amount of the 3G of real storage actually used by CP was controlled by means of the STORE=nnnnM IPL parameter. Through the use of appropriately chosen STORE sizes and V=R area sizes, five measurement configurations were created where the total amount of available real storage was held constant at 1G and the amount of available real storage that resided below the 2G line were 1G, 0.5G, 0.25G, 0.2G, and 0.1G.
Each measurement was made with 3420 CMS1 users. The real storage minidisk cache size and the expanded storage minidisk cache size were each set to a fixed size of 100M in order to eliminate minidisk cache size as a variable affecting the results. Measurements were successfully completed for the first 4 configurations. The 0.1G configuration was too small and the system was not able to log on all of the users (the system stayed up but entered a "soft hang" situation due to severely degraded performance). The results are summarized in the following two tables. Table 1 shows the absolute results, while Table 2 shows the results relative to the 1G below-the-line base case.
Table 1. 2G Line Constraint Experiment
Available Storage < 2G Run ID | 1G 72CC3422 | 0.5G 72CC3423 | 0.25G 72CC3424 | 0.2G 72CC3425 |
|---|---|---|---|---|
Response Time TRIV INT NONTRIV INT TOT INT TOT INT ADJ AVG FIRST (T) AVG LAST (T) |
|
|
|
|
Throughput AVG THINK (T) ETR ETR (T) ETR RATIO ITR (H) ITR EMUL ITR ITRR (H) ITRR |
|
|
|
|
Proc. Usage PBT/CMD (H) PBT/CMD CP/CMD (H) CP/CMD EMUL/CMD (H) EMUL/CMD |
|
|
|
|
Processor Util. TOTAL (H) TOTAL UTIL/PROC (H) UTIL/PROC TOTAL EMUL (H) TOTAL EMUL MASTER TOTAL MASTER EMUL TVR(H) TVR |
|
|
|
|
Storage NUCLEUS SIZE (V) TRACE TABLE (V) WKSET (V) PGBLPGS PGBLPGS/USER TOT PAGES/USER (V) FREEPGS FREE UTIL SHRPGS 2GPAGES/USER 2GMOVES/SEC |
|
|
|
|
Paging READS/SEC WRITES/SEC PAGE/CMD PAGE IO RATE (V) PAGE IO/CMD (V) XSTOR IN/SEC XSTOR OUT/SEC XSTOR/CMD FAST CLR/CMD |
|
|
|
|
Queues DISPATCH LIST ELIGIBLE LIST |
|
|
|
|
I/O VIO RATE VIO/CMD RIO RATE (V) RIO/CMD (V) NONPAGE RIO/CMD (V) DASD RESP TIME (V) MDC REAL SIZE (MB) MDC XSTOR SIZE (MB) MDC READS (I/Os) MDC WRITES (I/Os) MDC AVOID MDC HIT RATIO |
|
|
|
|
PRIVOPs PRIVOP/CMD DIAG/CMD DIAG 04/CMD DIAG 08/CMD DIAG 0C/CMD DIAG 14/CMD DIAG 58/CMD DIAG 98/CMD DIAG A4/CMD DIAG A8/CMD DIAG 214/CMD DIAG 270/CMD SIE/CMD SIE INTCPT/CMD FREE TOTL/CMD |
|
|
|
|
TCPIP Machine WKSET (V) TOT CPU/CMD (V) CP CPU/CMD (V) VIRT CPU/CMD (V) DIAG 98/CMD (V) |
|
|
|
|
| Note: 2064-109; LPAR; 2 dedicated processors; LPAR storage: 3G central, 1G expanded; available real storage: 1G; 3420 CMS1 users; External TPNS; T=TPNS, V=VMPRF, H=Hardware Monitor, Unmarked=RTM | ||||
Table 2. 2G Line Constraint Experiment - Ratios
Available Storage < 2G Run ID | 1G 72CC3422 | 0.5G 72CC3423 | 0.25G 72CC3424 | 0.2G 72CC3425 |
|---|---|---|---|---|
Response Time TRIV INT NONTRIV INT TOT INT TOT INT ADJ AVG FIRST (T) AVG LAST (T) |
|
|
|
|
Throughput AVG THINK (T) ETR ETR (T) ETR RATIO ITR (H) ITR EMUL ITR |
|
|
|
|
Proc. Usage PBT/CMD (H) PBT/CMD CP/CMD (H) CP/CMD EMUL/CMD (H) EMUL/CMD |
|
|
|
|
Processor Util. TOTAL (H) TOTAL UTIL/PROC (H) UTIL/PROC TOTAL EMUL (H) TOTAL EMUL MASTER TOTAL MASTER EMUL TVR(H) TVR |
|
|
|
|
Storage WKSET (V) PGBLPGS/USER TOT PAGES/USER (V) FREEPGS FREE UTIL SHRPGS 2GPAGES/USER |
|
|
|
|
Paging READS/SEC WRITES/SEC PAGE/CMD PAGE IO RATE (V) PAGE IO/CMD (V) XSTOR IN/SEC XSTOR OUT/SEC XSTOR/CMD FAST CLR/CMD |
|
|
|
|
Queues DISPATCH LIST |
|
|
|
|
I/O VIO RATE VIO/CMD RIO RATE (V) RIO/CMD (V) NONPAGE RIO/CMD (V) DASD RESP TIME (V) MDC REAL SIZE (MB) MDC XSTOR SIZE (MB) MDC READS (I/Os) MDC WRITES (I/Os) MDC AVOID MDC HIT RATIO |
|
|
|
|
PRIVOPs PRIVOP/CMD DIAG/CMD DIAG 04/CMD DIAG 08/CMD DIAG 0C/CMD DIAG 14/CMD DIAG 58/CMD DIAG 98/CMD DIAG A4/CMD DIAG A8/CMD DIAG 214/CMD DIAG 270/CMD SIE/CMD SIE INTCPT/CMD FREE TOTL/CMD |
|
|
|
|
TCPIP Machine WKSET (V) TOT CPU/CMD (V) CP CPU/CMD (V) VIRT CPU/CMD (V) DIAG 98/CMD (V) |
|
|
|
|
| Note: 2064-109; LPAR; 2 dedicated processors; LPAR storage: 3G central, 1G expanded; available real storage: 1G; 3420 CMS1 users; External TPNS; T=TPNS, V=VMPRF, H=Hardware Monitor, Unmarked=RTM | ||||
The results show increasing CP overhead (CP/CMD (H)) as the amount of storage below the 2G line is decreased from 1G to 0.2G but this effect is relatively small. Relative to the 1G base case, CP/CMD (H) increased by 8.4% for the most constrained environment, resulting in a 2.4% decrease in internal throughput (ITR (H)). This workload didn't run with only 0.1G below the 2G line so these results indicate that the adverse performance effects are small until the amount of available storage below 2G gets close to the system thrashing point.
A count of pages moved below the line has been added in z/VM 3.1.0 to the CP monitor data. This is field SYTRSP_PLSMVB2G, located in domain 0 record 4. This count, expressed as pages moved per second, is shown in the Storage section of Table 1 as 2GMOVES/SEC. It is interesting to note that 2GMOVES/SEC is 0 with 1G available below the 2G line, then increases to 659/second with 0.5G, but then does not increase substantially after that. This is analogous to the curve of paging as a function of decreasing storage size. With enough storage, everything fits into memory and there is no paging. This is followed by a transition where an ever larger percentage of each user's working set has to be paged back in when that user becomes active again after think time, followed by a plateau representing the situation where all of a user's pages have been paged out by the time that user becomes active again and have to be paged back in. When available storage becomes sufficiently small, the paging rate rises very steeply as the system starts thrashing the pages required by the active users. The existence of this plateau where PGMOVES/SEC is not very sensitive to decreasing frames below the 2G line decreases your ability to use this value to predict how close the system is operating to the thrashing point. On the other hand, if the page move rate is near zero, you know that the system is not anywhere close to the thrashing point.
Another value called 2GPAGES/USER has also been added to the Storage section of the results tables. It is calculated as the total number of available page frames below the 2G line divided by the number of CMS1 users (3420). Using this number, we can see that, for this workload, somewhere between 38 and 77 frames per user are needed below the 2G line in order to avoid all page move processing. This can be reduced to 19 frames per user without much effect on system performance, but the system hits the thrashing point somewhere between 19 and 15 frames per user.
Footnotes:
- 1
- Also sometimes referred to as the 2G bar.
Back to Table of Contents.
Queued Direct I/O Support
Starting with the IBM G5 CMOS family of processors, a new type of I/O facility called the Queued Direct I/O Hardware Facility is available. This facility is on the OSA Express Adapter and supports the Gigabit Ethernet card, the ATM card, and the Fast Ethernet card.
The QDIO Facility is a functional element on S/390 and zSeries processors that allows a program (TCP/IP) to directly exchange data with an I/O device without performing traditional S/390 I/O instructions. Data transfer is initiated and performed by referencing main storage directly via a set of data queues by both the I/O device and TCP/IP. Once TCP/IP establishes and activates the data queues, there is minimal processor intervention required to perform the direct exchange of data. All data transfers are controlled and synchronized via a state-change-signaling protocol (state machine).
By using a state machine rather than a Start Subchannel instruction for controlling data transfer, the high overhead associated with starting and processing I/O interrupts by both hardware and software for data transfers is virtually eliminated. Thus the overhead reduction realized with a direct memory map interface will provide TCP/IP the capability to support high Gigabit bandwidth network speeds without substantially impacting other system processing.
This section presents and discusses measurement results that assess the performance of the Gigabit Ethernet using the QDIO support included in TCP/IP Level 3A0.
Methodology: The workload driver is an internal tool which can be used to simulate such bulk-data transfers as FTP and Tivoli Storage Manager. The data are driven from the application layer of the TCP/IP protocol stack, thus causing the entire networking infrastructure, including the OSA hardware and the TCP/IP procotol code, to be measured. It moves data between client-side memory and server-side memory, eliminating all outside bottlenecks such as DASD or tape.
A client-server pair was used in which the client received 10MB of data (inbound) or sent 10MB of data (outbound) with a one-byte response. Additional client-server pairs were added until maximum throughput was attained.
Figure 1. QDIO Performance Run Environment
           *------------------------*------------------------*
           |          VM_s          |          VM_c          |
           |    (server machine)    |    (client machine)    |
           |                        |                        |
           |                        |                        |
           *----*----*----*----*----+----*----*----*----*----*
           |    |    |    |    |    |    |    |    |    |    |
      *----*TCP/| 1  | 2  | 3  | 4  | 1  | 2  | 3  | 4  |TCP/*----*
      V    | IP |    |    |    |    |    |    |    |    | IP |    V
  *-----*  |    |    |    |    |    |    |    |    |    |    |  *-----*
  |OSA_s|  |    |    |    |    |    |    |    |    |    |    |  |OSA_c|
  |     |  *----*----*----*----*----+----*----*----*----*----*  |     |
  *--*--*  |                        |                        |  *--*--*
     |     |          CP            |          CP            |     |
     |     *------------------------*------------------------*     |
     |                    9672-ZZ7 processor                       |
     |                                                             |
     |                           Gbit                              |
     *------------------------>  Ethernet <------------------------*
                                 LAN
|
Each performance run, starting with 1 client-server pair and progressing to 4 client-server pairs, consisted of starting the server(s) on VM_s and then starting the client(s) on VM_c. The client(s) sent 10MB of data (outbound case) or received 10MB of data (inbound case) for 200 seconds. Monitor data were collected for 150 seconds of that time period. Data were collected only on the client machine. Another internal tool, called PSTATS, was used to gather performance data for the OSA adapters.
At least 3 measurement trials were taken for each case, and a representative trial was chosen to show in the results. A complete set of runs was done with the maximum transmission unit (MTU) set to 1500 and another set of runs was done with 8992 MTU. The CP monitor data for each measurement were reduced by VMPRF and by an exec that extracts pertinent fields from the TCP/IP APPLDATA monitor records (subrecords x'00' and x'04').
Throughput Results: The throughput results are summarized in Figure 2.
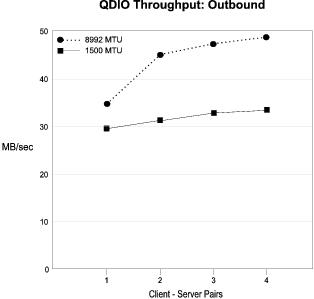 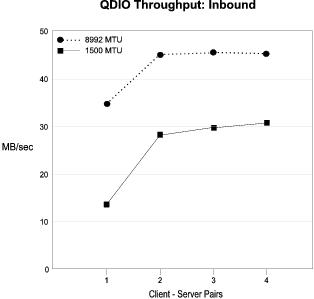 |
The graphs show maximum throughputs ranging from 30 MB/sec to 48 MB/sec, depending on the case, as compared to the maximum of about 125 MB/sec for the Gigabit Ethernet transport itself. CPU utilization in the TCPIP stack virtual machine is the primary constraint. The stack virtual machine can only run on one processor at a time. This limitation can be avoided by distributing the network on two or more TCPIP stack virtual machines. It appears that if the stack machine bottleneck were removed, the next bottleneck may be the adapter PCI bus capacity, if both stack machines are sharing the adapter.
Whenever we ran with 4 clients, the throughput rate appeared to be leveling off and that running 5 clients would not give us better throughput. We verified this by running with 5 clients for the Inbound 1500 MTU case and this was indeed true.
Better throughput was realized with 8992 MTU specified because of more efficient operation using the larger packet size. Fewer packets need to be exchanged and much of the overhead is on a per-packet basis.
Detailed Results: The following four tables contain additional results for each of the cases. Each of the following tables consists of two parts: the absolute results followed by the results expressed as ratios relative to the 1 client-server pair base case. The names used for the fields in the tables are the same as the names in the monitor data from which they were obtained. Following is an explanation of each field:
MB/sec (workload driver) | The workload driver produces a report which gives how many megabytes of data were sent (or received) during the run. It represents throughput from the application point of view. This measurement was what we chose to show in the Figure 2 graphs. |
MB/sec (monitor) | This field is calculated by adding two values, ioInOctets and ioOutOctets, 1 to get total bytes received and sent per second and dividing by 1Meg. It represents total throughput, including header bytes. |
TCPIP CPU Utilization | This field is calculated from the TCPIP entry in the USER_RESOURCE_UTILIZATION VMPRF report. 2 Using total CPU seconds for the TCPIP stack virtual machine divided by total time, we get the percent of the total time given to TCPIP. |
TCPIP total CPU msec/MB | This field was calculated from two of the previous fields (TCPIP CPU Utilization divided by MB/sec(driver)) to show the number of TCPIP milliseconds of time to MB of data ratio. |
TCPIP virtual CPU msec/MB | This field is calculated in the same manner as TCPIP total CPU msec/MB, using virtual CPU seconds for the TCPIP stack from the USER_RESOURCE_UTILIZATION VMPRF report. |
TCPIP CP CPU msec/MB | This is the difference of total CPU msec/MB less virtual CPU msec/MB yielding the time spent in CP on TCP/IP's behalf. |
OSA_c and OSA_s CPU (pstats) | This shows the CPU utilization, as reported by PSTATS, for the CPU on the OSA adapters. Several readings were taken during the run and these numbers reflect the average. |
OSA_c and OSA_s PCI (pstats) | This shows the utilization, as reported by PSTATS, for the OSA adapter PCI bus. Again, several readings were taken during each run and then averaged. |
FpspSize | The number of locked 4K pages held by the Fixed Page Storage Manager 3 is reported in TCP/IP Application Monitor records sub-record x'04'. |
FpspinUse | The number of locked 4K pages currently allocated to users of the fixed page storage pool is reported in TCP/IP Application Monitor records sub-record x'04'. |
ioInOctets/ioDirectRead | Both values are found in TCP/IP Application Monitor record sub-record x'00'. This calculation shows the number of bytes per QDIO inbound data transfer. |
ioOutOctets/ioDirectWrite | Both values are found in TCP/IP Application Monitor record sub-record x'00'. This calculation shows the number of bytes per QDIO outbound data transfer. |
ioDirectReads/MB | This is the same TCP/IP Application Monitor record information as before, divided by MB/sec from the workload driver, to show the number of QDIO inbound data transfers per megabyte. |
ioDirectWrites/MB | This is the same TCP/IP Application Monitor record information as before, divided by MB/sec from the workload driver, to show the number of QDIO outbound data transfers per megabyte. |
QDIOpolls/MB | QDIOpolls is found in the TCP/IP Application Monitor record, sub-record x'00' and contains the number of QDIO polling operations. This calculated value shows the number of polls per megabyte. |
ioPCI/MB | ioPCI is found in the TCP/IP Application Monitor record, sub-record x'00', and contains the number of PCI interrupts. This calculated value shows the number of interrupts per megabyte. |
Table 1. QDIO Run: Outbound 1500 MTU
Client-Server Pairs Run ID | 1 QNO11 | 2 QNO21 | 3 QNO32 | 4 QNO42 |
|---|---|---|---|---|
MB/sec (workload driver) MB/sec (monitor) | 29.98 31.82 | 31.4 33.38 | 33.39 35.45 | 33.58 35.54 |
TCPIP CPU Utilization TCPIP total CPU msec/MB TCPIP virtual CPU msec/MB TCPIP CP CPU msec/MB | 95.3 31.8 23.8 8.0 | 94.7 30.1 22.3 7.9 | 94.7 28.4 20.6 7.8 | 94.7 28.2 20.3 7.9 |
OSA_c_CPU (pstats) OSA_c_PCI (pstats) OSA_s_CPU (pstats) OSA_s_PCI (pstats) | 55 49 80 56 | 42 51 81 59 | 35 53 82 62 | 37 52 82 65 |
FpspSize FpspInUse | 295 163 | 295 154 | 303 162 | 303 151 |
ioInOctets/ioDirectRead ioOutOctets/ioDirectWrite | 86 17288 | 167 17681 | 220 18922 | 216 19710 |
ioDirectReads/MB ioDirectWrites/MB QDIOpolls/MB ioPCI/MB | 41.0 64.2 100.4 36.2 | 29.2 62.8 56.9 25.0 | 19.3 58.6 36.7 15.9 | 18.5 56.1 36.0 14.8 |
MB/sec (workload driver) MB/sec (monitor) | 1.000 1.000 | 1.047 1.049 | 1.114 1.114 | 1.120 1.117 |
TCPIP CPU Utilization TCPIP total CPU msec/MB TCPIP virtual CPU msec/MB TCPIP CP CPU msec/MB | 1.000 1.000 1.000 1.000 | 0.994 0.947 0.937 0.988 | 0.994 0.893 0.866 0.975 | 0.994 0.887 0.853 0.988 |
OSA_c_CPU (pstats) OSA_c_PCI (pstats) OSA_s_CPU (pstats) OSA_s_PCI (pstats) | 1.000 1.000 1.000 1.000 | 0.764 1.041 1.013 1.054 | 0.636 1.082 1.025 1.107 | 0.673 1.061 1.025 1.161 |
FpspSize FpspInUse | 1.000 1.000 | 1.000 0.945 | 1.027 0.994 | 1.027 0.926 |
ioInOctets/ioDirectRead ioOutOctets/ioDirectWrite | 1.000 1.000 | 1.942 1.023 | 2.558 1.095 | 2.512 1.140 |
ioDirectReads/MB ioDirectWrites/MB QDIOpolls/MB ioPCI/MB | 1.000 1.000 1.000 1.000 | 0.712 0.978 0.567 0.691 | 0.471 0.913 0.366 0.439 | 0.451 0.874 0.359 0.409 |
| Note: Gigabit Ethernet; 9672-ZZ7; z/VM 3.1.0 with 31-bit CP; TCP/IP 3A0; databufferpoolsize 32760; databufferlimits 10 10 | ||||
Not included in these tables, but noticed during the runs, the average inbound packet size and the average outbound packet size for all the runs was:
                            Inbound Outbound
                             Case    Case
                            *------*-------*
  inbound packet - 1500 MTU | 1532 |   84  |
  outbound packet- 1500 MTU |   84 | 1532  |
                            *------+-------*
  inbound packet - 8992 MTU | 9016 |   84  |
  outbound packet- 8992 MTU |   84 | 9015  |
                            *------*-------*
TCPIP utilization is either as high as it can go, or close to it, even for one client. The reason for throughput increase, as clients are added, is that stack efficiency increases with more clients. This is due to piggybacking effects as seen in the ioDirectReads/MB and ioDirectWrites/MB. For example, one client gets 41.0 direct reads for every megabyte and four clients get 18.5.
The performance statistics for the adapter cards show that the
CPU utilizations for both OSA_c and OSA_s are either flat or
improving, while the statistics for the PCI bus show increases that
are approximately proportional to the throughput rate.
Table 2. QDIO Run: Inbound 1500 MTU
Client-Server Pairs Run ID | 1 QNI11 | 2 QNI22 | 3 QNI32 | 4 QNI42 |
|---|---|---|---|---|
MB/sec (workload driver) MB/sec (monitor) | 13.3 13.79 | 28.11 30.00 | 29.92 32.44 | 30.38 32.23 |
TCPIP CPU Utilization TCPIP total CPU msec/MB TCPIP virtual CPU msec/MB TCPIP CP cpu msec/MB | 36.7 27.6 19.5 8.0 | 80.0 28.5 20.5 8.0 | 85.3 28.5 20.5 8.0 | 84.7 27.9 19.7 8.1 |
OSA_c_CPU (pstats) OSA_c_PCI (pstats) OSA_s_CPU (pstats) OSA_s_PCI (pstats) | 20 35 16 32 | 61 54 31 47 | 67 49 37 52 | 73 61 32 52 |
FpspSize FpspInUse | 303 152 | 303 167 | 303 167 | 303 152 |
ioInOctets/ioDirectRead ioOutOctets/ioDirectWrite | 25176 84 | 21995 145 | 23948 144 | 25823 134 |
ioDirect Reads/MB ioDirectWrites/MB QDIOpolls/MB ioPCI/MB | 43.1 31.1 75.7 32.0 | 50.7 27.9 68.7 31.6 | 47.3 25.7 66.8 31.1 | 43.0 24.7 64.8 30.2 |
MB/sec (workload driver) MB/sec (monitor) | 1.000 1.000 | 2.114 2.175 | 2.250 2.352 | 2.284 2.337 |
TCPIP CPU Utilization TCPIP total CPU msec/MB TCPIP virtual CPU msec/MB TCPIP CP cpu msec/MB | 1.000 1.000 1.000 1.000 | 2.180 1.033 1.051 1.000 | 2.324 1.033 1.051 1.000 | 2.308 1.011 1.010 1.013 |
OSA_c_CPU (pstats) OSA_c_PCI (pstats) OSA_s_CPU (pstats) OSA_s_PCI (pstats) | 1.000 1.000 1.000 1.000 | 3.050 1.543 1.938 1.469 | 3.350 1.400 2.313 1.625 | 3.650 1.743 2.000 1.625 |
FpspSize FpspInUse | 1.000 1.000 | 1.000 1.099 | 1.000 1.099 | 1.000 1.000 |
ioInOctets/ioDirectRead ioOutOctets/ioDirectWrite | 1.000 1.000 | 0.874 1.726 | 0.951 1.714 | 1.026 1.595 |
ioDirect Reads/MB ioDirectWrites/MB QDIOpolls/MB ioPCI/MB | 1.000 1.000 1.000 1.000 | 1.176 0.897 0.908 0.988 | 1.097 0.826 0.882 0.972 | 0.998 0.794 0.856 0.944 |
| Note: Gigabit Ethernet; 9672-ZZ7; z/VM 3.1.0 with 31-bit CP; TCP/IP 3A0; databufferpoolsize 32760; databufferlimits 10 10 | ||||
The inbound case had much lower throughput with one client than the outbound case. The reason for this is not understood at this time. The multi-client inbound throughputs are more similar to the corresponding outbound throughputs.
Unlike the outbound run, TCPIP efficiency did not increase
appreciably with an increasing number of clients.
Instead, the increase in throughput comes from the overlapping
of requests from multiple clients.
Table 3. QDIO Run: Outbound 8992 MTU
Client-Server Pairs Run ID | 1 QJO11 | 2 QJO21 | 3 QJO31 | 4 QJO41 |
|---|---|---|---|---|
MB/sec (workload driver) MB/sec (monitor) | 35.39 35.98 | 43.63 44.14 | 47.53 47.94 | 48.13 48.39 |
TCPIP CPU Utilization TCPIP total CPU msec/MB TCPIP vitual CPU msec/MB TCPIP CP cpu msec/MB | 88.0 24.9 16.6 8.3 | 92.7 21.2 13.1 8.1 | 91.3 19.2 11.1 8.1 | 88.7 18.4 10.4 8.0 |
OSA_c_CPU (pstats) OSA_c_PCI (pstats) OSA_s_CPU (pstats) OSA_s_PCI (pstats) | 22 54 24 52 | 18 63 28 61 | 11 65 23 67 | 9 67 24 68 |
FpspSize FpspInUse | 279 151 | 279 167 | 347 160 | 421 220 |
ioInOctets/ioDirectRead ioOutOctets/ioDirectWrite | 86 16734 | 126 25995 | 156 33137 | 160 36660 |
ioDirectReads/MB ioDirectWrites/MB QDIOpolls/MB ioPCI/MB | 40.3 63.5 97.5 32.8 | 25.7 40.7 61.6 21.8 | 13.9 31.9 31.5 11.4 | 10.0 28.7 21.0 8.1 |
MB/sec (workload driver) MB/sec (monitor) | 1.000 1.000 | 1.233 1.227 | 1.343 1.332 | 1.360 1.345 |
TCPIP CPU Utilization TCPIP total CPU msec/MB TCPIP vitual CPU msec/MB TCPIP CP cpu msec/MB | 1.000 1.000 1.000 1.000 | 1.053 0.851 0.789 0.976 | 1.038 0.771 0.669 0.976 | 1.008 0.739 0.627 0.964 |
OSA_c_CPU (pstats) OSA_c_PCI (pstats) OSA_s_CPU (pstats) OSA_s_PCI (pstats) | 1.000 1.000 1.000 1.000 | 0.818 1.167 1.167 1.173 | 0.500 1.204 0.958 1.288 | 0.409 1.241 1.000 1.308 |
FpspSize FpspInUse | 1.000 1.000 | 1.000 1.106 | 1.244 1.060 | 1.509 1.457 |
ioInOctets/ioDirectRead ioOutOctets/ioDirectWrite | 1.000 1.000 | 1.465 1.553 | 1.814 1.980 | 1.860 2.191 |
ioDirectReads/MB ioDirectWrites/MB QDIOpolls/MB ioPCI/MB | 1.000 1.000 1.000 1.000 | 0.638 0.641 0.632 0.665 | 0.345 0.502 0.323 0.348 | 0.248 0.452 0.215 0.247 |
| Note: Gigabit Ethernet; 9672-ZZ7; z/VM 3.1.0 with 31-bit CP; TCP/IP 3A0; databufferpoolsize 32760; databufferlimits 10 10 | ||||
8992 MTU packet sizes gave higher efficiencies than the 1500 MTU case. Notice that the number of direct reads per megabyte went from 18.5 for 4 clients with 1500 MTU to 10.0 for the same number of clients with 8992 MTU. Similar results were seen for the direct writes.
These efficiencies can also be seen in the performance statistics for the adapter card as well as TCPIP total CPU milliseconds per megabyte. The numbers are significantly lower than the corresponding numbers for the 1500 MTU case.
In addition to the differences noted, there
are also similarities between the 8992 MTU case and the 1500
MTU case. Each shows that the TCPIP stack is the limiting factor and
that the increase in the number of clients has a proportional increase
in efficiency.
Table 4. QDIO Run: Inbound 8992 MTU
Client-Server Pairs Run ID | 1 QJI11 | 2 QJI21 | 3 QJI31 | 4 QJI41 |
|---|---|---|---|---|
MB/sec (workload driver) MB/sec (monitor) | 34.6 35.07 | 44.68 45.12 | 44.72 45.20 | 44.61 45.07 |
TCPIP CPU Utilization TCPIP total CPU msec/MB TCPIP virtual CPU msec/MB TCPIP CP CPU msec/MB | 77.3 22.4 14.8 7.5 | 92.7 20.7 13.3 7.5 | 91.3 20.4 12.8 7.6 | 91.3 20.5 12.9 7.6 |
OSA_c_CPU (pstats) OSA_c_PCI (pstats) OSA_s_CPU (pstats) OSA_s_PCI (pstats) | 18 51 10 52 | 23 63 10 63 | 21 65 8 63 | 20 64 7 63 |
FpspSize FpspInUse | 421 152 | 421 184 | 421 168 | 421 167 |
ioInOctets/ioDirectRead ioOutOctets/ioDirectWrite | 15888 84 | 16177 105 | 15304 129 | 14872 152 |
ioDirect Reads/MB ioDirectWrites/MB QDIOpolls/MB ioPCI/MB | 66.7 28.6 81.7 35.9 | 65.4 17.0 59.5 28.3 | 69.2 11.0 51.5 25.5 | 71.1 8.3 49.8 24.7 |
MB/sec (workload driver) MB/sec (monitor) | 1.000 1.000 | 1.291 1.287 | 1.292 1.289 | 1.289 1.285 |
TCPIP CPU Utilization TCPIP total CPU msec/MB TCPIP virtual CPU msec/MB TCPIP CP CPU msec/MB | 1.000 1.000 1.000 1.000 | 1.199 0.924 0.899 1.000 | 1.181 0.911 0.865 1.013 | 1.181 0.915 0.872 1.013 |
OSA_c_CPU (pstats) OSA_c_PCI (pstats) OSA_s_CPU (pstats) OSA_s_PCI (pstats) | 1.000 1.000 1.000 1.000 | 1.278 1.235 1.000 1.212 | 1.167 1.275 0.800 1.212 | 1.111 1.255 0.700 1.212 |
FpspSize FpspInUse | 1.000 1.000 | 1.000 1.211 | 1.000 1.105 | 1.000 1.099 |
ioInOctets/ioDirectRead ioOutOctets/ioDirectWrite | 1.000 1.000 | 1.018 1.250 | 0.963 1.536 | 0.936 1.810 |
ioDirect Reads/MB ioDirectWrites/MB QDIOpolls/MB ioPCI/MB | 1.000 1.000 1.000 1.000 | 0.981 0.594 0.728 0.788 | 1.037 0.385 0.630 0.710 | 1.066 0.290 0.610 0.688 |
| Note: Gigabit Ethernet; 9672-ZZ7; z/VM 3.1.0 with 31-bit CP; TCP/IP 3A0; databufferpoolsize 32760; databufferlimits 10 10 | ||||
A single client with 8992 MTU has the same low throughput and utilization characteristics as the 1500 MTU case, although not as pronounced.
The maximum throughput was essentially reached at two clients. Also, note that the TCPIP CPU utilization never goes higher after 2 clients.
Footnotes:
- 1
- ioInOctets and ioOutOctets are found in the TCP/IP Application Monitor Data, sub-record x'00'. The description for these, and all other data found in the TCP/IP Application Monitor Data, can be found in the z/VM: Performance book, Appendix F.
- 2
- This is described in Chapter 6 of the Performance and Reporting Facility User's Guide and Reference.
- 3
- This service, new to TCP/IP Level 3A0, provides a new storage pool of 4K pages that have been locked by Diagnose 98. QDIO uses the FPSM to provide a cache of locked pages for fast I/O buffer management. Since the typical QDIO data transfer is faster than traditional I/O, the active life of a data buffer is short lived, thereby causing the same buffers to be quickly reused for the next data transfer. A new optional statement in the TCP/IP configuration file called FIXEDPAGESTORAGEPOOL can be used to manually tune the FPSM.
Back to Table of Contents.
Secure Socket Layer Support
SSL is a TCP/IP protocol that provides privacy between two communicating applications (a client and a server). Under the SSL protocol, the server is always authenticated and must provide a certificate to prove its identity. In addition to authentication, both the client and the server participate in a handshake protocol at connect time to determine the cryptographic parameters to be used for that session.
The SSL support in TCP/IP VM is provided by a new SSL server virtual machine. The SSL server is inserted into the data flow between the client and its target server. After the handshaking completes, encrypted information from the client flows to the stack machine, then to the SSL server, where that information is decrypted, back to the stack machine, and then to the target server (FTP, for example). For outbound information, this processing and flow are reversed. The target server is unaware of whether SSL is being used so the processing it does remains unchanged.
The use of SSL brings with it additional processing requirements on both the client and server side relative to the same communications done without SSL. At connect time, there is additional handshake overhead. Then, during the session, there is processing required to encrypt/decrypt all the information that flows between client and server using the agreed-upon cipher suite. Finally, on the VM side, there is IUCV processing to implement the communications between the SSL server and the stack machine.
The measurements in this section are meant to quantify this additional processing. Two connect/disconnect workloads using a Telnet client were used to quantify the additional handshake processing. FTP was used to examine the performance impact of SSL on bulk data transfer.
All measurements in this section are for single-thread client/server interactions. The BlueZone FTP client was on a Windows NT 4.0 workstation running on a Pentium MMX 233 Mhz processor. The server was on z/VM 3.1.0 with 64-bit CP running on a 2064-109 zSeries processor configured as an LPAR with 2 dedicated processors, 1G of real storage, and 2G of expanded storage. Connectivity was through 16 Mbit IBM Token Ring. Default MTU size, DATABUFFERPOOLSIZE 32760, and DATABUFFERLIMITS 5 5 were specified.
QUERY TIME and INDICATE USER data were collected for each of the VM virtual machines involved. These are the TCP/IP stack machine (TCPIP), the SSL server (SSLSERV), and, in the case of FTP, the FTP server (FTPSERVE). The Telnet server is integrated into the TCP/IP stack machine so there is no third server virtual machine in that case.
Telnet Connect/Disconnect
The SSL protocol allows a cache of recently generated handshake output in order to eliminate much of the handshake overhead in cases where a given client makes repeated connections. The first time the client connects, the client and server go through the complete handshake and the resulting handshake output (session id plus associated information) is saved in the server's cache. This is referred to as a new session. The next time that client connects, it may pass the session id to the SSL server and if a valid copy of it is found in the server's cache, most of the handshake is bypassed. This case is referred to as a resumed session.
Whether or not this resumed session optimization is used is up to the client. Clients that include connect/disconnect in their mainline path (such as http browsers) are likely to use this optimization. Clients such as FTP and Telnet that establish a connection and then use it for a (potentially) long conversation are less likely to support this optimization. It turns out that IBM's eNetwork Personal Communications terminal emulator application (PCOMM) does both. When a disconnect and connect are done manually from the Communication menu, the optimization is not used and consequently all sessions are new sessions. When the disconnect is done implicitly by logging off the remote system and the auto-reconnect option is checked, the optimization is used and all sessions except the first are resumed sessions. This characteristic allowed us to measure both the new and resumed cases.
SSL does asymmetric encryption using a public/private key pair during the handshake protocol. VM supports two different key sizes: 512 bits and 1024 bits. The longer one provides greater security but takes more processing to encrypt and decrypt. Both cases were measured. The cipher suite negotiated during the connection handshake is only used later for the encryption and decryption of data once the session is active. It does not affect the performance of the handshake itself. The RC4_40_MD5 cipher suite was used for all of the connect/disconnect measurements.
The new session results were obtained by measuring 10 consecutive manual disconnect/connect pairs, created by using the PCOMM Communication menu. The resume session results were obtained by measuring 10 consecutive implicit disconnect/connect pairs, created by logging onto a VM userid which did an immediate logoff. In both cases, the QUERY TIME and INDICATE USER results were first adjusted to remove idling overhead (in the TCPIP and SSLSERV virtual machines) and then divided by 10 so that the reported results represent the average for one disconnect/connect pair. The new session results are presented in Table 1, while the resumed session results are in Table 2. The top section of each table contains the absolute results, while the bottom section shows the same results as ratios relative to the base case without SSL.
Table 1. SSL Performance: Telnet Connect/Disconnect - New Session
SSL bits in key pair run id | no na STELNN2 | yes 512 STELNH2 | yes 1024 STELNF2 |
|---|---|---|---|
SSLSERV msec total CPU/connect msec virtual CPU/connect msec CP CPU/connect virtual IOs/connect TCPIP msec total CPU/connect msec virtual CPU/connect msec CP CPU/connect virtual IOs/connect TOTAL msec total CPU/connect msec virtual CPU/connect msec CP CPU/connect virtual IOs/connect |
|
|
|
TCPIP msec total CPU/connect msec virtual CPU/connect msec CP CPU/connect virtual IOs/connect TOTAL msec total CPU/connect msec virtual CPU/connect msec CP CPU/connect virtual IOs/connect |
|
|
|
| Note: 2064-109; LPAR; 2 dedicated processors; 1G/2G central/expanded storage; zVM 3.1.0, 64-bit CP; client workstation: Pentium MMX 233mHz; 16 Mbit IBM Token Ring; single client | |||
The TOTAL msec total CPU/connect ratios near the bottom of the table show the approximate overall processing multipliers relative to the no-SSL base case. Note that the increase is much higher when the 1024-bit key pair is used.
A significant part of the processing in the SSL machine is due to asymmetric encryption/decryption using the public/private key pair. This is indicated by the very large increase in SSLSERV msec virtual CPU/connect when going from a 512-bit to a 1024-bit key pair. Most of the SSL processing occurs in the SSL server but there are some increases in the TCP/IP stack machine as well. The CPU and virtual I/O increases in the TCP/IP stack are mostly due to the increased traffic through the stack to support the SSL handshake protocol.
IUCV communications between the TCP/IP stack and the SSL server is a small fraction of the total SSL-related processing. This overhead shows up as CP CPU time. SSLSERV msec CP CPU/connect (2.0 msec in the 512-bit key pair case) should be an upper bound on one half of the total IUCV processor usage (the other half being charged to the TCPIP machine). TCPIP msec CP CPU/connect is higher than SSLSERV msec CP CPU/connect because CP is also heavily involved in doing I/O on behalf of TCPIP to the client through the token ring adapter.
Table 2. SSL Performance: Telnet Connect/Disconnect - Resume Session
SSL bits in key pair run id | no na STELRN2 | yes 512 STELRH2 | yes 1024 STELRF2 |
|---|---|---|---|
SSLSERV msec total CPU/connect msec virtual CPU/connect msec CP CPU/connect virtual IOs/connect TCPIP msec total CPU/connect msec virtual CPU/connect msec CP CPU/connect virtual IOs/connect TOTAL msec total CPU/connect msec virtual CPU/connect msec CP CPU/connect virtual IOs/connect |
|
|
|
TCPIP msec total CPU/connect msec virtual CPU/connect msec CP CPU/connect virtual IOs/connect TOTAL msec total CPU/connect msec virtual CPU/connect msec CP CPU/connect virtual IOs/connect |
|
|
|
| Note: 2064-109; LPAR; 2 dedicated processors; 1G/2G central/expanded storage; zVM 3.1.0, 64-bit CP; client workstation: Pentium MMX 233mHz; 16 Mbit IBM Token Ring; single client | |||
These results show the large benefits derived from the resumed session optimization. It appears that all, or nearly all, of the processing associated with the public/private key pair is eliminated because the 1024-bit key pair case performs about the same as the 512-bit case.
Note: The logon/logoff sequence used to produce the resume session case contains a small amount of additional network activity relative to the explicit connect/disconnect used to produce the new session case. That explains, for example, why TCPIP virtual IOs/connect is higher in the resume session case. Most of the differences between Table 1 and Table 2 can be attributed to resume session optimization but some differences are due to the workloads not being quite the same.
FTP Large File Transfer
SSL performance for the case of bulk data transport was evaluated using binary FTP GET of a 10M file as the workload. The file resided on a VM minidisk that was eligible for minidisk caching. The following 6 cases were measured:
- no SSL
- SSL using the RC4_128_MD5 cipher suite
- SSL using the RC4_128_SHA cipher suite
- SSL using the RC4_40_MD5 cipher suite
- SSL using the RC2_40_MD5 cipher suite
- SSL using the DES_56_SHA cipher suite
The FTP results are presented in Table 3. The top section of this table contains the absolute results, while the bottom section shows the same results as ratios relative to the base case without SSL. The elapsed times are from the FTP client messages. KB/sec is calculated as the file size (10240 Kilobytes) divided by FTP elapsed time. All remaining data in the table are from the QUERY TIME and INDICATE USER command output obtained before and after each measurement for each participating virtual machine.
Table 3. SSL Performance: FTP Binary Get of a 10M File on VM
SSL cipher run id | no na SGETNX1 | yes rc4_128_md5 SGETAH1 | yes rc4_128_sha SGETBH1 | yes rc4_40_md5 SGETCH1 | yes rc2_40_md5 SGETDH2 | yes des_56_sha SGETEH2 |
|---|---|---|---|---|---|---|
elapsed time (sec) KB/sec SSLSERV total CPU time virtual CPU time CP CPU time virtual I/Os TCPIP total CPU time virtual CPU time CP CPU time virtual I/Os FTPSERVE total CPU time virtual CPU time CP CPU time virtual I/Os TOTAL total CPU time virtual CPU time CP CPU time virtual I/Os | 11.17 917
| 13.59 753
| 14.39 712
| 13.68 749
| 18.10 566
| 18.43 556
|
elapsed time (sec) KB/sec TCPIP total CPU time virtual CPU time CP CPU time virtual I/Os FTPSERVE total CPU time virtual CPU time CP CPU time virtual I/Os TOTAL total CPU time virtual CPU time CP CPU time virtual I/Os | 1.000 1.000
| 1.217 0.821
| 1.288 0.776
| 1.225 0.817
| 1.620 0.617
| 1.650 0.606
|
| Note: 2064-109; LPAR; 2 dedicated processors; 1G/2G central/expanded storage; zVM 3.1.0, 64-bit CP; client workstation: Pentium MMX 233mHz; 16 Mbit IBM Token Ring; 512-bit session key; single client | ||||||
The TOTAL total CPU time ratios near the bottom of the table show the overall processing multipliers relative to the no SSL base case. Note that SSL performance varies substantially depending on the cipher suite.
The increased TCPIP processing for SSL is essentially the same for all of the SSL cases. The only differences are probably due to run variability. The TCP/IP stack machine is simply passing data on to the SSL server and is not aware of what cipher suite is being used.
FTPSERVE's performance is the same for all 6 cases. The only differences are due to run variability. This is to be expected because the target server, in this case FTPSERVE, is unaware of the fact that SSL is being used.
All of the measurements shown in Table 3 were done using the 512-bit key pair. An additional measurement using the 1024-bit key pair confirmed that these FTP results were only slightly affected by the key pair size. Since the measurements were taken after the main FTP connections were established, key pair size would have no effect on the results were it not for the fact that FTP does the data transfer over an additional connection that is established dynamically when the FTP GET request is made. However, this connect/disconnect was a very small fraction of the total FTP GET processing.
Monitoring SSL Performance
The SSLADMIN QUERY CACHE command contains some useful performance information: total number of cache elements, number of new sessions, and number of resumed sessions. The SSLADMIN QUERY SESSIONS command tells you which cipher suite has been negotiated with each client session that is currently active.
Back to Table of Contents.
Additional Evaluations
This section includes results from a number of additional z/VM and z/VM platform performance measurement evaluations that have been conducted during the z/VM 3.1.0 time frame.
Back to Table of Contents.
Linux Guest IUCV Driver
Executive Summary
We used a CMS test program to measure the best data rate one could expect between two virtual machines connected by IUCV. We then measured the data rate experienced by two Linux guests connected via the Linux IUCV line driver. We found that the Linux machines could drive the IUCV link to about 30% of its capacity.
We also conducted a head-to-head data rate comparison of the Linux IUCV and Linux CTC line drivers. We found that the data rate with the CTC driver was at best 72% of the IUCV driver's data rate, and the larger the MTU size, the larger the gap.
We did not measure the latency of the IUCV or CTC line drivers. Nor did we measure the effects of larger n-way configurations or other scaling scenarios.
Procedure
To measure the practical upper limit on the data rate, we prepared a pair of CMS programs that would exchange data using APPC/VM (aka "synchronous IUCV"). We chose APPC/VM for this because when WAIT=YES is used fewer interrupts are delivered to the guests and thus the data rate is increased.
The processing performed by the two CMS programs looks like this:
Requester                            Server
---------                            ------
                                     0.  Identify resource manager
1.  Allocate conversation
                                     2.  Accept conversation
3.  Do "I" times:

    4.  Sample TOD clock
    5.  Do "J" times:
        6.  Transmit a value "N"
                                     7. Receive value of "N"
                                     8. Transmit "N" bytes
        9. Receive "N" bytes
    10. Sample TOD clock again
    11. Subtract TOD clock samples
    12. Print microseconds used

13. Deallocate conversation
                                     14. Wait for another round
We chose I=20 and J=1000.
We ran this pair of programs for increasing values of N (1, 100, 200, 400, 800, 1000, 2000, ..., 8000000) and recorded the value of N at which the curve flattened out, that is, beyond which a larger data rate was not achieved.
For each value of N, we used CP QUERY TIME to record the virtual time and CP time for the requester and the server. We added the two machines' virtual and CP times together so that we could see the distribution of total processor time between CP and the two guests.
To measure the data rate between Linux guests, we set up two Linux 2.2.16 systems and connected them via the IUCV line driver (GA-equivalent level) with various MTU sizes. 1 We then ran an IBM internal network performance measurement tool in stream put mode, transfer size 20,000,000 bytes, 10 samples of 100 repetitions each, with API crossing sizes equal to the MTU size. We used CP QUERY TIME to record the virtual time and CP time used by each Linux machine during the run. We added the two machines' virtual and CP times together so that we could see the distribution of total processor time between CP and the two guests.
We repeated the aforementioned Linux experiment, using the CTC driver and a VCTC connection instead of the IUCV driver, and took the same measurements during the run.
Hardware Used
9672-XZ7, two-processor LPAR (dedicated), LPAR had 2 GB main storage and 2 GB XSTORE. z/VM V3.1.0.
Results
Here are the results we observed for our CMS test program.
| Transfer Size (bytes) | MB/sec | MB/CPU-sec | CPU-sec/second | CP CPU-sec/MB | %CP |
|---|---|---|---|---|---|
| 1 | 0.017 | 0.018 | 0.944 | 46.137344 | 84.620 |
| 100 | 1.723 | 1.870 | 0.921 | 0.450888 | 84.310 |
| 1000 | 17.174 | 18.165 | 0.945 | 0.046662 | 84.760 |
| 1500 | 25.871 | 27.777 | 0.931 | 0.030409 | 84.470 |
| 2000 | 34.091 | 36.680 | 0.929 | 0.023331 | 85.580 |
| 4000 | 65.477 | 72.661 | 0.901 | 0.011665 | 84.760 |
| 8000 | 120.576 | 125.072 | 0.964 | 0.006947 | 86.890 |
| 9000 | 121.666 | 126.222 | 0.964 | 0.006991 | 88.240 |
| 10000 | 133.723 | 142.339 | 0.939 | 0.006134 | 87.310 |
| 20000 | 219.809 | 227.065 | 0.968 | 0.003985 | 90.480 |
| 32764 | 286.070 | 294.775 | 0.970 | 0.003121 | 91.980 |
| 40000 | 306.755 | 313.967 | 0.977 | 0.002976 | 93.420 |
| 80000 | 380.396 | 386.298 | 0.985 | 0.002470 | 95.440 |
| 100000 | 401.215 | 404.957 | 0.991 | 0.002380 | 96.390 |
| 200000 | 452.134 | 455.758 | 0.992 | 0.002144 | 97.730 |
| 400000 | 480.947 | 482.873 | 0.996 | 0.002045 | 98.730 |
| 800000 | 494.869 | 496.221 | 0.997 | 0.002000 | 99.220 |
| 1000000 | 496.635 | 497.612 | 0.998 | 0.001996 | 99.320 |
| 2000000 | 499.014 | 499.698 | 0.999 | 0.001990 | 99.460 |
| 4000000 | 499.976 | 500.485 | 0.999 | 0.001989 | 99.570 |
| 8000000 | 501.732 | 502.066 | 0.999 | 0.001985 | 99.660 |
| Note: 9672-XZ7, 2 GB main, 2 GB expanded. Two-processor LPAR, both dedicated. z/VM V3.1.0. Guests 128 MB. | |||||
Here are the results for our Linux IUCV line driver experiments.
Table 2. Linux IUCV Data Rates
| MTU Size (bytes) | MB/sec | MB/CPU-sec | CPU-sec/sec | CP CPU-sec/MB | %CP |
|---|---|---|---|---|---|
| 1500 | 7.84 | 8.12 | 0.966 | 0.053393 | 43.33 |
| 9000 | 33.33 | 34.17 | 0.975 | 0.012367 | 42.26 |
| 32764 | 73.09 | 74.13 | 0.986 | 0.005608 | 41.57 |
| Note: 9672-XZ7, 2 GB main, 2 GB expanded. Two-processor LPAR, both dedicated. z/VM V3.1.0. Guests 128 MB. | |||||
Here are the results for our Linux CTC line driver experiments.
| MTU Size (bytes) | MB/sec | MB/CPU-sec | CPU-sec/sec | CP CPU-sec/MB | %CP |
|---|---|---|---|---|---|
| 1500 | 5.95 | 5.95 | 1.00 | 0.053472 | 31.97 |
| 9000 | 17.33 | 17.84 | 0.971 | 0.017920 | 31.97 |
| 32764 | 29.71 | 30.91 | 0.961 | 0.010346 | 31.98 |
| Note: 9672-XZ7, 2 GB main, 2 GB expanded. Two-processor LPAR, both dedicated. z/VM V3.1.0. Guests 128 MB. | |||||
Analysis
First let's compare some data rates, at a selection of
transfer sizes (aka MTU sizes).
Table 4. Data Rate (MB/CPU-sec) Comparisons
| MTU Size (bytes) | CMS/IUCV | Linux/IUCV | Linux/CTC |
|---|---|---|---|
| 1500 | 27.8 | 8.12 (0.292) | 5.95 (0.214) [0.733] |
| 9000 | 126.2 | 34.17 (0.271) | 17.84 (0.141) [0.522] |
| 32764 | 294.8 | 74.13 (0.251) | 30.91 (0.105) [0.417] |
| Note: 9672-XZ7, 2 GB main, 2 GB expanded. Two-processor LPAR, both dedicated. z/VM V3.1.0. Guests 128 MB. In the Linux/IUCV and Linux/CTC columns, a number in parentheses is the cell value's fraction of the CMS/IUCV value in the same row. In the Linux/CTC column, a number in brackets is the cell value's fraction of the Linux/IUCV value in the same row. | |||
These numbers illustrate Linux's ability to utilize the IUCV pipe. Utilization at MTU 1500 runs at about 29%. As we move toward larger and larger frames, IUCV utilization goes down.
We see also that the Linux IUCV line driver is a better data rate performer than the Linux CTC line driver, at each MTU size we measured.
Next we examine CP CPU time per MB transferred,
for a selection of MTU sizes.
Table 5. CP CPU-sec/MB Comparisons
| MTU Size (bytes) | CMS/IUCV | Linux/IUCV | Linux/CTC |
|---|---|---|---|
| 1500 | 0.030409 | 0.053393 (1.756) | 0.053472 (1.758) [1.001] |
| 9000 | 0.006991 | 0.012367 (1.770) | 0.017920 (2.563) [1.449] |
| 32764 | 0.003121 | 0.005608 (1.796) | 0.010346 (3.315) [1.845] |
| Note: 9672-XZ7, 2 GB main, 2 GB expanded. Two-processor LPAR, both dedicated. z/VM V3.1.0. Guests 128 MB. In the Linux/IUCV and Linux/CTC columns, a number in parentheses is the cell value's fraction of the CMS/IUCV value in the same row. In the Linux/CTC column, a number in brackets is the cell value's fraction of the Linux/IUCV value in the same row. | |||
We see here that the Linux/IUCV cases use about 1.8 times as much CP CPU time per MB as the CMS/IUCV case. This is likely indicative of the extra CP time required to deliver the extra IUCV interrupt to the Linux guest, though other Linux overhead issues (e.g., timer tick processing) also contribute.
We also see that in the Linux/CTC case, CP CPU time is greater than in the Linux/IUCV case, and as MTU size grows, the gap widens. Apparently there is more overhead in CP CTC processing than in CP IUCV processing, so the fixed cost is not amortized as quickly.
Now we examine virtual CPU time per MB transferred,
for a selection of MTU sizes.
Table 6. Virtual CPU-sec/MB Comparisons
| MTU Size (bytes) | CMS/IUCV | Linux/IUCV | Linux/CTC |
|---|---|---|---|
| 1500 | 0.005592 | 0.069819 (12.5) | 0.114499 (20.5) [1.64] |
| 9000 | 0.000932 | 0.016896 (18.1) | 0.038124 (40.9) [2.26] |
| 32764 | 0.000272 | 0.007882 (29.0) | 0.022001 (80.9) [2.79] |
| Note: 9672-XZ7, 2 GB main, 2 GB expanded. Two-processor LPAR, both dedicated. z/VM V3.1.0. Guests 128 MB. In the Linux/IUCV and Linux/CTC columns, a number in parentheses is the cell value's fraction of the CMS/IUCV value in the same row. In the Linux/CTC column, a number in brackets is the cell value's fraction of the Linux/IUCV value in the same row. | |||
These numbers illustrate the cost of the TCP/IP layers in Linux kernel and its line drivers. This cost is the biggest reason why Linux is unable to drive the IUCV connection to its capacity. CPU resource is being spent on running the guest instead of on running CP, where data movement actually takes place.
These numbers also show us that the Linux guest consumes more CPU in the CTC case than in the IUCV case. Apparently the Linux CTC line driver uses more CPU per MB transferred than the Linux IUCV line driver does.
Conclusions
- The Linux IUCV driver is able to drive the IUCV pipe to at best about 30% of its capacity. As the MTU size grows, the percentage drops.
- The Linux IUCV line driver provides a greater data rate than the Linux CTC line driver over a virtual CTC for the streaming workload measured.
- CP CTC support uses more CPU per MB transferred than CP IUCV support, at a given MTU size.
-
For large transfers between Linux guests, the data rate
would be improved if
the IUCV line driver were modified to support MTU sizes
beyond 32764. Based on our measurements, supporting a
maximum MTU size as high as 2 MB would probably be
sufficient.
However, use of a large MTU size to increase data rate between two Linux images must be balanced against fragmentation issues. As long as the traffic on the IUCV link is destined to remain within the VM image, very large MTU sizes are probably OK. However, if the packets will eventually find their way onto real hardware, they will be fragmented down to the minimum MTU size encountered on the way to the eventual destination. This might be as small as 576 bytes depending on network configuration. The system programmer needs to take this into account when deciding whether to use a very large MTU size on an IUCV link.
- IUCV and virtual CTC are memory-to-memory data transfer technologies. Their speeds will improve as processor speed improves and as memory access speed improves.
Footnotes:
- 1
- uname -a reported Linux prf3linux 2.2.16 #1 SMP Mon Nov 13 09:51:30 EST 2000 s390 unknown.
Back to Table of Contents.
Virtual Channel-to-Channel Performance
This section covers two separate aspects of VCTC performance. First, results are presented that quantify a recent VCTC performance improvement. Second, real ESCON CTC is compared to VCTC with this improvement included.
The same basic methodology was used for both evaluations. A VM/ESA 2.4.0 system was configured with two VCTC-connected V=V guest virtual machines. The VM system was run in an LPAR with 5 shared processors on a 9672-R55. The workload consisted of a binary FTP get of a 10M file from one guest to the other. The transfer was memory-to-memory (did not involve any DASD I/O) because the source file was resident in the minidisk cache and the target file was defined as /dev/null. CP QUERY TIME output was collected for both guests before and after the FTP file transfer. Three trials were obtained for each measured case. The results were quite repeatable; representative trials are shown in the results tables.
VCTC Performance Improvement
This improvement significantly reduces the amount of processing
required by CP's virtual CTC implementation by improving the efficiency
with which the data are copied from source to target virtual
machine. This improvement was first made available in VM/ESA 2.4.0
through APAR VM62480 and has now been incorporated into z/VM 3.1.0.
Measurements made without and with APAR VM62480 are summarized
in Table 1.
Table 1. VCTC Performance Improvement
VM62480 runid | no GLLVCTC7 | yes GLLVCTC6 | ratio
|
|---|---|---|---|
elapsed time (sec) Megabytes/sec CP CPU time virtual CPU time total CPU time | 0.850 11.76 0.59 0.37 0.96 | 0.517 19.34 0.28 0.36 0.64 | 0.61 1.64 0.47 0.97 0.67 |
| Note: binary FTP get of a 10M file to /dev/null; client and server on separate V=V guests connected by VCTC; MTU=32760; VM/ESA 2.4.0; 9672-R55; LPAR; 5 shared processors | |||
The results show a 53% reduction in CP CPU time and a 64% increase in throughput.
Comparison of Real ESCON CTC to Virtual CTC
The VCTC connection between the 2 guests was then replaced
with a real ESCON CTC connection and the measurement was repeated.
Table 2 compares these results to the VCTC
results for the improved case shown in the previous table.
Table 2. Comparison of Real ESCON CTC to Virtual CTC
CTC type runid | real GLLRCTC2 | virtual GLLVCTC6 | ratio
|
|---|---|---|---|
elapsed time (sec) Megabytes/sec CP CPU time virtual CPU time total CPU time | 1.220 8.20 0.28 0.36 0.64 | 0.517 19.34 0.28 0.36 0.64 | 0.42 2.36 1.00 1.00 1.00 |
| Note: binary FTP get of a 10M file to /dev/null; client and server on separate V=V guests connected by real ESCON CTC or VCTC; MTU=32760; VM/ESA 2.4.0; 9672-R55; LPAR; 5 shared processors | |||
The results show that both cases have equivalent processing efficiency but the VCTC case achieved 2.36 times higher throughput because the latencies associated with real ESCON CTC are eliminated.
To be eligible for IOASSIST, the VM system would need to be run on a basic mode processor (not in an LPAR) and the two guests would need to be run in V=R or V=F virtual machines. If IOASSIST had been in effect, the virtual CTC results should be essentially the same but the real CTC results should differ in the following ways:
- elapsed time: little change
- MB/sec: little change
- CP CPU time: decrease
- virtual CPU time: little change
- total CPU time: decrease
We would expect little change to elapsed time and MB/sec because these are primarily determined by the real ESCON CTC latencies rather than by the processor usage.
Back to Table of Contents.
Migration from VTAM to Telnet
This section explores the performance implications of migrating end-user 3270 connectivity from VTAM to TCP/IP Telnet. It should be used in conjunction with a similar 9121-480 comparison that is summarized in "Migration from VTAM to Telnet" in the VM/ESA 2.3.0 Performance Report. The measurements shown here were obtained on a larger processor that supports many more users.
Measurements were obtained by running the FS8F0R workload on a 9121-742 processor with the end users simulated by TPNS running on a separate system. VM/ESA 2.3.0 was used for all measurements. For the base measurement, connectivity was provided by VTAM 3.4.1 through a CTCA connection with the TPNS system. Table 1 compares this VTAM base measurement to a measurement using TCP/IP 310 Telnet through a 3172-3 Interconnect Controller and a 16Mbit IBM Token Ring.
Processor model:            9121-742
Processors used:            4
Storage:
    Real:                   1024MB (default MDC)
    Expanded:               1024MB (MDC BIAS 0.1)
Tape:                       3480 (Monitor)

DASD:
Type of DASD | Control Unit | Number of Paths |
|
| - Number of Volumes - TDSK |
|
|
|
|---|---|---|---|---|---|---|---|---|
| 3390-3 | RAMAC 2 | 4 | | 6 | | 32 | | |
| 3390-2 | 3990-3 | 4 | 6 | | 2 | | | 2 |
| 3390-2 | 3990-2 | 4 | 6 | | 2 | | | |
| 3390-2 | 3990-2 | 4 | 10 | | | | |
Note: RAMAC 2 refers to the RAMAC 2 Array Subsystem with 256MB cache and drawers in 3390-3 format.
Communications (CTCA):
|
| Lines per Control Unit |
|
|---|---|---|---|
| 3088 | 1 | NA | 4.5MB |
Communications (Token Ring):

16 Mbit IBM Token Ring
3172-3 Interconnect Controller
Driver:                    TPNS
Think time distribution:   Bactrian
CMS block size:            4KB

Virtual Machines:
Virtual Machine |
|
| Machine Size/Mode |
|
|
|
|---|---|---|---|---|---|---|
| VSCSn | 3 | VSCS | 64MB/XA | 10000 | 1200 | QUICKDSP ON |
| VTAMXA or | 1 | VTAM/VSCS | 64MB/XA | 10000 | 550 | QUICKDSP ON |
| | | | | | | |
| TCPIP | 1 | TCP/IP | 256MB/XA | 10000 | 2700 | QUICKDSP ON |
| | | | | | | |
| SMART | 1 | RTM | 32MB/XA | 3% | 500 | QUICKDSP ON |
| WRITER | 1 | CP monitor | 2MB/XA | 100 | | QUICKDSP ON |
| Unnnn | 5100 | Users | 3MB/XC | 100 | |
The results demonstrate that TCP/IP VM Telnet connectivity can support large numbers of users (5100) with good response time (0.36 seconds).
VTAM supports the 3270 interface through the *CCS CP system service (accessed using IUCV requests), while Telnet provides this function through use of the Diagnose X'7C' logical device support facility. This difference is reflected in the results as a large decrease in PRIVOP/CMD and a large increase in DIAG/CMD. The fact that diagnose X'7C' has a longer pathlength than *CCS accounts for much of the CPU usage increase observed in the TCP/IP measurement relative to the VTAM base measurement. Another contributing factor is that TCP/IP does more communication I/Os than VTAM, as shown by the increase in DIAG 98/CMD.
The 3.9% increase in total processing requirements (PBT/CMD (H)) is much less than the 8.2% increase observed for the 9121-480 configuration (see "Migration from VTAM to Telnet" in the VM/ESA 2.3.0 Performance Report). This is because the larger 9121-742 configuration was configured with VSCS in 3 separate virtual machines, whereas the 9121-480 configuration was small enough that VSCS could be configured within the VTAM virtual machine. The external VSCS configuration is less efficient, raising the total VTAM processing requirements and reducing the difference between the VTAM and TCP/IP results.
Note the increase in master processor utilization (MASTER TOTAL (H)) that occurred when going from VTAM to TCP/IP. This is due to an increase in CP master processor utilization (MASTER CP (H)). This occured because most of the CP modules that implement Diagnose X'7C' obtain their MP serialization by running on the master processor. This increase in master processor contention caused the response time increase relative to the VTAM base case to be larger than it otherwise would have been.
Table 1. Migration from VTAM to TCP/IP
Communications Interconnection Run ID | VTAM 3.4.1 CTCA S4AE5101 | TCP/IP 310 3172-3/TR S4AE5100 |
|
|
|---|---|---|---|---|
Response Time TRIV INT NONTRIV INT TOT INT TOT INT ADJ AVG FIRST (T) AVG LAST (T) |
|
|
|
|
Throughput AVG THINK (T) ETR ETR (T) ETR RATIO ITR (H) ITR EMUL ITR ITRR (H) ITRR |
|
|
|
|
Proc. Usage PBT/CMD (H) PBT/CMD CP/CMD (H) CP/CMD EMUL/CMD (H) EMUL/CMD |
|
|
|
|
Processor Util. TOTAL (H) TOTAL UTIL/PROC (H) UTIL/PROC TOTAL EMUL (H) TOTAL EMUL MASTER TOTAL (H) MASTER TOTAL MASTER EMUL (H) MASTER CP (H) MASTER EMUL TVR(H) TVR |
|
|
|
|
Storage NUCLEUS SIZE (V) TRACE TABLE (V) WKSET (V) PGBLPGS PGBLPGS/USER TOT PAGES/USER (V) FREEPGS FREE UTIL SHRPGS |
|
|
|
|
Paging READS/SEC WRITES/SEC PAGE/CMD PAGE IO RATE (V) PAGE IO/CMD (V) XSTOR IN/SEC XSTOR OUT/SEC XSTOR/CMD FAST CLR/CMD |
|
|
|
|
Queues DISPATCH LIST ELIGIBLE LIST |
|
|
|
|
I/O VIO RATE VIO/CMD RIO RATE (V) RIO/CMD (V) NONPAGE RIO/CMD (V) DASD RESP TIME (V) MDC REAL SIZE (MB) MDC XSTOR SIZE (MB) MDC READS (I/Os) MDC WRITES (I/Os) MDC AVOID MDC HIT RATIO |
|
|
|
|
PRIVOPs PRIVOP/CMD DIAG/CMD DIAG 04/CMD DIAG 08/CMD DIAG 0C/CMD DIAG 14/CMD DIAG 58/CMD DIAG 7C/CMD DIAG 98/CMD DIAG A4/CMD DIAG A8/CMD DIAG 214/CMD DIAG 270/CMD SIE/CMD SIE INTCPT/CMD FREE TOTL/CMD |
|
|
|
|
VTAM or TCPIP Machines WKSET (V) TOT CPU/CMD (V) CP CPU/CMD (V) VIRT CPU/CMD (V) DIAG 98/CMD (V) |
|
|
|
|
| Note: 9121-742, 4 processors; 1024 MB real storage, 1024 MB expanded storage; VM/ESA 2.3.0; 5100 users; FS8F0R workload; T=TPNS, V=VMPRF, H=Hardware Monitor, Unmarked=RTM | ||||
Back to Table of Contents.
Comparison of CMS1 to FS8F
This section compares the new CMS1 workload to the FS8F0R workload it was derived from. These two workloads are described in CMS-Intensive (CMS1) and CMS-Intensive (FS8F). CMS1 has been set up so that it can be run with the TPNS driver running on a separate system (external TPNS) or with TPNS running in the measured system (internal TPNS) so both cases are shown in the comparison. FS8F0R is the all-minidisks (no SFS) variation of FS8F.
The comparison measurements were obtained on a 9121-480 processor configured with 256M real storage and no expanded storage, running VM/ESA 2.4.0. Default MDC tuning was used.
Each measurement was done with the number of users adjusted so as to result in an average processor utilization of about 90%. Because CMS1 uses much more processor time per user, the CMS1 cases require a much lower number of users than FS8F. This would have resulted in the CMS1 cases running with zero paging while the FS8F case runs with significant paging. To avoid having this distort the comparison, we locked sufficient pages in the CMS1 cases so that the number of available pages per user was similar for all three measurements.
The CMS1 with internal TPNS case was run without collection of TPNS log data. This is to reflect how we normally run this case (it can also be run with TPNS logging enabled). Because of this, all of the TPNS-related measures (marked (T)) are not available for this case except for ETR (T), which is available from the 1-minute interval TPNS messages.
The results are summarized in Table 1 (absolute results) and Table 2 (results relative to the FS8F measurement).
Some measures, such as think time, are intrinsic to the workload or are closely related to it. Other measures, such as response time, depend upon many factors (such as processor speed, I/O configuration, and degree of loading) in addition to the workload itself. In the results tables, an asterisk (*) denotes measures that primarily result from the workload itself 1 and that are therefore especially useful for characterizing the differences between these workloads.
From the results tables, we can draw the following conclusions regarding how CMS1 with external TPNS compares to FS8F:
- Think time is lower.
- Processor requirements per command are higher because of CPU usage by the TPNS virtual machine.
- The above two factors mean that the number of users required for a given processor configuration is much lower.
- The TV ratio is lower, meaning that there is less CP processing and more emulation (virtual machine) processing.
- I/Os per command are higher. However, this is because each command does more processing. I/Os per CPU-second consumed by the system are similar. Because total system CPU utilization is about the same for all three measurements, this can be seen by comparing VIO RATE.
Most of these differences also apply to CMS1 with internal TPNS. However CMS1 with internal TPNS is different from CMS1 with external TPNS in some ways. All these differences result from the fact that TPNS is running in the measured system. The workload scripts run exactly the same in either case.
- Processor requirements per command are higher because of the TPNS virtual machine(s).
- I/Os per command or per second are lower because no I/Os are required to communicate with the system running TPNS. Instead of I/Os, this communication is between virtual machines using IUCV, which results in a large increase in PRIVOP/CMD.
AVG THINK (T) was not available for the internal TPNS measurement because TPNS log records were not collected. Other measurements with TPNS logging enabled confirm that think time is the same as for CMS1 with external TPNS.
Table 1. FS8F to CMS1 Comparison
Workload TPNS TPNS Log Data Locked Pages Users Run ID | FS8F External yes 0 1800 L2BE1804 | CMS1 External yes 51000 280 L2BC0280 | CMS1 Internal no 46400 230 L2BC0230 |
|---|---|---|---|
Response Time TRIV INT NONTRIV INT TOT INT TOT INT ADJ AVG FIRST (T) AVG LAST (T) |
|
|
|
Throughput AVG THINK (T) * ETR ETR (T) ETR RATIO ITR (H) ITR EMUL ITR |
|
|
|
Proc. Usage PBT/CMD (H) * PBT/CMD CP/CMD (H) CP/CMD EMUL/CMD (H) EMUL/CMD |
|
|
|
Processor Util. TOTAL (H) TOTAL UTIL/PROC (H) UTIL/PROC TOTAL EMUL (H) TOTAL EMUL MASTER TOTAL (H) MASTER TOTAL MASTER EMUL (H) MASTER EMUL TVR(H) * TVR |
|
|
|
Paging READS/SEC WRITES/SEC PAGE/CMD PAGE IO RATE (V) PAGE IO/CMD (V) XSTOR IN/SEC XSTOR OUT/SEC XSTOR/CMD FAST CLR/CMD |
|
|
|
Queues DISPATCH LIST ELIGIBLE LIST |
|
|
|
I/O VIO RATE * VIO/CMD * RIO RATE (V) RIO/CMD (V) NONPAGE RIO/CMD (V) * DASD RESP TIME (V) MDC REAL SIZE (MB) MDC XSTOR SIZE (MB) MDC READS (I/Os) MDC WRITES (I/Os) MDC AVOID MDC HIT RATIO |
|
|
|
PRIVOPs PRIVOP/CMD * DIAG/CMD * DIAG 04/CMD DIAG 08/CMD DIAG 0C/CMD DIAG 14/CMD DIAG 58/CMD DIAG 98/CMD DIAG A4/CMD DIAG A8/CMD DIAG 214/CMD DIAG 270/CMD SIE/CMD * SIE INTCPT/CMD FREE TOTL/CMD |
|
|
|
| Note: 9121-480; 2 processors; 256M central storage, no expanded storage; real MDC: default; VM/ESA 2.4.0; T=TPNS, H=Hardware Monitor, V=VMPRF, Unmarked=RTM, * = workload characterization item | |||
Table 2. FS8F to CMS1 Comparison - Ratios
Workload TPNS TPNS Log Data Locked Pages Users Run ID | FS8F External yes 0 1800 L2BE1804 | CMS1 External yes 51000 280 L2BC0280 | CMS1 Internal no 46400 230 L2BC0230 |
|---|---|---|---|
Response Time TRIV INT NONTRIV INT TOT INT TOT INT ADJ AVG FIRST (T) AVG LAST (T) |
|
|
|
Throughput AVG THINK (T) * ETR ETR (T) ETR RATIO ITR (H) ITR EMUL ITR |
|
|
|
Proc. Usage PBT/CMD (H) * PBT/CMD CP/CMD (H) CP/CMD EMUL/CMD (H) EMUL/CMD |
|
|
|
Processor Util. TOTAL (H) TOTAL UTIL/PROC (H) UTIL/PROC TOTAL EMUL (H) TOTAL EMUL MASTER TOTAL (H) MASTER TOTAL MASTER EMUL (H) MASTER EMUL TVR(H) * TVR |
|
|
|
Paging READS/SEC WRITES/SEC PAGE/CMD PAGE IO RATE (V) PAGE IO/CMD (V) FAST CLR/CMD |
|
|
|
Queues DISPATCH LIST ELIGIBLE LIST |
|
|
|
I/O VIO RATE * VIO/CMD * RIO RATE (V) RIO/CMD (V) NONPAGE RIO/CMD (V) * DASD RESP TIME (V) MDC REAL SIZE (MB) MDC READS (I/Os) MDC WRITES (I/Os) MDC AVOID MDC HIT RATIO |
|
|
|
PRIVOPs PRIVOP/CMD * DIAG/CMD * DIAG 04/CMD DIAG 08/CMD DIAG 0C/CMD DIAG 14/CMD DIAG 58/CMD DIAG 98/CMD DIAG A4/CMD DIAG A8/CMD DIAG 214/CMD DIAG 270/CMD SIE/CMD * SIE INTCPT/CMD FREE TOTL/CMD |
|
|
|
| Note: 9121-480; 2 processors; 256M central storage, no expanded storage; real MDC: default; VM/ESA 2.4.0; T=TPNS, H=Hardware Monitor, V=VMPRF, Unmarked=RTM, * = workload characterization item | |||
Footnotes:
- 1
- For some of the marked measures, this is true only for the comparison shown. For example, NONPAGE RIO/CMD (V) would change substantially if one run used minidisk caching while another run did not. For these measurements, however, the same MDC tuning was used for all three runs and the MDC hit ratio was similar for all 3 cases.
Back to Table of Contents.
Workloads
This appendix describes workloads used to evaluate z/VM performance.
AWM
Apache
IOzone
Linux OpenSSL Exerciser
z/OS SSL Performance Workload
z/OS ICSF Performance Workload
z/OS DB2 Utility Workload
z/OS Java Encryption Performance Workload
CMS-Intensive (FS8F)
CMS-Intensive (CMS1)
VSE Guest (DYNAPACE)
z/OS File System Performance Tool
z/OS IP Security Performance Workload
Virtual Storage Exerciser
Ping
PFAULT
BLAST
ISFC Workloads
IO3390 Workload
z/VM HiperDispatch Workloads
Daytrader Workload
Master Processor Workload
Back to Table of Contents.
AWM Workload
We use the Application Workload Modeler (AWM) product, and an IBM-internal, pre-product version of AWM, to do connectivity measurements. We have editions of these two programs that run on Linux on System z. We also have editions that run on CMS.
For the Linux workloads, we run one Linux guest containing n AWM client processes, and we connect it to one Linux guest containing the corresponding n AWM server processes.
For the CMS workloads, we run n CMS client guests, each one running AWM. We connect those to n corresponding CMS server guests, each also running a copy of AWM.
The AWM workloads we use are request-response (RR), streaming (STR), and connect-request-response (CRR). The RR workload is like Telnet in that it is like an interactive session where the client connects, then small amounts of data are sent and received, then disconnects when finished. The STR workload is like FTP. The client connects, then a large amount of data is sent (or received) with a small amount of data in the response. Again the client disconnects when finished. The CRR workload is similar to a web connection where the client connects to the server, sends a request, receives a moderately-sized response, and then disconnects. This is repeated as many times as requested by the workload input. All three workloads are run with zero think time.
Our connectivity measurements for RR consist of the client side sending 200 bytes to the server and the server responding with 1000 bytes. This interaction is repeated for 200 seconds. The STR workload consists of the client sending 20 bytes to the server and the server responding with 20 MB. This sequence is repeated for 400 seconds. The CRR workload consists of the client connecting, sending 64 bytes to the server, receiving 8K from the server and disconnecting. This is repeated for 200 seconds.
A complete set of runs is done for each of the workloads shown in the following table, varying the maximum transmission unit (MTU) size. The connections referred to in the table are sometimes also referred to as client-server pairs, since the connection is between a client and a server.
| Device Type | Workload | MTU sizes we use | Number of connections |
|---|---|---|---|
| Real HiperSockets | RR | 8192 | 1, 10, 50 |
| STR | 8192, 56K | 1, 10, 50 | |
| Guest LAN HiperSockets | RR | 8192 | 1, 10, 50 |
| STR | 8192, 56K | 1, 10, 50 | |
| Real QDIO | RR | 1492 | 1, 10, 50 |
| STR | 1492, 8992 | 1, 10, 50 | |
| Guest LAN QDIO | RR | 1492 | 1, 10, 50 |
| STR | 1492, 8992 | 1, 10, 50 | |
| VSwitch | RR | 1492 | 1, 10, 50 |
| STR | 1492, 8992 | 1, 10, 50 | |
| IUCV | RR,CRR,STR | 1492, 8992, 16384, 32760, 57344 | 1, 10, 20, 50 |
| Virtual CTC | RR,CRR,STR | 1492, 8992, 16384, 32760 | 1, 10, 20, 50 |
| ESCON CTC | RR,CRR,STR | 1492, 8992, 16384, 32760 | 1, 10, 20, 50 |
Back to Table of Contents.
Apache Workload
This workload consists of a Linux client application and a Linux server application that execute on the same z/VM system and are connected by a guest LAN (QDIO simulation) or Virtual Switch (VSwitch). The client application is the Application Workload Modeler product (AWM), imitating a web browser. The Linux server application is a web server that serves static HTML files. Each AWM client application can have multiple connections to each server application. Consequently, the total number of connections is the product of these three numbers (servers, clients, client connections per server). For each connection, a URL is randomly selected. AWM uses the same random number seed for all client connections.
This workload can be used to create a number of unique measurement environments by varying the following items:
- number of server virtual machines
- number of client virtual machines
- number of client connections per server
- number of files
- size of the files
- location of the files
- size of the server virtual machine
- number of virtual processors for the client
- number of virtual processors for the server
Performance data for Apache workload measurements are collected from the start of the workload until the last AWM client has reported completion to the AWM client controller. In some measurements, characteristics during the steady-state period (all clients are active) are more suitable for explanations. When used, they will be specifically identified as steady-state values.
Here is a list of unique workload scenarios that have been created and measured:
- A non-constrained workload can be created by using a small number of small URL files.
- A Linux I/O workload scenario can be created by using a set of URL files that greatly exceeds the virtual storage size of the Linux server virtual machines.
- Preloading all the URL files into a large z/VM Minidisk Cache (MDC) creates a workload scenario with a lot of Linux I/O but without any real I/O. Depending on the scenario desired, MDC can be configured either to use only central, or only XSTORE, or a mix.
- A z/VM storage usage workload can be created by using a large set of URL files that all fit in the Linux page caches (sometimes aka file caches) of the server virtual machines.
- A z/VM expanded storage paging workload can be created using the previously described storage usage workload in a configuration that has a lot of expanded storage but doesn't have enough real storage to support the working set characteristics of the application.
- A z/VM mixed paging workload can be created using the previously described storage usage workload in a configuration that has a large DASD paging subsystem but doesn't have enough real storage and expanded storage to support the working set characteristics of the application.
- A z/VM DASD paging workload can be created using the previously described storage usage workload in a configuration that has a large DASD paging subsystem, no expanded storage, and doesn't have enough real storage to support the working set characteristics of the application.
- A z/VM Single System Image mode (SSI-mode) workload can be created by running up to four separate sets of client/server pairs. Within a set there can be multiple clients communicating with multiple servers. The four sets run independently of each other thus allowing the workload to be equally distributed across a 2-member or a 4-member SSI cluster. The four sets may also run in the same z/VM image. Apache SSI-mode requires the Linux guests to be connected by VSwitch.
Back to Table of Contents.
Linux IOzone Workload
To do disk performance studies, we often use a Linux guest running the tool IOzone. IOzone is a publicly available disk performance analyzer. It runs on a number of platforms. See iozone.org for more information.
IOzone is a straightforward file system exerciser that measures disk performance through the following four-phase experiment:
- It creates a new file and writes it from beginning to end;
- It rewrites the file;
- It reads the file it just wrote;
- It rereads the file it just wrote.
Each of the four phases operates on the file in an interlaced fashion. By interlaced we mean that the file is not just sequentially handled from beginning to end. Rather, IOzone uses an input parameter called the stride to handle a record, skip over many records, handle another record, skip again, and so on, proceeding in modulus fashion until all records have been handled. For example, during the write pass, if the stride were set to 17 records, IOzone would write records 0, 17, 34, 51, ..., 1, 18, 35, ..., and so on until all records were written.
IOzone measures the elapsed time it experiences during each of the four phases of its experiment and prints the KB-per-second data rate it experiences in each phase.
To collect processor time per transaction, we use the zSeries hardware sampler to measure processor time. We define a transaction to be 100 KB handled through the four phases of the IOzone run. In other words, we define that the run contains 8192 transactions.
We run IOzone as follows:
- Linux guest virtual machine size is 192 MB.
- Linux file system is ext2.
- Ballast file 800 MB.
- Record size 64 KB.
- Processor cache size set to 1024 Kbytes.
- Processor cache line size set to 256 bytes.
- File stride size set to 17 * record size.
- Throughput test with 1 process.
- Include fsync in write timing.
It is important to notice that we chose the ballast file to be about four times larger than the virtual machine. This ensures that the Linux page cache plays little to no role in buffering IOzone's file operations. We wanted to be sure to measure disk I/O performance, not the performance of the Linux page cache.
We measure several different choices for disk technology, as described in the following table. The abbreviations explained in the table below appear elsewhere in this report as shorthand so as to describe the configurations measured.
Regarding block size, the following notes apply:
- For mke2fs, we use block sizes (-bs parameter) of 1024, 2048, or 4096 bytes, as called out in the tables below.
- On ECKD DASD, the formatting of the DASD tracks matches the -bs setting we use in mke2fs.
- On FBA DASD, the volumes are always formatted at 512 bytes per block.
| Run | Subsystem | Disk type | Attachment | MDC setting | Linux driver | Block size |
|---|---|---|---|---|---|---|
| EDED | 2105-F20 FICON | ECKD | Dedicated | n/a | ECKD SSCH | 4096 |
| EMD0 | 2105-F20 FICON | ECKD | Minidisk | OFF | ECKD SSCH | 4096 |
| EMD1 | 2105-F20 FICON | ECKD | Minidisk | ON | ECKD SSCH | 4096 |
| FDED | 2105-F20 FCP | Emulated FBA | Dedicated | n/a | FBA SSCH | 4096 |
| FMD0 | 2105-F20 FCP | Emulated FBA | Minidisk | OFF | FBA SSCH | 4096 |
| FMD1 | 2105-F20 FCP | Emulated FBA | Minidisk | ON | FBA SSCH | 4096 |
| 9DED | FAStT900 FCP with EDEV attribute FASTT | Emulated FBA | Dedicated | n/a | FBA SSCH | 4096 |
| 9MD0 | FAStT900 FCP with EDEV attribute FASTT | Emulated FBA | Minidisk | OFF | FBA SSCH | 4096 |
| 9MD1 | FAStT900 FCP with EDEV attribute FASTT | Emulated FBA | Minidisk | ON | FBA SSCH | 4096 |
| LNS0 | 2105-F20 FCP | SCSI | Linux owns FCP adapter subchannel | n/a | zFCP | 4096 |
| D210 | 2105-F20 FICON | ECKD | Minidisk | OFF | Diag X'250' | 1024 |
| D211 | 2105-F20 FICON | ECKD | Minidisk | ON | Diag X'250' | 1024 |
| D220 | 2105-F20 FICON | ECKD | Minidisk | OFF | Diag X'250' | 2048 |
| D221 | 2105-F20 FICON | ECKD | Minidisk | ON | Diag X'250' | 2048 |
| D240 | 2105-F20 FICON | ECKD | Minidisk | OFF | Diag X'250' | 4096 |
| D241 | 2105-F20 FICON | ECKD | Minidisk | ON | Diag X'250' | 4096 |
| G210 | 2105-F20 FCP | Emulated FBA | Minidisk | OFF | Diag X'250' | 1024 |
| G211 | 2105-F20 FCP | Emulated FBA | Minidisk | ON | Diag X'250' | 1024 |
| G220 | 2105-F20 FCP | Emulated FBA | Minidisk | OFF | Diag X'250' | 2048 |
| G221 | 2105-F20 FCP | Emulated FBA | Minidisk | ON | Diag X'250' | 2048 |
| G240 | 2105-F20 FCP | Emulated FBA | Minidisk | OFF | Diag X'250' | 4096 |
| G241 | 2105-F20 FCP | Emulated FBA | Minidisk | ON | Diag X'250' | 4096 |
Back to Table of Contents.
Linux OpenSSL Exerciser
This tool consists of the following applications:
- a single threaded server with secure mode and no session ID caching
- a single threaded server with non-secure mode and no session ID caching
- a single threaded server with secure mode and session ID caching
- a single threaded server with non-secure mode and session ID caching
- a single threaded client with secure mode and no session ID caching
- a single threaded client with non-secure mode and no session ID caching
A shell script is used to establish the environment and set the client and server parameters for a given measurement.
The shell script allows a selection of the following parameters to determine the unique characteristics for any measurement. It then starts the server application and the specified number of client applications with the appropriate parameters.
- cipher used for data encryption
- client authentication
- number of connections per iteration
- number of packets per iteration
- number of bytes to be sent in each packet
- number of bytes to be returned in each packet
- server session ID timeout
- client session ID timeout
- measurement duration
- host address
- host port
- engine
In addition to these specific parameters, SSL allows other variations in the workload.
- key size for certificates.
The server application, server, is a single threaded program that opens a socket and listens for client requests.
Back to Table of Contents.
z/OS Secure Sockets Layer (System SSL) Performance Workload
This tool consists of a client application and a server application. A shell script is used to establish the environment and set the client and server parameters for a given measurement.The shell script allows a selection of the following parameters to determine the unique characteristics for any measurement. It then starts the server application and the specified number of client applications with the appropriate parameters.
- Security type.
- Cipher used for data encryption.
- Client Authentication.
- Number of server worker threads.
- Number of connections per iteration.
- Number of packets per iteration.
- Number of bytes to be sent in each packet.
- Number of bytes to be returned in each packet.
- Server Session ID timeout.
- Client Session ID timeout.
- Measurement duration.
- Host Address.
- Host Port.
In addition to these specific parameters, SSL allows other variations in the workload.
- Key size for certificates.
- Server Session ID cache size.
- Client Session ID cache size.
The server application, server, is a multithreaded program that opens a socket and listens for client requests. server can run in either secure (using SSL) mode or non-secure (using normal socket reads and writes) mode. By default, server runs with one socket listener thread and 20 server threads. The socket listener thread waits for connections from clients and puts each request onto the work list. The server threads dequeue requests and then perform the work.
The client application, client, is a single threaded program that connects to the server program and exchanges one or more data packets. client can also run in secure or non-secure mode, but its mode must match the mode of the server to which it is connecting. The number of connections, the number of read/write packets per connection, the number of bytes in each write packet, and the number of bytes in each read packet can be specified. Multiple clients can be run simultaneously to the same server.
Back to Table of Contents.
z/OS DB2 Utility Workload
The DB2 Utility Workload consists of four separate jobs that can be run separately or in sequence.
- a setup job that drops and recreates an empty database
- a job to load records into the empty database
- a job to reorganize the data in a fully populated database
- a job to create run statistics for a fully populated database
A REXX EXEC is used to create unique combinations of these 4 independent jobs.
For our specialty engine DB2 Utility Workload, the REXX EXEC contained 4 executions of the setup job followed by the load job.
At the end of the each execution, these jobs provide information about the number of records processed and the elapsed time to complete. A quantitative transaction rate can thus be calculated for any measurement.
Back to Table of Contents.
z/OS Java Encryption Performance Workload
This tool consists of a Java encryption application that allows a selection of the following parameters to determine the unique characteristics for any measurement. It then starts the application with the specified parameters.
- number of threads
- number of bytes to be encrypted
- cipher used for data encryption
- measurement duration
Each transaction generates a new key, the same key is not used over and over by all of the transactions. This way each transaction represents a client doing an entire bulk encryption sequence.
At the end of the measurement duration it provides information about the number of encryptions that were completed.
Back to Table of Contents.
z/OS Integrated Cryptographic Service Facility (ICSF) Performance Workload
The z/OS Integrated Cryptographic Service Facility (ICSF) Performance Workload consists of a series of Test Case driver programs, written in S/390 Assembler Language. These driver programs are combined in various ways to create the desired workload for a specific measurement.
- PCAX Sweep:
this sweep includes:
- Test cases which must use the PCICA card on the z990.
- XCDB Sweep:
this sweep includes:
- Test cases which must use the PCIXCC card on the z990, have only DES keys, and are measured by byte rate.
- XCDC Sweep:
this sweep includes:
- Test cases which must use the PCIXCC card on the z990, have only DES keys, and are measured by call rate.
- XCPB Sweep:
this sweep includes:
- Test cases which must use the PCIXCC card on the z990, have PKA keys, and are measured by byte rate.
- XCPC Sweep:
this sweep includes:
- Test cases which must use the PCIXCC card on the z990, have PKA keys, and are measured by call rate.
- Multiple Job Sweep: multiple copies of each test case are executed concurrently, and the test cases are run serially.
- Single Job Sweep: a single copy of each test case is executed, and the test cases are run serially.
- Single Test Case: one or more copies of a test case are executed while measurement data is collected.
Back to Table of Contents.
CMS-Intensive (FS8F)
Workload Description
FS8F simulates a CMS user environment, with variations simulating
a minidisk environment, an SFS environment, or some combination of
the two. Table 1 shows the search-order
characteristics of the two environments used for measurements
discussed in this document.
Table 1. FS8F workload characteristics
|
| Number of Files |
|
|
|---|---|---|---|---|
A B C D E F G S Y | R/W R/W R/O R/W R/O R/O R/O R/O R/O | 100 0 500 500 500 500 500 m n | minidisk minidisk minidisk minidisk minidisk minidisk minidisk minidisk minidisk | SFS SFS SFS (DS) SFS SFS (DS) SFS (DS) SFS (DS) minidisk minidisk |
| Note: m and n are the number of files normally found on the the S- and Y-disks respectively. (DS) signifies the use of VM Data Spaces. | ||||
The measurement environments have the following characteristics in common:
- A Bactrian-distribution think time averaging 30 seconds is used. (See Glossary of Performance Terms for an explanation of Bactrian distribution.)
- The workload is continuous in that scripts, repeated as often as required, are always running during the measurement period.
- Teleprocessing Network Simulator (TPNS) simulates users for the workload. TPNS runs in a separate processor and simulates LU2 terminals. User traffic travels between the processors through 3088 multisystem channel communication units.
FS8F Variations
Two FS8F workload variants were used for measurements, one for minidisk-based CMS users, and the other for SFS-based CMS users.
FS8F0R Workload: All filemodes are accessed as minidisk; SFS is not used. All of the files on the C-disk have their FSTs saved in a shared segment.
FS8FMAXR Workload: All file modes, except S and Y (which SFS does not support), the HELP minidisk, and T-disks that are created by the workload, are accessed as SFS directories. The CMSFILES shared segment is used. All read-only SFS directories are defined with PUBLIC READ authority and are mapped to VM data spaces. The read/write SFS directory accessed as file mode D is defined with PUBLIC READ and PUBLIC WRITE authority. The read/write SFS directories accessed as file modes A and B are private directories.
FS8F Licensed Programs
The following licensed programs were used in the FS8F measurements described in this document:
- VS COBOL II Compiler and Library V1R4M0
- Document Composition Facility V1R4M0
- VS FORTRAN Compiler/Library/Debug V2R5M0
- IBM High Level Assembler V1R2M0
- OS PL/I V2R3M0 Compiler & Library
- C & PL/I Common Library V1R2M0
- VTAM V3R4M1 (VTAM runs only)
- NCP V5R4M0 (VTAM runs only)
Shared Segments
CMS allows the use of saved segments for shared code. Using saved segments can greatly improve performance by reducing end users' working set sizes and thereby decreasing paging. The FS8F workload uses the following saved segments:
CMS | Contains the CMS nucleus and file status tables (FSTs) for the S- and Y-disks. |
CMSPIPES | Contain CMSPIPES code in the PIPES logical segment. |
CMSINST | Contains the execs-in-storage segment. |
CMSVMLIB | Contains the following logical segments:
|
HELP | Contains FSTs for the HELP disk. |
GOODSEG | Contains FSTs for the C-disk. The C-disk is in the CMS search order used by the CMS1 workload and the minidisk version of the FS8F workload. |
FORTRAN | This segment space has two members: DSSVFORT for the FORTRAN compiler and FTNLIB20 for the library composite modules. |
DSMSEG4B | Contains DCF (Document Composition Facility) code. |
GCSXA | Contains the GCS nucleus. |
VTAMXA | Contains the VTAM code. |
Measurement Methodology
A calibration is made to determine how many simulated users are required to attain the desired processor utilization for the baseline measurement. That number of users is used for all subsequent measurements on the same processor and for the same environment.
The measurement proceeds as follows:
- All of the users are logged on by TPNS.
- A script is started for each user after a random delay of up to 15 minutes. (The random delay prevents all users from starting at once.)
- A stabilization period (the length depending on the processor used) is allowed to elapse so that start-up anomalies and user synchronization are eliminated.
- At the end of stabilization, measurement tools are started simultaneously to gather data for the measurement interval.
- At the end of the measurement interval, the performance data is reduced and analyzed.
FS8F Script Description
FS8F consists of 3 initialization scripts and 17 workload scripts. The
LOGESA script is run at logon to set up the required search order and
CMS configuration. Then users run the WAIT script, during which they
are inactive and waiting to start the CMSSTRT script. The
CMSSTRT script is run to stagger the start of user activity over a 15
minute interval. After the selected interval, each user starts running
a general workload script. The scripts are summarized in
Table 2.
Table 2. FS8F workload script summary
Script Name | % Used | Script Description |
|---|---|---|
LOGESA WAIT CMSSTRT ASM617F ASM627F XED117F XED127F XED137F XED147F COB217F COB417F FOR217F FOR417F PRD517F DCF517F PLI317F PLI717F WND517F WND517FL HLP517F | * * * 5 5 5 10 10 10 5 5 5 5 5 5 5 5 8 2 5 | Logon and Initialization Wait state Stagger start of user activity Assemble (HLASM) and Run Assemble and Run Edit a VS BASIC Program Edit a VS BASIC Program Edit a COBOL Program Edit a COBOL Program COBOL Compile Run a COBOL Program VS FORTRAN Compile FORTRAN Run Productivity Aids Session Edit and Script a File PL/I Optimizer Session PL/I Optimizer Session Run Windows with IPL CMS Run Windows with LOGON/LOGOFF Use HELP |
| Note: Scripts with an asterisk (*) in the "% Used" column are run only once each for each user during initialization. | ||
The following are descriptions of each script used in the FS8F workload.
LOGESA: Initialization Script:
 LOGON userid
 SET AUTOREAD ON
 IF FS8F0R workload
 THEN
     Erase extraneous files from A-disk
     Run PROFILE EXEC to access correct search order,
       SET ACNT OFF, SPOOL PRT CL D, and TERM LINEND OFF
 ELSE
     Erase extraneous files from A-directory
     Run PROFILE EXEC to set correct search order, SET ACNT OFF,
       SPOOL PRT CL D, and TERM LINEND OFF
 END
 Clear the screen
 SET REMOTE ON
WAIT: Ten-Second Pause:
Leave the user inactive in a 10-second wait loop.
CMSSTRT: Random-Length Pause:
Delay, for up to 15 minutes, the start for each user to prevent all users
from starting scripts at the same time.
ASM617F: Assemble (HLASM) and Run:
 QUERY reader and printer
 SPOOL PRT CLASS D
 XEDIT an assembler file and QQUIT
 GLOBAL appropriate MACLIBs
 LISTFILE the assembler file
 Assemble the file using HLASM (NOLIST option)
 Erase the text deck
 Repeat all the above except for XEDIT
 Reset GLOBAL MACLIBs
 Load the text file (NOMAP option)
 Generate a module (ALL and NOMAP options)
 Run the module
 Load the text file (NOMAP option)
 Run the module 2 more times
 Erase extraneous files from A-disk
ASM627F: Assemble (F-Assembler) and Run:
 QUERY reader and printer
 Clear the screen
 SPOOL PRT CLASS D
 GLOBAL appropriate MACLIBs
 LISTFILE assembler file
 XEDIT assembler file and QQUIT
 Assemble the file (NOLIST option)
 Erase the text deck
 Reset GLOBAL MACLIBs
 Load the TEXT file (NOMAP option)
 Generate a module (ALL and NOMAP options)
 Run the module
 Load the text file (NOMAP option)
 Run the module
 Load the text file (NOMAP option)
 Run the module
 Erase extraneous files from A-disk
 QUERY DISK, USERS, and TIME
XED117F: Edit a VS BASIC Program:
 XEDIT the program
 Get into input mode
 Enter 29 input lines
 Quit without saving file (QQUIT)
XED127F: Edit a VS BASIC Program:
 Do a FILELIST
 XEDIT the program
 Issue a GET command
 Issue a LOCATE command
 Change 6 lines on the screen
 Issue a TOP and BOTTOM command
 Quit without saving file
 Quit FILELIST
 Repeat all of the above statements, changing 9 lines instead of 6 and
   without issuing the TOP and BOTTOM commands
XED137F: Edit a COBOL Program:
 Do a FILELIST
 XEDIT the program
 Issue a mixture of 26 XEDIT file manipulation commands
 Quit without saving file
 Quit FILELIST
XED147F: Edit a COBOL Program:
 Do a FILELIST
 XEDIT the program
 Issue a mixture of 3 XEDIT file manipulation commands
 Enter 19 XEDIT input lines
 Quit without saving file
 Quit FILELIST
COB217F: Compile a COBOL Program:
 Set ready message short
 Clear the screen
 LINK and ACCESS a disk
 QUERY link and disk
 LISTFILE the COBOL program
 Invoke the COBOL compiler
 Erase the compiler output
 RELEASE and DETACH the linked disk
 Set ready message long
 SET MSG OFF
 QUERY SET
 SET MSG ON
 Set ready message short
 LINK and ACCESS a disk
 LISTFILE the COBOL program
 Run the COBOL compiler
 Erase the compiler output
 RELEASE and DETACH the linked disk
 QUERY TERM and RDYMSG
 Set ready message long
 SET MSG OFF
 QUERY set
 SET MSG ON
 PURGE printer
 Define temporary disk space for 2 disks using an EXEC
 Clear the screen
 QUERY DASD and format both temporary disks
 Establish 4 FILEDEFs for input and output files
 QUERY FILEDEFs
 GLOBAL TXTLIB
 Load the program
 Set PER Instruction
 Start the program
 Display registers
 End PER
 Issue the BEGIN command
 QUERY search of minidisks
 RELEASE the temporary disks
 Define one temporary disk as another
 DETACH the temporary disks
 Reset the GLOBALs and clear the FILEDEFs
FOR217F: Compile 6 VS FORTRAN Programs:
 NUCXDROP NAMEFIND using an EXEC
 Clear the screen
 QUERY and PURGE the reader
 Compile a FORTRAN program
 Issue INDICATE commands
 Compile another FORTRAN program
 Issue INDICATE commands
 Compile another FORTRAN program
 Issue INDICATE command
 Clear the screen
 Compile a FORTRAN program
 Issue INDICATE commands
 Compile another FORTRAN program
 Issue INDICATE commands
 Compile another FORTRAN program
 Clear the screen
 Issue INDICATE command
 Erase extraneous files from A-disk
 PURGE the printer
FOR417F: Run 2 FORTRAN Programs:
 SPOOL PRT CLASS D
 Clear the screen
 GLOBAL appropriate text libraries
 Issue 2 FILEDEFs for output
 Load and start a program
 Rename output file and PURGE printer
 Repeat above 5 statements for two other programs, except
   erase the output file for one and do not issue spool printer
 List and erase output files
 Reset GLOBALs and clear FILEDEFs
PRD517F: Productivity Aids Session:
 Run an EXEC to set up names file for user
 Clear the screen
 Issue NAMES command and add operator
 Locate a user in names file and quit
 Issue the SENDFILE command
 Send a file to yourself
 Issue the SENDFILE command
 Send a file to yourself
 Issue the SENDFILE command
 Send a file to yourself
 Issue RDRLIST command, PEEK and DISCARD a file
 Refresh RDRLIST screen, RECEIVE an EXEC on B-disk, and quit
 TRANSFER all reader files to punch
 PURGE reader and punch
 Run a REXX EXEC that generates 175 random numbers
 Run a REXX EXEC that reads multiple files of various sizes from
   both the A-disk and C-disk
 Erase EXEC off B-disk
 Erase extraneous files from A-disk
DCF517F: Edit and SCRIPT a File:
 XEDIT a SCRIPT file
 Input 25 lines
 File the results
 Invoke SCRIPT processor to the terminal
 Erase SCRIPT file from A-disk
PLI317F: Edit and Compile a PL/I Optimizer Program:
 Do a GLOBAL TXTLIB
 Perform a FILELIST
 XEDIT the PL/I program
 Run 15 XEDIT subcommands
 File the results on A-disk with a new name
 Quit FILELIST
 Enter 2 FILEDEFs for compile
 Compile PL/I program using PLIOPT
 Erase the PL/I program
 Reset the GLOBALs and clear the FILEDEFs
 COPY names file and RENAME it
 TELL a group of users one pass of script run
 ERASE names file
 PURGE the printer
PLI717F: Edit, Compile, and Run a PL/I Optimizer Program:
 Copy and rename the PL/I program and data file from C-disk
 XEDIT data file and QQUIT
 XEDIT a PL/I file
 Issue RIGHT 20, LEFT 20, and SET VERIFY ON
 Change two lines
 Change filename and file the result
 Compile PL/I program using PLIOPT
 Set two FILEDEFs and QUERY the settings
 Issue GLOBAL for PL/I transient library
 Load the PL/I program (NOMAP option)
 Start the program
 Type 8 lines of one data file
 Erase extraneous files from A-disk
 Erase extra files on B-disk
 Reset the GLOBALs and clear the FILEDEFs
 TELL another USERID one pass of script run
 PURGE the printer
 SET FULLSCREEN ON
 TELL yourself a message to create window
 QUERY DASD and reader
 Forward 1 screen
 TELL yourself a message to create window
 Drop window message
 Scroll to top and clear window
 Backward 1 screen
 Issue a HELP WINDOW and choose Change Window Size
 QUERY WINDOW
 Quit HELP WINDOWS
 Change size of window message
 Forward 1 screen
 Display window message
 TELL yourself a message to create window
 Issue forward and backward border commands in window message
 Position window message to another location
 Drop window message
 Scroll to top and clear window
 Display window message
 Erase MESSAGE LOGFILE
 IPL CMS
 SET AUTOREAD ON
 SET REMOTE ON
WND517FL: Use Windows with LOGON, LOGOFF:
 SET FULLSCREEN ON
 TELL yourself a message to create window
 QUERY DASD and reader
 Forward 1 screen
 TELL yourself a message to create window
 Drop window message
 Scroll to top and clear window
 Backward 1 screen
 Issue a help window and choose Change Window Size
 QUERY WINDOW
 Quit help windows
 Change size of window message
 Forward 1 screen
 Display window message
 TELL yourself a message to create window
 Issue forward and backward border commands in window message
 Position window message to another location
 Drop window message
 Scroll to top and clear window
 Display window message
 Erase MESSAGE LOGFILE
 LOGOFF user and wait 60 seconds
 LOGON user on original GRAF-ID
 SET AUTOREAD ON
 SET REMOTE ON
HLP517F: Use HELP and Miscellaneous Commands:
 Issue HELP command
 Choose HELP CMS
 Issue HELP HELP
 Get full description and forward 1 screen
 Quit HELP HELP
 Choose CMSQUERY menu
 Choose QUERY menu
 Choose AUTOSAVE command
 Go forward and backward 1 screen
 Quit all the layers of HELP
 RELEASE Z-disk
 Compare file on A-disk to C-disk 4 times
 Send a file to yourself
 Change reader copies to two
 Issue RDRLIST command
 RECEIVE file on B-disk and quit RDRLIST
 Erase extra files on B-disk
 Erase extraneous files from A-disk
Back to Table of Contents.
CMS-Intensive (CMS1)
Workload Description
CMS1 simulates a CMS user environment. CMS1 is based upon the FS8F0R minidisk-only variation of the FS8F workload described in CMS-Intensive (FS8F). The differences between CMS1 and FS8F are described here. Refer to the FS8F description for descriptions of those elements that are common to both workloads.
CMS1 was developed to more closely reflect the average characteristics that we have observed over the past few years for production customer CMS workloads. Those workloads tend to use significantly more I/O and processor resources per command than does the FS8F workload. See Comparison of CMS1 to FS8F for comparison measurement results.
As with FS8F, the Teleprocessing Network Simulator (TPNS) simulates users for the workload. TPNS can either be run in a separate processor that is connected to the measured VM system (external TPNS) or run within the measured VM system (internal TPNS).
CMS1 uses the same licensed programs as FS8F except that it does not use DCF.
In addition to being used for VM performance evaluation, the CMS1 workload (with internal TPNS) is used as the VM CMS workload for the Large System Performance Reference (LSPR) processor evaluation measurements.
CMS1 Script Description
CMS1 consists of 3 initialization scripts and 14 workload
scripts. The initialization scripts are identical to those used by
the FS8F workload and serve the same functions. Of the 17 workload
scripts in the FS8F workload, 12 of them are carried over from FS8F
without modification, 2 of them are modified, and 3 of them
(FOR417F, DCF517F, and WND517FL) are not used. Finally, the
frequency of execution weighting factor associated with each script
is often different from the one used for FS8F. The CMS1
scripts are summarized in Table 1.
Table 1. CMS1 Workload Script Summary
Script Name | % Used | Script Description |
|---|---|---|
LOGESA WAIT CMSSTRT ASM617F ASM627F XED117F XED127F XED137F XED147F COB217FL COB417F FOR217F PRD517FL PLI317F PLI717F WND517F HLP517F | * * * 5 12 5 5 5 5 5 5 10 25 5 5 5 3 | Logon and Initialization Wait state Stagger start of user activity Assemble (HLASM) and Run Assemble and Run Edit a VS BASIC Program Edit a VS BASIC Program Edit a COBOL Program Edit a COBOL Program COBOL Compiles Run a COBOL Program VS FORTRAN Compile Productivity Aids Session PL/I Optimizer Session PL/I Optimizer Session Run Windows with IPL CMS Use HELP |
| Note: Scripts with an asterisk (*) in the "% Used" column are run only once each for each user during initialization. | ||
Descriptions of the unmodified scripts can be found in CMS-Intensive (FS8F). The two modified scripts are COB217FL and PRD517FL. COB217FL is based on the COB217F script in FS8F, while PRD517FL is based on PRD517F. The two modified scripts in CMS1 are described below.
COB217FL: Compile COBOL Programs:
 Set ready message short
 Clear the screen
 LINK and ACCESS a disk
 Invoke the COBOL compiler (15 times)
 Erase the compiler output
 RELEASE and DETACH the linked disk
PRD517FL: Productivity Aids Session:
 Run an EXEC to set up names file for user
 Clear the screen
 Issue NAMES command and add operator
 Locate a user in names file and quit
 Filelist of the A disk
 Filelist of the C disk
 Run a REXX EXEC in a CMS pipeline that generates 500 random numbers
 Run a REXX EXEC that reads multiple files of various sizes from
   both the A-disk and C-disk
 Send a file to yourself
 Issue RDRLIST command, PEEK, and RECEIVE the file
 Run a REXX EXEC in a CMS pipeline that generates 500 random numbers
 Run a REXX EXEC that reads multiple files of various sizes from
   both the A-disk and C-disk
 Erase the file that was received
 Erase extraneous files from A-disk
Back to Table of Contents.
VSE Guest (DYNAPACE)
Workload Description
PACE is a synthetic VSE batch workload consisting of 7 unique jobs representing the commercial environment. This set of jobs is replicated 16 times, producing the DYNAPACE workload. The first 8 copies run in 8 static partitions and another 8 copies run in 4 dynamic classes, each configured with a maximum of 2 partitions. The 7 jobs are:
- YnDL/1
- YnSORT
- YnCOBOL
- YnBILL
- YnSTOCK
- YnPAY
- YnFORT
The programs, data, and work space for the jobs are all maintained by VSAM on separate volumes. DYNAPACE has about a 2:1 read/write ratio.
Measurement Methodology
The VSE system is configured with the full complement of 12 static partitions (BG, and F1 through FB). F4 through FB are the partitions used to run 8 copies of PACE. Four dynamic classes, each with 2 partition assignments, run another 8 copies of PACE.
The partitions are configured identically except for the job classes. The jobs and the partition job classes are configured so that the jobs are equally distributed over the partitions and so that, at any one time, the jobs currently running are a mixed representation of the 7 jobs.
When the workload is ready to run, the following preparatory steps are taken:
- CICS/ICCF is active but idle
- VTAM is active but idle
- The LST queue is emptied (PDELETE LST,ALL)
- The accounting file is deleted (J DEL)
Once performance data gathering is initiated for the system (hardware instrumentation and CP Monitor), the workload is started by releasing all of the batch jobs into the partitions simultaneously using the POWER command, PRELEASE RDR,*Y.
As the workload nears completion, various partitions will finish the work allotted to them. The finish time for both the first and last partitions is noted. Elapsed time is calculated as the total elapsed time from the moment the jobs are released until the last partition is waiting for work.
Back to Table of Contents.
z/OS File System Performance Tool
The File System Performance Tool (FPT), an IBM internal tool, consists of a POSIX application that can simulate a variety of environments though a selection of parameters to access a set of database files using several predefined read/write patterns and ratios.FTP supports the following four file system activities.
- Block random (br)
To use this test mode, the user must specify the size of the block. The minimum value of a block is 1 byte. The maximum value can be the size of the file, however, this is not recommended because of stability issues. Once the block size is established, a random file is picked from the DB set, a random location is picked in that file and a read or a write operation is performed (read or write is determined by a random number generator with a read/write ratio provided by the user). This is done for the entire duration of the test. At the beginning of each iteration, all of the points in the DB set have an equal chance of being selected.
- Block sequential (bs)
This test mode also requires the user to provide the block size. All of the same rules apply as in the block random test mode. Again, for stability reasons, it is not recommended to make the block size equal to the file size. Once the block size is established, a random file is picked from the DB set, a random location is picked in that file (just like in block random). After that, all of the reads are sequential. If an end of file is reached, the next file in the DB set is opened. If the last file has been reached, the first DB file is opened. At the beginning of the test all of the points in the DB set have an equal chance of being selected.
- Character random (cr)
This test mode is identical to the block random except the block size is predefined to be 1 byte.
- Character sequential (cs)
This test mode is identical to block sequential except the block size is predefined to be 1 byte.
- remove existing files? (yes or no)
- number of files to create (0 to 10,000)
- file size for created files (k=kB, m=mB, g=gB)
- number of paths (0 to number of files)
- number of processes (integer specifying the number of simulated users)
- test mode (br=block random, bs=block sequential, cs=character sequential, cr=character random)
- block size (k=kB, m=mB)
- RW ratio (0 to 100)
- run length (s seconds, m minutes, h hours)
- warm-up time (seconds)
Back to Table of Contents.
z/OS IP Security (IPSec) Performance Workload
This workload is actually an implementation of the z/OS SSL Performance Workload with the addition of IPSec processing. The application layer is not aware of IPSec processing, because IPSec processing is totally handled by the IP Layer of the TCP/IP stack. This combination of SSL and IPSec drives work to the zIIPs.The z/OS Communications Server lets portions of IPSec processing run on zIIPs. This feature, called "zIIP-Assisted IPSec", lets Communication Server interact with z/OS Workload Manager to have its enclave Service Request Block (SRB) work directed to zIIPs. Within z/OS V1R9 Communications Server, much of the processing related to security routines, such as encryption and authentication algorithms and AH|ESP protocol overhead, runs in enclave SRBs, and this enclave SRB workload can be directed to available zIIPs. With zIIP-Assisted IPSec, the zIIPs, in effect, become encryption engines. In addition to performing encryption processing, zIIPs also handle cryptographic validation of message integrity and IPSec header processing. The zIIPs, in effect, are high-speed IPSec protocol processing engines that provide better price-performance for IPSec processing.
IPSec is a suite of protocols and standards defined by the Internet Engineering Task Force (IETF) to provide an open architecture for security at the IP networking layer of TCP/IP. IPSec provides the framework to define and implement network security based on policies defined by an organization. IPSec is used to create highly secure connections between two points in an enterprise - this may be server-to-server, or server to network device, as long as they support the IPSec standard. Using IPSec to provide end-to-end encryption helps provide a highly secure exchange of network traffic.
The Authenticated Header (AH) protocol is the IPSec-related protocol that provides authentication. The Encapsulated Security Payload (ESP) protocol provides data encryption, which conceals the content of the payload. ESP also offers authentication. Internet Key Exchange (IKE) protocol exchanges the secret number that is used for encryption or decryption in the encryption protocol.
AH and ESP support two mode types: transport mode and tunnel mode. These modes tell IP how to construct the IPSec packet. Transport mode is used when both endpoints of the tunnel are hosts (data endpoints). Tunnel mode is used whenever either endpoint of the tunnel is a router or firewall.
With transport mode, the IP header of the original transmitted packet remains unchanged.
With tunnel mode, a new IP header is constructed and placed in front of the original packet.
Some of the key IPSec parameters which can be controlled via the Policy file are:
IpDataOffer The IpDataOffer statement defines how to protect data sent through a dynamic VPN.
- HowToEncap
The desired encapsulation mode of the security association.
- Tunnel Specifies that the security association operates in tunnel mode, which protects the entire IP packet. This mode must be used for a secure tunnel between two security gateways or between a security gateway and a remote system. One or both of the communication endpoints can be on different systems than the security endpoints.
- Transport Specifies that the security association operates in transport mode, which protects only the transport-layer headers and data (that is, TCP or UDP packet) inside an IP packet. This mode can be used only when the endpoints of the security association are the two communicating systems (for example, neither system acts as a gateway).
- HowToEncrypt
Encryption is done using the ESP protocol. Specify the encryption
algorithm used to provide data confidentiality. The default is DES.
- DES DES encryption is used with a 56-bit key and a 64-bit initialization vector.
- 3DES
Triple DES executes the DES encryption algorithm three times and
uses 192-bits, including 24 parity bits.
- Rule: If 3DES is specified but is not supported by the system, the Policy Agent fails the policy.
- AES
The Advanced Encryption Standard (AES) algorithm is used with a
128-bit key.
- Rule: If AES is specified but AES encryption is not supported by TCP/IP, Policy Agent fails the policy.
- DoNot No encryption is used. If the HowToEncrypt value DoNot is specified with a HowToAuth ESP value, the ESP header is present, but the payload is not encrypted (ESP_NULL).
- HowToAuth
The desired authentication policy indicating which protocol and which
algorithm to use when authenticating data. The default is ESP Hmac_Md5.
- AH Carry authentication in AH headers.
- ESP Carry authentication in ESP headers.
- Hmac_Md5 Use the Hmac_Md5 algorithm to encode authentication data in either AH or ESP headers.
- Hmac_Sha Use the Hmac_Sha algorithm to encode authentication data in either AH or ESP headers.
KeyExchangeOffer The KeyExchangeOffer statement defines how to change offer for a dynamic VPN. A key exchange offer indicates one acceptable way to protect a key exchange for a dynamic VPN.
- HowToEncrypt
The desired encryption policy for protecting key exchanges.
The default is DES.
- DES Use DES encryption, which utilizes a 56-bit key and a 64-bit initialization vector.
- 3DES
Triple DES executes the DES encryption algorithm three times and
uses 192-bits, including 24 parity bits.
- Rule: If 3DES is specified but is not supported by the system, then the Policy Agent fails the policy.
- AES
The Advanced Encryption Standard (AES) algorithm is used with
128-bit cryptographic key.
- Rule: If AES is specified but AES encryption is not supported by TCP/IP, Policy Agent fails the policy.
- HowToAuthMsgs
The desired hash algorithm for authenticating key exchange messages.
The default is MD5.
- MD5 Use the MD5 algorithm.
- SHA1 Use the SHA1 algorithm.
- HowToAuthPeers
Specifies the method for authenticating peers during phase 1
negotiation.
- PresharedKey Use a pre-shared key to authenticate the peer.
- RsaSignature Use an RSA signature to authenticate the peer.
- DHGroup
Specifies the Diffie-Hellman group used during the phase 1 key
exchange. The default is Group1.
- Group1 Modular exponentiation group with a 768-bit modulus.
- Group2 Modular exponentiation group with a 1024-bit modulus.
- Group5 Modular exponentiation group with a 1536-bit modulus.
- Group14 Modular exponentiation group with a 2048-bit modulus.
- Guideline: If AES encryption is used, use Diffie-Hellman Group 5 or 14.
KeyExchangeRule An IKE SA establishment might be initiated from the local system or from a remote system, and it involves several message exchanges. Depending on the initiator/responder state, and the message sequence, the IKE daemon locates a KeyExchangeRule statement to govern the policy that is used during the negotiation.
- SharedKey
The shared key to use with the LocalSecurityEndpoint statement and
RemoteSecurityEndpoint statement pair when using a pre-shared key for
authentication. The shared key can be specified as an ASCII string,
an EBCDIC string, or a hexadecimal string. The maximum length for an
ASCII or EBCDIC string is 900 characters. The maximum length for a
hexadecimal string is 450 bytes. The hexstring must begin with a 0x.
- Examples:
- SharedKey Ascii SharedKeyValue The value is treated as an ASCII string. This specification is valuable if the sharedkey has been defined to the other endpoint as an ASCII string.
- SharedKey Ebcdic SharedKeyValue The value is treated as an EBCDIC string.
- SharedKey Hex 0xC1C2C3F1F2F3 The value is treated as a hexadecimal string.
Back to Table of Contents.
Virtual Storage Exerciser (VIRSTOEX or VIRSTOCX)
Virtual Storage Exerciser, an IBM internal tool, is used to create workloads with unique and repeatable storage reference patterns.The program will run multiple copies on all virtual CPUs available to it. Each loop consists of advancing through guest real storage, starting at 2 GB, reading 8 bytes of data, and optionally changing the 8 bytes of data and then changing the 8 bytes back to their original contents. The program advances the address pointer by the Increment= value and will continue until the address is >= "End Addr", where the End Addr is defined as "Virtual Storage Size - 8". This "normal" processing will be modified if any of the following parameters are specified: AE, AN, AO, AZ, RDpct=, or Wrpct=. If neither Loops= nor Time= is specified, the program will continue indefinitely until interrupted by an external interrupt.
If Go=nnnn is specified, the program will not begin the thrashing phase until at least the specified number of seconds have elapsed since the program was started. This parameter allows coordinated starting of the thrashing phase when the measurement involves multiple concurrent instances of the program.
If Loops= or Time= is specified, the program will terminate when that limit is reached and report the total number of loops done by all Virtual CPUs, the elapsed time, the total number of pages referenced by all Virtual CPUs, and the rate at which pages were referenced.
If any of the "A contrario" options (AE, AN, AO, or AZ) are specified, then the corresponding loops will decrement through virtual storage, beginning with the highest address that would be used in a normal loop and decrementing the address pointer by the Increment= value until the address is <= 2 GB.
If Burnct= is specified, the program will execute the specified number of BrCT instructions after each page is referenced to "burn" additional cycles for each page read and/or changed. The number of cycles actually "burned" is hardware dependent.
If Fwait= is specified, the program will wait a fixed number of milliseconds between loops.
If RWait= is specified, the program will wait a random number of milliseconds (between 0 and the maximum number specified, inclusive) between loops.
If Xwait= is specified, the program will multiply the Fwait= or RWait= value by the Xwait= value for all Virtual CPUs except Virtual CPU 0. The Fwait= or RWait= parameter must also be specified.
If RDpct= is specified, the program will make an initial priming pass to populate storage and build storage management tables. The Increment= value will be used and each page will be read and changed. All other program parameters will be ignored during the priming pass. The time used and the number of pages referenced will not be included in the statistics produced at the end of the program. The program must run in z/CMS mode if RDpct= is specified. On all regular loops, the program will only reference the specified percentage of the total pages in each loop.
If Wrpct= is specified, the program will only change data on that percentage of the total pages being referenced in each loop.
If Stopchk= is specified, the program will perform interim time limit checks during each loop. The time limit will be checked each time the specified number of pages have been read/modified. This will allow more precise control of the program when a loop takes several minutes (e.g. in a 1 TB user). Note that when the program is stopped in this manner, the loop count will be incorrect but the page count, elapsed time, and page rate will be correct.
If Nwait= is specified, the program will wait the specified number of milliseconds when a Stopchk occurs on all Virtual CPUs except Virtual CPU 0. The Stopchk= parameter must also be specified.
If Zwait= is specified, the program will wait the specified number of milliseconds when a Stopchk occurs on Virtual CPU 0. The Stopchk= parameter must also be specified.
If Pprime is specified, the program will make an initial priming pass to build the Page and Segment tables. An increment of 1MB will be used and each page will be read and changed. All other program parameters will be ignored during the priming pass. The time used and the number of pages referenced will not be included in the statistics produced at the end of the program. The program must run in z/CMS mode if Pprime is specified.
If Uprime is specified, the program will make an initial priming pass to build the Upper DAT tables. An increment of 2 GB will be used and each page will be read and changed. All other program parameters will be ignored during the priming pass. The time used and the number of pages referenced will not be included in the statistics produced at the end of the program. The program must run in z/CMS mode if Uprime is specified.
If Vprime= is specified, the program will make an initial priming pass to populate storage and build storage management tables. The specified increment will be used and each page will be read and changed. All other program parameters will be ignored during the priming pass. The time used and the number of pages referenced will not be included in the statistics produced at the end of the program. The program must run in z/CMS mode if Vprime= is specified.
If Querymsg= is specified, the program will write interim progress messages to the console to report the elapsed time, the number of pages referenced, and the rate at which pages were referenced since the last interim progress message. The messages will be written by each Virtual CPU every nnn seconds, as specified by Querymsg= value. The Stopchk= parameter must also be specified.
The following parameters are used to create specific measurement environments.
- AE - Specifies that all even numbered Virtual CPUs will perform a decrementing (A contrario) address loop, and that all odd numbered Virtual CPUs will perform an incrementing address loop.
- AN - Specifies that all Virtual CPUs, other than Virtual CPU 0, will perform a decrementing (A contrario) address loop, and that Virtual CPU 0 will perform an incrementing address loop.
- AO - Specifies that all odd numbered Virtual CPUs will perform a decrementing (A contrario) address loop, and that all even numbered Virtual CPUs will perform an incrementing address loop.
- AZ - Specifies that Virtual CPU 0 will perform a decrementing (A contrario) address loop, and that all Virtual CPUs, other than Virtual CPU 0, will perform an incrementing address loop.
- Burnct= - Specifies the number of BrCT instructions (0 through 2147483647) to be executed after each page is read and/or changed to "burn" additional cycles. The number of cycles actually "burned" is hardware dependent.
- Cpus= - Specifies the total number of virtual CPUs (1 through 64) to be defined and used.
- Exitcmd= - Specifies CP command(s) to be issued via Diagnose x'08' when the program has ended normally. The default is "MSG * VIRSTOEX Ended, Loading Wait PSW".
- Fwait= - Specifies a fixed number of milliseconds (0 through 999999) to wait between loops.
- Go= - Specifies the number of seconds (0 through 43200) after program start at which the thrashing phase is allowed to begin. If a value of 0 is specified, then the thrashing phase is allowed to begin as soon as possible. This parameter allows coordinated starting of the thrashing phase when the measurement involves multiple concurrent instances of the program. The priming phase, if any, always runs to completion, regardless of the value of Go=.
- Handicap= - Specifies that the CPU utilization (0 through 100) for the specified Virtual CPU (00 through 3F) is to be limited to the specified target utilization.
- Increment= - Specifies the address increment (1 through 1048576) in KB to be used.
- Justvtime - Specifies that the target CPU utilization for each Virtual CPU is to be based on the virtual time used and not the total time used.
- Loops= - Specifies the maximum number of loops (0 through 2147483647) for all Virtual CPUs combined.
- Msgon - Specifies that all program messages, including interim progress progress messages at the end of each loop, are to be generated.
- Nwait= - Specifies a fixed number of milliseconds (0 through 999999) to wait when a Stopchk occurs on a Virtual CPU other than Virtual CPU 0.
- Pprime - Specifies that a priming pass to build Page and Segment Tables, by using an increment of 1MB and changing the data in each page, will be executed before the normal program execution begins. The time used and the number of pages referenced will not be included in the statistics produced at the end of the program and all other program parameters will be ignored during the priming pass.
- Querymsg= - Specifies the number of seconds (0 through 999) between interim progress messages. The program will write interim progress messages to the console to report the elapsed time, the number of pages referenced, and the rate at which pages were referenced since the last interim progress message. The messages will be written by each Virtual CPU.
- RDpct= - Specifies the percentage of pages (1 through 100) which should be referenced in each loop. A priming pass to populate storage and build storage management tables, by using the Increment= value and changing the data in each page, will be executed before the normal program execution begins. The time used and the number of pages referenced will not be included in the statistics produced at the end of the program and all other program parameters will be ignored during the priming pass.
- RWait= - Specifies a maximum number of milliseconds (0 through 999999) to wait between loops. The actual number of milliseconds will be a random number between 0 and nnnnnn, which will be calculated at the end of each loop.
- Stopchk= - Specifies the number of pages (0 through 268435456) to be referenced before performing an interim time limit check. The time limit will be checked each time the specified number of pages have been referenced. This allows more precise control of the program when a loop takes several minutes (e.g. in a 1 TB user). When the program is stopped in this manner, the loop count will be incorrect but the page count, elapsed time, and page rate will be correct.
- Time= - Specifies the maximum number of seconds (0 through 43200) to run the program.
- Uprime - Specifies that a priming pass to build Upper DAT Tables, by using an increment of 2 GB and changing the data in each page, will be executed before the normal program execution begins. The time used and the number of pages referenced will not be included in the statistics produced at the end of the program and all other program parameters will be ignored during the priming pass.
- Vprime - Specifies that a priming pass to populate storage and build storage management tables, by using the specified increment (1 through 1048576), in KB, and changing the data in each page, will be executed before the normal program execution begins. The time used and the number of pages referenced will not be included in the statistics produced at the end of the program and all other program parameters will be ignored during the priming pass.
- Wrpct= - Specifies the percentage of pages (0 through 100) which should be changed in each loop.
- Xwait= - Specifies a multiplier (1 through 999) to be applied to Fwait= or RWait= time for all Virtual CPUs except Virtual CPU 0.
- Yieldpct= - Specifies the maximum CPU utilization target (1 through 100) for each Virtual CPU. If the calculated utilization is higher than the target, the Virtual CPU will yield control and enter a Wait State for a duration calculated to bring its utilization down to the target. The calculated utilization is based on the total time used unless the Justvtime parameter is specified, in which case it will be based on the virtual time used.
- Zwait= - Specifies a fixed number of milliseconds (0 through 999999) to wait when a Stopchk occurs on Virtual CPU 0.
The following default values are used if no parameters are specified.
            AE: Off
            AN: Off
            AO: Off
            AZ: Off
        Burnct: 0
          Cpus: 7
       Exitcmd: MSG * VIRSTOEX Ended, Loading Wait PSW
         Fwait: 0
            Go: 0
      Handicap: 100 (if Yieldpct was not specified)
     Increment: 1024 (1024 KB or 1 MB)
     Justvtime: Off
         Loops: 0
         Msgon: Off
         Nwait: 0
        Pprime: Off
      Querymsg: 0
         RDpct: 100
         RWait: 0
       Stopchk: 0
          Time: 0
        Uprime: Off
        Vprime: 0
         Wrpct: 100
         Xwait: 1
      Yieldpct: 100
         Zwait: 0
Back to Table of Contents.
PING Workload
The PING workload is an internally developed workload used for various performance measurements where network I/O is desired. Typically, PING is set up where one Linux guest virtual machine will PING another Linux guest virtual machine.
For example, to generate network I/O during a live guest relocation in a two-member SSI cluster, two Linux guest virtual machines will be set up such that one guest will PING the other guest while one of the two is being relocated.
The Linux guest issues the PING with a command similar to this:
ping -i 5 10.60.29.149
In this case, the -i 5 indicates that there will be a PING request sent once every 5 seconds. The 10.60.29.149 is the IP address of the Linux guest being PINGed.
Back to Table of Contents.
PFAULT Workload
The PFAULT workload is used with Linux guest virtual machines to randomly reference a specified amount of the guest's storage.
The PFAULT command syntax is:
PFAULT [ megs [ samples [ seconds ] ]
The PFAULT program figures out how many 4096-byte pages there are in the number of megabytes specified (megs) and then calls a function to allocate each page separately. Pointers to the pages are put into an array. It then runs the number of sample repetitions specified (samples) of a page touching experiment. Each repetition of the experiment lasts the number of seconds specified (seconds).
Each experiment consists of over and over randomizing a page number and then touching the page by storing to it. As each repetition ends, the program prints out how many pages it touched along with the square of that touch count in the number of seconds specified. After the number of samples specified has been reached, the program prints out the mean number of touches, the mean of the "touches squared" values, and the standard deviation of the touch count mean. The mean and standard deviation of the touch count are useful in a t-test for comparing two runs of PFAULT.
Back to Table of Contents.
BLAST Workload
BLAST is an IBM internal program that is a disk, tape, and tape library exerciser. It is a multi-threaded program capable of exercising disk, tape, and tape library devices attached locally, or through a network. It uses system calls to test these storage devices in much the same way that a customer would use them. It uses standard system calls similar to what a customer application would use. It checks the return code from every operation, and verifies all data.
A BLAST program based workload has been used to generate disk I/O from a Linux guest virtual machine. This is an example of a command to start a BLAST Write Verify Loop to generate disk I/O:
BLAST WRITE_VERIFY_LOOP MNT_PNT=/mnt FILES=200 IMMED GIANT MAX_DATA=500
WRITE_VERIFY_LOOP - This test writes data to files in a directory. When the appropriate number of files have been written, it reads and verifies the file contents. It then, copies the files to additional directories, and compares them with the files in the source directory. This process repeats until the disk is full. All files and directories are removed, and the cycle repeats until stopped.
MNT_PNT= - The name of the file system to be tested.
FILES= - The number of files per directory.
IMMED - Performs immediate compares on files.
GIANT - Creates Giant files. Giant files are files made up of blocks of 1024 sectors. All read and write operations are for 524288 bytes.
MAX_DATA= - Maximum amount of data to write for an iteration, specified in megabytes.
Back to Table of Contents.
ISFC Workloads
Two different workloads are used to evaluate ISFC. The first evaluates ISFC's ability to carry APPC/VM traffic. The second evaluates ISFC's ability to carry LGR traffic. This appendix describes the general setup used and then describes both workloads.
General Configuration
The configuration generally consists of two z10 EC partitions connected by a number of FICON chpids as illustrated in the figure below. The partitions are dedicated, one 3-way and one 12-way, each with 43 GB central and 2 GB XSTORE. Four FICON chpids connect the two partitions, four CTC devices on each chpid.
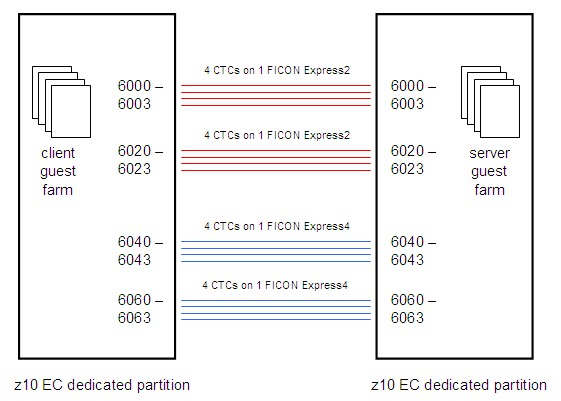
|
The CPU and memory resources configured for these partitions are far larger than are needed for these measurements. We did this on purpose. ISFC contains memory consumption throttles that trigger when storage is constrained on one or both of the two systems. In these measurements we wanted to avoid triggering those throttles, so we could see whether ISFC would fully drive the link devices when no obvious barriers prevented doing so.
The workload grows by adding guests pairwise, client CMS guests on one side and server CMS guests on the other side. Each pair of CMS guests runs one conversation between them. What specific software runs in the guests depends on whether we are exercising APPC/VM data transfers or rather are exercising ISFC Transport data transfers. More information on the software used follows below.
The logical link configuration grows by adding devices upward through the CTC device numbers exactly as illustrated in the figure. For example, for a one-CTC logical link, we would use only device number 6000, for a four-CTC logical link we would use CTCs 6000-6003, and so on.
On the client side a small CMS orchestrator machine steps through the measurements, starting and stopping client machines as needed. The server-side guest software is written so that when one experiment ends, the server guest immediately prepares to accept another experiment; thus no automation is needed to control the servers.
On each side a MONWRITE machine records CP Monitor data.
APPC/VM Workload
An assembler language CMS program called CDU is the client-side program. CDU issues APPCVM CONNECT to connect to an APPC/VM global resource whose name is specified on the CDU command line. Once the connection is complete, CDU begins a tight loop. The tight loop consists of using APPCVM SENDDATA to send a fixed-size instructional message to the server, using APPCVM RECEIVE to receive the server's reply, and then returning to the top of the loop. The fixed-size instructional message tells the server how many bytes to send back in its reply. The CDU program runs for a specified number of seconds, then it severs the conversation and exits.
An assembler language CMS program called CDR is the server-side program. CDR identifies itself as an APPC/VM global resource manager and waits for a connection. When the connection arrives, CDR accepts it and then begins a tight loop. The tight loop consists of using APPCVM RECEIVE to wait for a message from the client, decoding the message to figure out what size of reply to return, issuing APPCVM SENDDATA to send the reply, and then returning to the top of the loop to wait for another message from its client. When it detects a severed conversation, it waits for another experiment to begin.
In its simplest form this experiment consists of one instance of CDU in one CMS guest on system A exchanging data with one instance of CDR in one CMS guest on system B. To ratchet up concurrency, we increase the number of CDU guests on one side and correspondingly increase the number of CDR guests on the other side. In this way we increase the number of concurrent connections.
Other notes:
- Server reply sizes: 1, 1000, 5000, 10000, 50000, 100000, 1000000 bytes.
- Simultaneous client-server pairs: 1, 5, 10, 50, 100.
- To check regression against pre-z/VM-6.2 releases, we run an ISFC logical link consisting of only 1 CTC.
- To check APPC/VM scaling for z/VM 6.2 or later releases, we run ISFC logical links consisting of 1, 4, 8, 12, or 16 CTCs.
ISFC Transport Workload
An assembler language program called LGC is the client. This program is installed into the z/VM Control Program as a CP exit. Installing the exit creates a CP command, LGRSC. This CP command accepts as arguments a description of a data exchange experiment to be run against a partner located on another z/VM system. The experiment is to be run using CP's internal LGR data exchange API, called the ISFC Transport API. The description specifies the identity of the partner, the sizes of the messages to send, how full to keep the internal transmit queue, the size of the reply we should instruct the partner to return, and the number of seconds to run the experiment. The LGC program connects to the partner, sends the messages according to the size and queue-fill arguments specified, runs for the number of seconds specified, and then returns. Each sent message contains a timestamp expressing when it was sent and the size of the reply the partner should return. LGC expects its partner to reply to each message with a reply text of the requested size and containing both the timestamp of the provoking client-message and the timestamp of the moment the server transmitted the reply.
An assembler language program called LGS is the server. This program is installed into the z/VM Control Program as a CP exit. Installing the exit creates a CP command, LGRSS. This CP command accepts as arguments a description of how to listen for a data exchange experiment that a client will attempt to run against this server. The description contains the name of the endpoint on which LGS should listen for a client. LGS waits for its client to connect to its endpoint and then begins receiving client messages and replying to them. Each reply sent is of the size requested by the client and contains the client message's timestamp, the timestamp of when the reply was sent, and padding bytes to fill out the reply to the requested size.
The use of CP exits for this experiment is notable and warrants further explanation. Because the API used for LGR data exchange is not available to guest operating systems, there is no way to write a guest program -- a CMS program, for example -- to exercise the API directly. The only way to exercise the API is to call it from elsewhere inside the z/VM Control Program. This is why the measurement suite was written to run as a pair of CP exits. On the client side, a CMS guest uses Diagnose x'08' to issue the CP LGRSC command, thereby instructing the Control Program to run a data exchange experiment that might last for several minutes. When the experiment is over, the CP LGRSC command ends and the Diagnose x'08' returns to CMS. On the server side, a similar thing happens; a CMS guest uses Diagnose x'08' to issue the CP LGRSS command, thereby informing the Control Program to set up to handle a data exchange experiment that will be initiated by a client partner. The CP LGRSS command never returns to CMS, though; rather, when one conversation completes, the LGS program just begins waiting for another client to arrive.
In its simplest form this experiment consists of one instance of the LGC client exchanging data with one instance of the LGS server. These instances are created by a pair of CMS guests; the client-side guest issues the client-side CP LGRSC command, and the server-side guest issues the server-side CP LGRSS command. To ratchet up concurrency, we increase the number of guest pairs.
We run the LGC-LGS data exchange experiment using a variety of message size distributions:
- HS, small: Client: 20% are 512 bytes, the rest are 8192. Server always 2048.
- HM, medium: Client: 20% are 8192 bytes, the rest are 32768. Server always 4096.
- HL, large: Client: 20% are 98304 bytes, the rest are 122880. Server always 8192.
- HY, symmetric: Client: 100% are 32768. Server always 32768.
The HS, HM, and HL suites are asymmetric on purpose. This asymmetry imitates what happens during a relocation; the LGR memory movement protocol is heavily streamed with few acknowledgements.
Further, the HL workload uses a message size distribution consistent with what tends to to happen during relocations.
The HY workload, completely different from the others, is symmetric. HY is meant only to explore what might happen if we tried to run moderate traffic in both directions simultaneously.
Other notes:
- We run 1, 5, 10, 50, and 100 concurrent client-server pairs.
- We run ISFC logical links consisting of 1, 4, 8, 10, 12, 14, and 16 CTCs.
Back to Table of Contents.
IO3390 Workload
For evaluations of disk I/O performance, we often use a CMS application program called IO3390. This appendix describes the IO3390 application and some of the ways it can be configured.
IO3390 is a CMS application program that repeatedly issues the Start Subchannel (SSCH) instruction so as to run one I/O after another after another, all to the same disk device, with no wait time between the I/Os. By using IO3390 we can generate disk I/O burdens and thereby measure disk I/O performance.
When it begins running, IO3390 reads a small control file that describes the test to be performed. Statements in the control file parameterize the run, that is, the statements specify the run duration, the kind of I/Os to perform, and so on.
In a given run of the IO3390 application, all of the I/Os are:
- Directed at the same virtual device, for example, a given minidisk
- Of the same type, that is, all command-mode (CCWs) or all transport-mode (TCWs)
- Of the same size, expressed as a number of 4 KB records, from 1 to 64 4 KB records per I/O
The control file specifies the fraction of I/Os that are to be reads. The percent of I/Os that should be read I/Os can be specified as an integer in the range [0..100]. IO3390 selects whether the next I/O is a read or a write according to the specified percentage.
The control file further specifies the duration of the run, in seconds.
For each I/O it performs, IO3390 selects a random starting record number on the disk, the random starting record being uniformly distributed over the possible starting records on the disk, so that all possible starting record numbers are equally likely. Records very near to the end of the disk might not be eligible as starting record numbers if the I/Os are sized at greater than one record. For example, if the I/Os are all to be two records long, the very last record of the disk cannot be the starting record number.
IO3390 treats the minidisk as just a sequence of records available for reading or writing. It does not require that the minidisk contain a valid file system of any kind, such as a CMS EDF filesystem. Further, when the test is over, IO3390 will likely have destroyed any file system that might have been on the disk when the run began.
Usually we run IO3390 in a number of CMS virtual machines concurrently. For example, we might decided to drive six real disk volumes concurrently with 48 IO3390 instances, eight instances per real volume. For this kind of arrangement, we would set up eight minidisks on each real volume and point each of the 48 IO3390 instances at its own minidisk.
We collect MONWRITE data during each run and analyze the monitor records with z/VM Performance Toolkit or with a private analysis tool of some kind.
Back to Table of Contents.
z/VM HiperDispatch Workloads
To evaluate z/VM HiperDispatch IBM constructed a tiled workload built upon Virtual Storage Exerciser (VIRSTOEX).
The VIRSTOEX virtual machines vary in:
- Number of virtual CPUs,
- The percent-busy at which they run their virtual CPUs,
- T/V ratio,
- Virtual storage size,
- Number of storage pages they instantiate, and
- Number of storage locations they touch on each instantiated page.
The VIRSTOEX virtual machines are organized into groups called tiles. A tile consists of an assortment of VIRSTOEX virtual machines of specific configuration. To ramp up a workload, the number of tiles is increased.
A LIGHT tile consists of the following assortment of VIRSTOEX virtual machines:
- One virtual 1-way with size 4 GB, trying to run each virtual CPU 15% busy, instantiating 17000 pages (66 MB), touching one doubleword on each page.
- One virtual 2-way with size 16 GB, trying to run each virtual CPU 33% busy, instantiating 33000 pages (132 MB), touching one doubleword on each page.
A HEAVY tile consists of the following assortment of VIRSTOEX virtual machines:
- One virtual 1-way with size 4 GB, trying to run each virtual CPU 15% busy, instantiating 17000 pages (66 MB), touching one doubleword on each page.
- One virtual 4-way with size 16 GB, trying to run each virtual CPU 31% busy, instantiating 33000 pages (132 MB), touching one doubleword on each page.
- One virtual 8-way with size 64 GB, trying to run each virtual CPU 50% busy, instantiating 131000 pages (512 MB), touching one doubleword on each page.
In a given run, all VIRSTOEX machines are set either to run with T/V as low as possible (1.00) or to use frequently issued Diag x'0C' calls so as to elevate its T/V.
A given run consists either of a number of LIGHT tiles or a number of HEAVY tiles, all virtual machines running at either low T/V or high T/V.
A given run is done in a dedicated N-way partition of a given number of logical CPUs, with enough real storage that the workload is guaranteed never to page.
Spectra of workloads are created by varying shape of a tile, number of tiles, machine type, and N-way level of the partition.
Transaction rate for this workload is taken to be the rate at which its virtual servers collectively stride through memory touching pages. Actual stride rates are typically divided by some large denominator to keep ETRs tenable.
This workload does no virtual I/O and does not page. Thus its only constraint is the performance of CPU or memory, and studying ETR is therefore sufficient for studying its performance.
Back to Table of Contents.
Middleware Workload DayTrader (DT)
This workload consists of a Linux client application and a Linux server application that execute on the same z/VM system and are connected by a Virtual Switch (VSwitch). The client application is the Application Workload Modeler client application (AWM), imitating a web browser. The Linux server application is IBM WebSphere Application Server V8.5 (WAS) providing the IBM WebSphere Application Server Samples - DayTrader (DT) that simulates stock trading with dynamic HTML files. The transactions are stored into an IBM DB2 Enterprise Server Edition Version 10.1 (DB2) on the same Linux server. On that server also is running the AWM server application (daemon) to communicate with the AWM client. Each AWM client application can have multiple connections to each server application. Consequently, the total number of connections is the product of these three numbers (servers, clients, client connections per server).
This workload can be used to create a number of unique measurement environments by varying the following items:
- number of server virtual machines
- number of client virtual machines
- number of client connections per server
- size of the server virtual machine
- number of virtual processors for the client
- number of virtual processors for the server
Performance data for DT Middleware Workload measurements are collected once the workload reaches the steady-state period (all clients are active and the connections to the DB2 are established).
Here is a list of unique workload scenarios that have been created and measured:
- A non-constrained workload with enough central storage for all guests.
- A constrained workload where central storage is overcommitted by a factor of about 1.5.
Back to Table of Contents.
Master Processor Exerciser (VIRSTOMP)
Master Processor Exerciser (VIRSTOMP), an IBM internal tool, is used to create workloads with unique and repeatable storage reference patterns and drive work on the z/VM master processor. The program was created from the Virtual Storage Exerciser (VIRSTOEX) tool.
The tools are the same with the exception of how the BURNCT= execution is implemented. In VIRSTOEX, there is simply a BrCT instruction which is executed. In VIRSTOMP, the BrCT instruction is moved to a User Defined Diagnose (x'018C') which is loaded as NONMP to force the instruction to be executed on the z/VM master processor. All the parameters of VIRSTOMP are identical to the VIRSTOEX parameters.
Back to Table of Contents.
Glossary of Performance Terms
Many of the performance terms use postscripts to reflect the sources of the data described in this document. In all cases, the terms presented here are taken directly as written in the text to allow them to be found quickly. Often there will be multiple definitions of the same data field, differing only in the postscript. This allows the precise definition of each data field in terms of its origins. The postscripts are:
<none> | No postscript indicates that the data are obtained from the VM/ESA Realtime Monitor. |
(C) | Denotes data from the VSE console timestamps. |
(H) | Denotes data from the internal processor instrumentation tools. |
(I) | Denotes data from the CP INDICATE USER command. |
(Q) | Denotes data from the SFS QUERY FILEPOOL STATUS command. |
(QT) | Denotes data from the CP QUERY TIME command. |
Server | Indicates that the data are for specific virtual machines, (for example SFS, CRR, or VTAM/VSCS). If there is more than one virtual machine of the same type, these data fields are for all the virtual machines of that type. |
(S) | Identifies OS/2 data from the licensed program, System Performance Monitor 2 (SPM2). |
(T) | Identifies data from the licensed program, Teleprocessing Network Simulator (TPNS). |
(V) | Denotes data from the licensed program VM Performance
Reporting Facility.
|
Absolute Share | An ABSOLUTE share allocates to a virtual machine an absolute percentage of all the available system resources. |
AVG FIRST (T) | The average response time in seconds for the first reply that returns
to the screen.
For non-fullscreen commands
this is the command reflect on the screen.
|
AVG LAST (T) | The average response time in seconds for the last response to the screen. |
AVG THINK (T) | The average think time determined by TPNS for all users. |
Bactrian | A two-humped curve used to represent the think times for both active users and users who are logged on but inactive. The distribution includes those long think times that occur when a user is not actively issuing commands. Actual user data were collected and used as input to the creation of the Bactrian distribution. |
BFS | Byte File System |
CMS BLOCKSIZE | The block size, in bytes, of the users' CMS minidisks. |
Command | In the context of reporting performance results, any user interaction with the system being measured. |
CP | Control Program. The hypervisor component of VM. |
CP/CMD | For the FS7F, FS8F, and VSECICS workloads, this is the average amount of CP processor time used per command in milliseconds. For the PACE workload, this is the average CP processor time per job in seconds. |
CP/CMD (H) | See CP/CMD. This is the hardware based measure. |
CP CPU/CMD (V) Server | CP processor time, in milliseconds, run in the designated server machine per command. |
CPU PCT BUSY (V) | CPU Percent Busy. The percentage of total available processor time used by the designated virtual machine. Total available processor time is the sum of online time for all processors and represents total processor capacity (not processor usage). |
CPU SECONDS (V) | Total CPU time, in seconds, used by a given virtual machine. |
CPU UTIL (V) | The percentage of time a given virtual machine spends using the CPU. |
DASD IO/CMD (V) | The number of real SSCH or RSCH instructions issued to DASD, per job, used by the VSE guest in a PACE measurement. |
DASD IO RATE (V) | The number of real SSCH or RSCH instructions per second that are issued to DASD on behalf of a given virtual machine. For PACE measurements, the number of real SSCH or RSCH instructions per second issued to DASD on behalf of the VSE guest. |
DASD IO TOTAL (V) | The number of real SSCH or RSCH instructions issued to DASD used by the VSE guest in a PACE measurement. |
DASD PAGE RATE (V) | The number of DASD page reads per second plus DASD page writes per second that occur in a given virtual machine. |
DASD RESP TIME (V) | Average DASD response time in milliseconds. This includes DASD service time plus (except for page and spool volumes) any time the I/O request is queued in the host until the requested device becomes available. |
DIAGNOSE | An instruction that is used to request CP services by a virtual machine. This instruction causes a SIE interception and returns control to CP. |
DIAG/CMD | The total number of DIAGNOSE instructions used per command or job. |
DISPATCH LIST | The average over time of the number of virtual machines (including loading virtual machines) in any of the dispatch list queues (Q0, Q1, Q2 and Q3). |
DPA | Dynamic Paging Area. The area of real storage used by CP to hold virtual machine pages, pageable CP modules and control blocks. |
EDF | Enhanced Disk Format. This refers to the CMS minidisk file system. |
Elapsed Time (C) | The total time, in seconds, required to execute the PACE batch
workload.
|
ELIGIBLE LIST | The average over time of the number of virtual machines (including loading virtual machines) in any of the eligible list queues (E0, E1, E2 and E3). |
EMUL ITR | Emulation Internal Throughput Rate. The average number of transactions completed per second of emulation time. This is from the EM_ITR field under TOTALITR of the RTM TRANSACT screen. |
EMUL/CMD | For the FS7F, FS8F, and VSECICS workloads, this is the amount of processor time spent in emulation mode per command in milliseconds. For the PACE workload, this is the emulation processor time per job in seconds. |
EMUL/CMD (H) | See EMUL/CMD. This is the hardware based measurement. |
ETR | External Throughput Rate. |
ETR (C) | See ETR. The external throughput rate for the VSE guest measurements. |
ETR (T) | See ETR. TPNS-based calculation of ETR. |
ETR RATIO | This is the ratio of the RTM-based ETR calculation and the TPNS-based ETR calculation. |
External TPNS | The TPNS workload driver is run on a different system that is connected to the measured system with a communications link. See Internal TPNS. |
FAST CLR/CMD | The number of fast path clears of real storage per command or job. This includes V=R and regular guests. |
FCON/ESA | FCON/ESA is a program that is available from IBM that provides performance monitoring capabilities with system console operation in full screen mode. FCON/ESA can provide an immediate view of system performance or post process its own history files or VM/ESA monitor data for selected data. Threshold monitoring and user loop detection is provided. FCON/ESA also has the ability to monitor remote systems. |
FREE TOTL/CMD | The number of requests for free storage per command or job. This includes V=R and regular guests. |
FREE UTIL | The proportion of the amount of available free storage actually used. |
FREEPGS | The total number of pages used for FREE storage (CP control blocks). |
FST | File Status Table. The CMS control block that contains information about a file belonging to a minidisk or SFS directory. |
GB | Gigabytes. 1024 megabytes. |
GUEST SETTING | This field represents the type of VSE guest virtual machine in a PACE measurement. This fields possible values are V=V, V=F or V=R. |
GUESTWT/CMD | The number of entries into guest enabled wait state per job. |
GUESTWT/SEC | The number of entries into guest enabled wait state per second.
|
Hardware Instrumentation | See Processor Instrumentation |
IML MODE | This is the hardware IML mode used in VSE guest measurements. The possible values for this field are 370, ESA, or LPAR. |
Instruction Path Length | The number of machine instructions used to run a given command, function or piece of code. |
Internal Response Time | The response time as seen by CP. This does not include line or terminal delays. |
Internal TPNS | The TPNS workload driver is run as one or more virtual machines in the system being measured. When used with TCP/IP, the loopback IP address is used to direct communications between the TPNS and TCP/IP stack virtual machine(s), thus eliminating the need for physical communications hardware. See External TPNS. |
ISFC | Inter-System Facility for Communications |
ITR | Internal Throughput Rate. This is the number of units of work accomplished per unit of processor busy time in an nonconstrained environment. For the FS7F, FS8F, and VSECICS workloads this is represented as commands per processor second. For the PACE workload, this is represented as jobs per processor minute. |
ITR (H) | See ITR. This is the hardware based measure. In this case, ITR is measured in external commands per unit of processor busy time. For the FS7F, FS8F, and VSECICS workloads this is represented as commands per processor second, while for the PACE workload this is represented in jobs per processor minute. |
ITR (V) | See ITR. This is the VMPRF-based measure. ITR is measured in external commands per unit of processor busy time. |
ITRR | Internal Throughput Rate Ratio. This is the RTM based ITR normalized to a specific run. |
ITRR (H) | See ITRR. This is the ITR (H) normalized to a specific run. |
ITRR (V) | See ITRR. This is the ITR (V) normalized to a specific run. |
IUCV | Inter-User Communication Vehicle. A VM generalized CP interface that helps the transfer of messages either among virtual machines or between CP and a virtual machine. |
k | Multiple of 1000. |
Kb | Kilobits. One kilobit is 1024 bits. |
KB | Kilobytes. One kilobyte is 1024 bytes. |
MASTER CP (H) | Total host (CP) state utilization for the master processor. This is calculated as MASTER TOTAL (H) - MASTER EMUL (H). |
MASTER CP | Total CP processor utilization for the master processor. This is calculated as MASTER TOTAL - MASTER EMUL. |
MASTER EMUL | Total emulation state utilization for the master processor. For uniprocessors this is the same as 'TOTAL EMUL' and is generally not shown. |
MASTER EMUL (H) | Total emulation state utilization for the master processor. For uniprocessors this is the same as 'TOTAL EMUL' and is generally not shown. This is the hardware based calculation. |
MASTER TOTAL | Total utilization of the master processor. For uniprocessor this is the same as 'TOTAL' and is generally not shown. |
MASTER TOTAL (H) | Total utilization of the master processor. For uniprocessor this is the same as 'TOTAL (H)' and is generally not shown. This is the hardware based calculation. |
MB | Megabytes. One megabyte is 1,048,576 bytes. |
MDC AVOID | The number of DASD read I/Os per second that were avoided through the use of minidisk caching. |
MDC HIT RATIO | Minidisk Cache Hit Ratio. |
MDC MODS | Minidisk Cache Modifications.
The number of times per second
blocks were written in the cache, excluding
the writes that occurred as a result of minidisk cache misses.
This measure only applies to VM releases prior to VM/ESA 1.2.2.
|
MDC READS (blks) | Minidisk Cache Reads.
The number of times per second
blocks were found in the cache as the result of
a read operation.
This measure only applies to VM releases prior to VM/ESA 1.2.2.
|
MDC READS (I/Os) | Minidisk Cache Reads.
The total number of virtual read I/Os per second that read data from
the minidisk cache. This measure does not apply to VM releases
prior to VM/ESA 1.2.2.
|
MDC REAL SIZE (MB) | The size, in megabytes, of the minidisk cache in real storage.
This measure does not apply to VM releases
prior to VM/ESA 1.2.2.
|
MDC WRITES (blks) | Minidisk Cache Writes.
The number of CMS Blocks moved per second
from main storage to expanded storage.
This measure only applies to VM releases prior to VM/ESA 1.2.2.
|
MDC WRITES (I/Os) | Minidisk Cache Writes. The total number of virtual write I/Os per second that write data into the minidisk cache. This measure does not apply to VM releases prior to VM/ESA 1.2.2. |
MDC XSTOR SIZE (MB) | The size, in megabytes, of the minidisk cache in expanded storage. |
Millisecond | One one-thousandth of a second. |
Minidisk Caching | Refers to a CP facility that uses a portion of storage as a read cache of DASD blocks. It is used to help eliminate I/O bottlenecks and improve system response time by reducing the number of DASD read I/Os. Prior to VM/ESA 1.2.2, the minidisk cache could only reside in expanded storage and only applied to 4KB-formatted CMS minidisks accessed via diagnose or *BLOCKIO interfaces. Minidisk caching was redesigned in VM/ESA 1.2.2 to remove these restrictions. With VM/ESA 1.2.2, the minidisk cache can reside in real and/or expanded storage and the minidisk can be in any format. In addition to the diagnose and *BLOCKIO interfaces, minidisk caching now also applies to DASD accesses that are done using SSCH, SIO, or SIOF. |
Minidisk File Cache | A buffer used by CMS when a file is read or written to sequentially. When a file is read sequentially, CMS reads ahead as many blocks as will fit into the cache. When a file is written sequentially, completed blocks are accumulated until the cache is filled and then are written out together. |
ms | Millisecond. |
Native | Refers to the case where an operating system is run directly on the hardware as opposed to being run as a guest on VM. |
Non-shared Storage | The portion of a virtual machine's storage that is unique to that virtual machine, (as opposed to shared storage such as a saved segment that is shared among virtual machines). This is usually represented in pages. |
NONPAGE RIO/CMD (V) | The number of real SSCH and RSCH instructions issued per command for purposes other than paging. |
NONTRIV INT | Non-trivial Internal response time in seconds. The average response time for transactions that completed with more than one drop from Q1 or one or more drops from Q0, Q2, or Q3 per second. |
Non-Spool I/Os (I) | Non-spool I/Os done by a given virtual machine. This is calculated from INDICATE USER data obtained before and after the activity being measured. The value shown is final IO - initial IO. |
NPDS | No Page Data-Set. A VSE/ESA option, when running on VM/ESA as a V=V guest, that eliminates paging by VSE/ESA for improved efficiency. All paging is done by VM/ESA. |
NUCLEUS SIZE (V) | The resident CP nucleus size in kilobytes.
|
OSA | IBM S/390 Open Systems Adapter. An integrated S/390 hardware feature that provides an S/390 system with direct access to Token Ring, Ethernet, and FDDI local area networks. |
PAGE/CMD | The number of pages moved between real storage and DASD per command or job. |
PAGE IO RATE (V) | The number of real SSCH or RSCH instructions issued on behalf of system paging. |
PAGE IO/CMD (V) | The number of real SSCH and RSCH instructions issued per command on behalf of system paging. |
Path length | See Instruction Path Length |
PBT/CMD | For the FS7F, FS8F, and VSECICS workloads, this is the number of milliseconds of processor activity per command. For the PACE workload, this is the number of seconds of processor activity per job. |
PBT/CMD (H) | See PBT/CMD. This is the hardware based measure.
|
PCI | Program controlled interrupt. |
PERCENT CP (H) | The percentage of all CPU time that is used by CP. This is calculated as CP/CMD (H) / PBT/CMD (H). |
PGBLPGS | The number of system pageable pages available. |
PGBLPGS/USER | The number of system pageable pages available per user. |
Privileged Operation | Any instruction that must be run in supervisor state. |
PRIVOP/CMD | The number of virtual machine privileged instructions simulated per command or job. This does not include DIAGNOSE instructions. |
PRIVOPS (Privileged Operations) | See Privileged Operation. |
Processor Instrumentation | An IBM internal tool used to obtain hardware-related data such as processor utilizations. |
Processor Utilization | The percent of time that a processor is not idle. |
Processors | The data field denoting the number of processors that were active during a measurement. |
QUICKDSP ON | When a virtual machine is assigned this option, it bypasses the normal scheduler algorithm and is placed on the dispatch list immediately when it has work to do. It does not spend time in the eligible lists. QUICKDSP can be specified either via a CP command or in the CP directory entry. |
RAID | Redundant array of independent DASD. |
RAMAC | A family of IBM storage products based on RAID technology. These include the RAMAC Array Subsystem and the RAMAC Array DASD. |
READS/SEC | The number of pages read per second done for system paging. |
Real Storage | The amount of real storage (central storage) used for a particular measurement. |
Relative Share | A relative share allocates to a virtual machine a portion of the total system resources minus those resources allocated to virtual machines with an ABSOLUTE share. A virtual machine with a RELATIVE share receives access to system resources that is proportional with respect to other virtual machines with RELATIVE shares. |
RESERVE | See SET RESERVED |
RESIDENT PAGES (V) | The average number of nonshared pages of central storage that are held by a given virtual machine. This is the Resid Storage Pages column in VMPRF's USER_RESOURCE_UTIL report. |
RFC | Request for comments. In the context of this report, an RFC is an online document that describes a TCP/IP standard (proposed or adopted). |
RIO/CMD (V) | The number of real SSCH and RSCH instructions issued per command. |
RIO RATE (V) | The number of real SSCH and RSCH instructions issued per second. |
RSU | Recommend Service Upgrade |
RTM | Real Time Monitor A licensed program realtime monitor and diagnostic tool for performance monitoring, analysis, and problem solving. |
Run ID | An internal use only name used to identify a performance measurement. |
SET RESERVED (Option) | This is a CP command that can be used to allow a V=V virtual machine to have a specified minimum number of pages resident in real storage. It is used to reduce paging and improve performance for a given virtual machine. |
SHARE | The virtual machine's SHARE setting. The SET SHARE command and the SHARE directory statement allow control of the percentage of system resources a virtual machine receives. These resources include processors, real storage and paging I/O capability. A virtual machine receives its proportion of these resources according to its SHARE setting. See Relative and Absolute Share. |
Shared Storage | The portion of a virtual machines storage that is shared among other virtual machines (such as saved segments). This is usually represented in pages. |
SHRPGS | The number of shared frames currently resident. |
SIE | ESA Architecture instruction to Start Interpretive Execution. This instruction is used to run a virtual machine in emulation mode. |
SIE INTCPT/CMD | The number of exits from SIE which are SIE interceptions per command or job. SIE is exited either by interception or interruption. An intercept is caused by any condition that requires CP interaction such as I/O or an instruction that has to be simulated by CP. |
SIE/CMD | SIE instructions used per command or job. |
S/390 Real Storage | On an IBM PC Server 500 system, the amount of real storage that is available to the System/390 processor. |
TOT CPU/CMD (V) Server | The total amount of processor time, in milliseconds, for the server virtual machine(s). |
TOT INT | Total Internal Response Time in seconds. Internal response time
averaged over all
trivial and non-trivial transactions.
|
TOT INT ADJ | Total internal response time (TOT INT) reported by RTM, adjusted to reflect what the response time would have been had CP seen the actual command rate (as recorded by TPNS). This is a more accurate measure of internal response time than TOT INT. In addition, TOT INT ADJ can be directly compared to external response time (AVG LAST (T)) as they are both based on the same, TPNS-based measure of command rate. |
TOT PAGES/USER | The total number of pages that are associated, on average, with each end user virtual machine. This is taken from VMPRF report UCLASS_RESOURCE UTIL and is the sum of resident storage pages, expanded storage pages, and DASD page slots for the "Users" class. This is a measure of how many unique pages are touched during execution of the workload by the average end user. |
TOTAL | The total processor utilization for a given measurement summed over
all processors.
|
TOTAL (H) | See TOTAL. This is the hardware based measurement. |
Total CPU (I) | Total CPU time, in seconds, used by a given virtual machine. This is calculated from INDICATE USER data obtained before and after the activity being measured. The value shown is final TTIME - initial TTIME. |
TOTAL EMUL | The total emulation state time for all users across all online processors. This indicates the percentage of time the processors are in emulation state. |
TOTAL EMUL (H) | The total emulation state time for all users across all online processors. This indicates the percentage of time the processors are in emulation state. |
TPNS | Teleprocessing Network Simulator. A licensed program terminal and network simulation tool that provides system performance and response time information. |
Transaction | A user/system interaction as counted by CP. For a single-user virtual machine a transaction should roughly correspond to a command. It does not include network or transmission delays and may include false transactions. False transactions can be those that wait for an external event, causing them to be counted as multiple transactions, or those that process more than one command without dropping from queue, causing multiple transactions to be counted as one. |
TRACE TABLE (V) | The size in kilobytes of the CP trace table.
|
Transaction (T) | This is the interval from the time the command is issued until the last receive prior to the next send. This includes clear screens as a result of an intervening MORE... or HOLDING condition. |
TRIV INT | Trivial Internal Response Time in seconds. The average response time for transactions that complete with one and only one drop from Q1 and no drops from Q0, Q2, and Q3. |
TVR | Total to Virtual Ratio. This is the ratio of total processor utilization to virtual processor utilization. |
TVR (H) | See TVR. Total to Virtual Ratio measured by the hardware monitor. |
T/V Ratio | See TVR |
Users | The number of virtual machines logged on to the system during a measurement interval that are associated with simulated end users. This includes active and inactive virtual machines but does not include service machines. |
UTIL/PROC (H) | Per processor utilization reported by the hardware. |
UTIL/PROC (V) | Average utilization per processor reported VMPRF. |
VIO RATE | The total number of all virtual I/O requests per second for all users in the system. |
VIO/CMD | The average number of virtual I/O requests per command or job for all users in the system. |
VIRT CPU/CMD (V) Server | Virtual processor time, in milliseconds, run in the designated server(s) machine per command. |
VM Mode | This field is the virtual machine setting (370, XA or ESA) of the VSE guest virtual machine in PACE measurements. |
VM Size | This field is the virtual machine storage size of the VSE guest virtual machine in PACE measurements. |
VMPAF | Virtual Machine Performance Analysis Facility. A tool used for performance analysis of VM systems. |
VMPRF | VM Performance Reporting Facility. A licensed program that produces performance reports and history files from VM/ESA or z/VM monitor data. |
VSCSs | The number of virtual machines running VSCS external to VTAM during a measurement interval. |
VSE Supervisor | This field is the VSE supervisor mode used in a PACE measurement. |
VTAMs | The number of virtual machines running VTAM during a measurement interval. |
V=F | Virtual equals fixed machine. A virtual machine that has a fixed, contiguous area of real storage. Unlike V=R, storage does not begin at page 0. For guests running V=F, CP does not page this area. Requires the PR/SM hardware feature to be installed. |
V=R | Virtual equals real machine. Virtual machine that has fixed, contiguous area of real storage starting at page 0. CP does not page this area. |
V=V | Virtual equals virtual machine. Default storage processing. CP pages the storage of a V=V machine in and out of real storage. |
WKSET (V) | The average working set size. This is the scheduler's estimate of the amount of storage the average user will require, in pages. |
WKSET (V) Server | Total working set of a related group of server virtual machine(s). |
WRITES/SEC | The number of page writes per second done for system paging. |
XSTOR IN/SEC | The number of pages per second read into main storage from expanded storage. This includes fastpath and non-fastpath pages. |
XSTOR OUT/SEC | The number of pages per second written from main storage into expanded storage. |
XSTOR/CMD | The number of pages read into main storage from expanded storage and written to expanded storage from main storage per command or job. |
Back to Table of Contents.
Footnotes
Guest pages that must still be below 2G with z/VM 5.2
With z/VM 5.2, guest pages can remain in place in nearly all cases. There are some exceptions, which include:
- Pages locked by the old 31-bit Diagnose x'98' interface
- Certain vSIE cases involving virtual guest MP and the Systems Communication Area used by the real guest to manage communication between virtual guest CPUs
- The communications area used by the Diagnose x'70' Time-of-Day Clock Accounting Interface
The OSA-Express features and virtual switch can support two transport modes -- Layer 2 (Link Layer or MAC Layer) and Layer 3 (Network Layer). In Layer 2 mode, each port is referenced by its Media Access Control (MAC) address instead of by Internet Protocol (IP) address. Data is transported and delivered in Ethernet frames, providing the ability to handle protocol-independent traffic for both IP and non-IP, such as IPX, NetBIOS, or SNA.
QEBSM is active by default if the following conditions are true:
- z/VM 5.2 is running
- QEBSM is enabled on the hardware
- the Linux guest supports QEBSM
If, for some reason, QEBSM needs to be deactivated, this can be accomplished by issuing the SET QIOAssist OFF command before Linux is started.
Absolute Maximum In-Use Virtual Storage for z/VM 5.2
This is the calculation of how much in-use virtual storage can be supported by a z/VM system if all real storage below 2 GB could be used for PGMBKs:
Total frames in 2G real storage: 2048*256 = 524288
Number of PGMBKs that fit into 2G real storage: 524288/2 = 262144
Equivalent in-use virtual storage: 262144 MB = 256 GB
In-use Virtual Storage Example for z/VM 5.3
This is an example calculation for the amount of in-use virtual storage that can be supported by a 256 GB z/VM 5.3 system when the average number of resident virtual pages in each in-use 1 MB virtual storage segment is 50:
Total frames in a 256G system: 256*1024*256 = 67108864
Frames required per in-use segment: 50 + 2 for the PGMBK = 52
Total in-use segments:  67108864/52 = 1290555
Total in-use virtual storage: 1290555 MB = 1260.3 GB = 1.23 TB
With z/VM 5.2 a maximum of 24 CPUs was supported for a single VM image. The 30-way measurement was conducted for comparison purposes, but is not a supported configuration.
placing the DEFINE CPU command in the directory
This makes use of the new user directory COMMAND statement that was added in z/VM 5.3. It can be used to specify CP commands that are to be executed after a virtual machine is logged on.
Back to Table of Contents.