Understanding z/VM HiperDispatch
In z/VM 6.3 IBM introduced new virtual server dispatching technology, called HiperDispatch, into z/VM. The prime objective of z/VM HiperDispatch is to help virtual servers to get good performance from the System z's memory subsystem. z/VM HiperDispatch works toward this objective by managing the partition and dispatching virtual CPUs in a manner that is cognizant of the physical machine's organization and especially of its memory caches. z/VM's behaving in this way can help an amenable workload to achieve good performance on the System z hardware.
In this article we first explain important attributes of System z computing hardware and firmware as they relate to the notion of virtual server dispatch. Understanding machine organization is crucial because it sets the stage for understanding why dispatch heuristics can have such a large effect on workload performance.
In this article we also explain the z/VM Control Program changes that help it to run virtual servers in a manner that exploits machine organization. We will see that compared to previous releases, z/VM 6.3 has the potential to improve workload performance because these changes can help the system to run more efficiently.
The performance improvement z/VM HiperDispatch can bring to a workload is very much a property of the innate characteristics of the workload itself. In a later section of this article we discuss workload characterization and in particular how to identify workloads that might be particularly amenable to being improved by z/VM HiperDispatch.
Because reliable measurement is paramount in the context of assessing performance improvement, the article continues by discussing how to measure a workload to determine the effect of having implemented z/VM HiperDispatch on a given system.
Finally, the article closes with a highlights-level discussion of the z/VM Performance Toolkit changes important to understanding the behavior of z/VM HiperDispatch.
System z Machine Factors
One way z/VM HiperDispatch tries to achieve its objective of improving workload performance is by dispatching virtual servers in a fashion that is aware of the physical construction characteristics and properties of the System z CEC. This awareness especially applies to how CPUs are manufactured and how the interface between CPUs and memory is physically organized. In the following sections we explore these attributes of System z hardware.
CPUs, Chips, and Books
The processors of a System z are physically placed in hardware in a hierarchical, layered fashion.
- Individual CPUs, sometimes called cores, are the execution units for instructions as perceived by software. CPUs do adds, loads, stores, compares, and the like.
- CPUs are manufactured in such a way that several CPUs appear on a single semiconductor wafer or chip. The number of CPUs on a chip varies by model.
- Chips are in turn mounted in groups onto carrier structures called multi-chip modules (MCMs). The number of chips on an MCM varies by model.
- A processor book carries exactly one MCM along with some memory and other components.
- Installed into the computing machine -- typically called the Central Electronics Complex, or CEC -- are one or more books; a maximum of four books is typical.
The CEC's physical memory resides on the installed books themselves but appears logically as one contiguous physical memory accessible by all CPUs on all books.
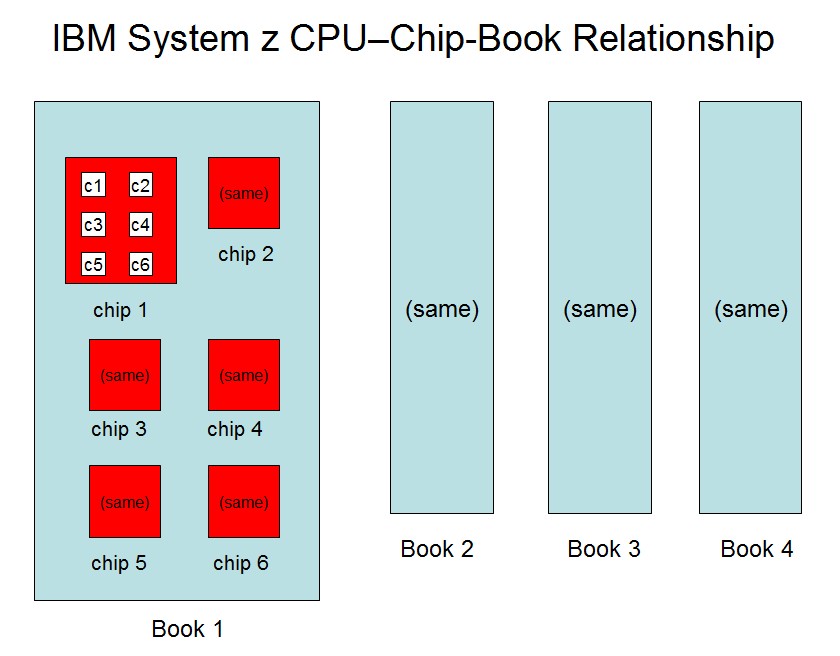
The block diagram below illustrates the nested, layered organization of System z CPUs into chips and books. The diagram shows a four-book system. In this diagram, each of the four books contains six chips. On each chip are six CPUs. This hypothetical system has [ (4 books) x (6 chips/book) x (6 CPUs/chip) ] = 144 CPUs altogether.
|
Those familiar with System z know that the CPUs of a System z are available in a variety of types: CPs, IFLs, zAAPs, and the like. A chip can contain more than one type of CPU. So, for example, a chip containing six CPUs might contain three IFLs and three CPs.
Memory Cache
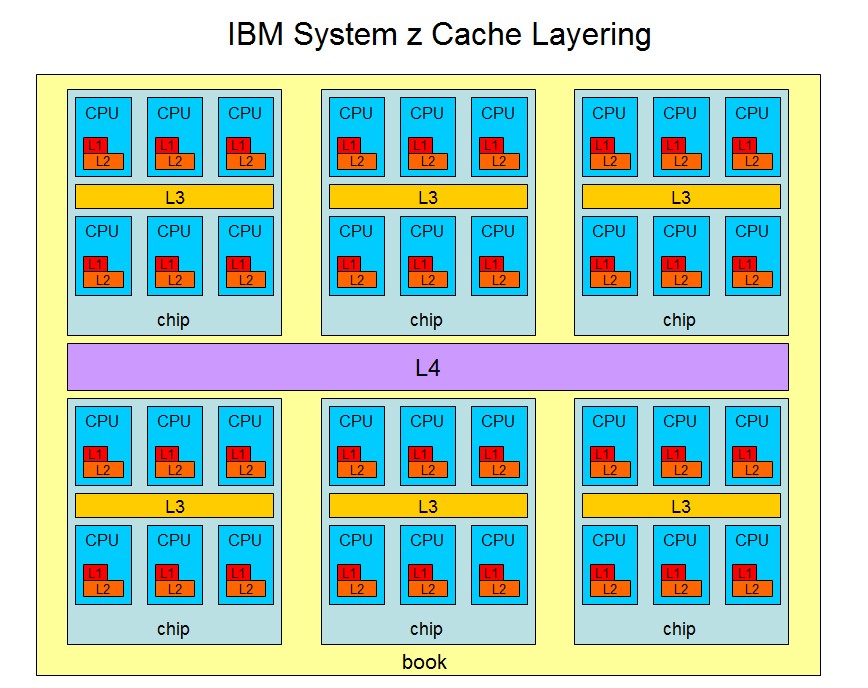
To help improve data access times, System z uses high-speed memory caches at important points in the CPU placement hierarchy. For example, on the zEC12, cache is present at three vital locations.
- Each CPU has L1 and L2 cache, private to the CPU.
- Each chip has L3 cache, private to the chip but shared by the CPUs on the chip.
- Each book has L4 cache, private to the book but shared by the chips on the book.
The block diagram below illustrates this layered cache arrangement.
|
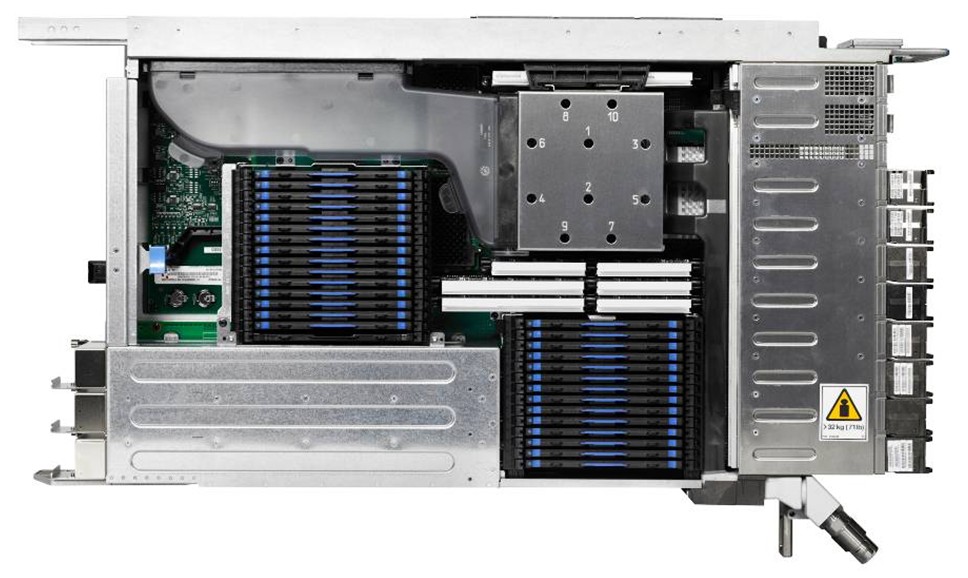
In case you are interested, here's a photo of a zEC12 book. You can't see the MCM, the CPU chips, or the cache chips, but they're definitely in there. In fact, the MCM is right under that metal shroud that's above and to the right of the photo's center.
|
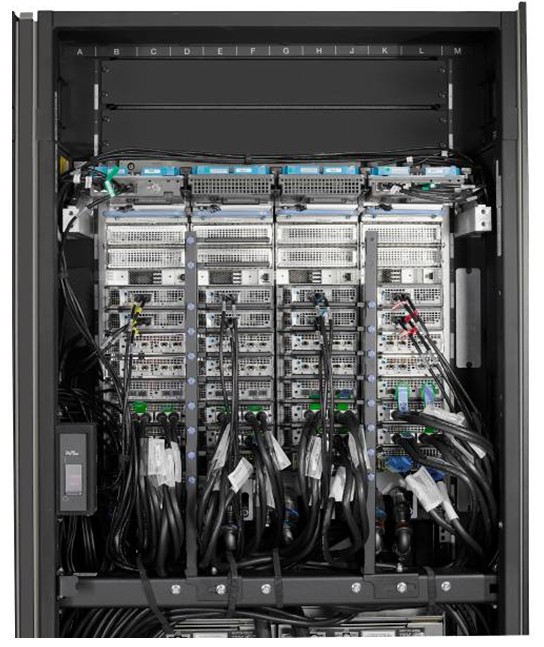
A zEC12 CEC can contain up to four books. In this photo one can see the four books installed into the CEC.
|
As we move outward from the CPU, the caches get larger, but they also get slower. Consequently, data access time is directly related to the number of cache levels that have to be traversed to satisfy the memory reference. For example, a reference satisfied by chip cache takes less time -- that is, fewer clock cycles -- than a reference satisfied by book cache. These time differences can be quite significant.
Memory caches provide the best benefit when a given CPU or small set of physically adjacent CPUs accesses the same memory over and over again while other CPUs leave those memory areas alone. Locality of access lets the fast, near-in caches build up local copies of frequently needed data. Other CPUs ignoring those same memory areas prevents those cached copies from becoming invalid. All of this causes data to be accessed with fewer clock cycles. This decreases cycles per instruction (CPI), which is a key measure of system performance.
An objective of the z/VM HiperDispatch function is to run virtual servers in a manner that lets the System z memory caches operate effectively. In later sections of this article we will see how z/VM accomplishes this.
System z Hypervisor Factors
Another way that z/VM HiperDispatch tries to achieve its objective of improving workload performance is by exploiting System z partition hypervisor features intended to improve memory performance for partitions' logical CPUs. Below find descriptions of the hypervisor features z/VM HiperDispatch either takes into account or exploits so as to achieve its objective.
Partition Weight and Entitlement
In a System z machine, the partitioning hypervisor, Processor Resource/System Manager or PR/SM, divides the machine into disjoint computing regions called partitions. Each partition is provided some memory and some CPU power for its use. A partition is labelled dedicated or shared according to how CPU power is delivered to the partition. A dedicated partition has specific physical CPUs assigned to it for its exclusive use. The shared partitions timeslice on the remaining physical CPUs, called collectively the shared physical CPU pool.
PR/SM apportions CPU power to the shared partitions in proportion to the partitions' customer-selected weights. A partition's weight expresses the fraction of the shared physical CPU pool PR/SM should let said partition consume when all partitions are infinitely hungry for CPU power. In other words, a partition's weight expresses its entitlement for using power from the shared physical CPU pool when all shared partitions are trying infinitely hard to consume CPU.
An example will help to illustrate how weight determines entitlement. Suppose a physical System z contains 12 shared physical IFLs, giving it a physical IFL CPU utilization capacity of 1200%. Suppose further PR/SM is hosting two IFL shared partitions P1 and P2, the former with weight 200 and the latter with weight 400. For each partition we calculate entitlement by forming the partition's weight-fraction and then multiplying by the physical capacity of the shared pool. In this example, the entitlement for partition P1 would be (1200 * (200 / (200+400)) or 400%. Similarly, P2's entitlement would be 800%. The table below illustrates the calculation.
| Partition | Weight | Weight-sum | Weight-fraction | Physical Capacity | Entitlement Formula | Entitlement |
|---|---|---|---|---|---|---|
| P1 | 200 | 600 | 200/600 | 1200% | 1200% x (200/600) | 400% |
| P2 | 400 | 600 | 400/600 | 1200% | 1200% x (400/600) | 800% |
Entitlement is important because it generally expresses an allotment on CPU utilization. PR/SM generally lets a partition consume at least its entitlement, no matter what the other partitions are attempting to consume. In extremely high CPU utilization scenarios, delivering at least entitlement to a partition might not be possible.
A System z CEC is often equipped with physical processors of a variety of types: IFLs, CPs, zAAPs, and the like. Concepts such as weight, entitlement, and size of the shared physical CPU pool are all per-type concepts. For example, a CEC could have 15 shared physical IFLs but only 3 shared physical zAAPs. Further, a heterogeneous partition could have a weight of 200 for its IFLs but a weight of 1000 for its CPs. We remind the reader here that all discussions of topics such as weight, entitlement, CPU-busy, and size of the shared physical CPU pool are always carried out by CPU type.
A dedicated partition's entitlement for CPU power is simply the number of physical CPUs dedicated multiplied by 100%. For example, an 8-way dedicated IFL partition is entitled to 800% power. Dedicated partitions are generally not relevant to the rest of this article. From this point on, when we use the word partition, the reader can assume we are talking about a shared partition unless we say otherwise.
Unentitled CPU Power
As long as there is enough physical CPU capacity to satisfy all partitions, PR/SM does not usually throttle partitions' consumption. Capped partitions are the exception to this general rule, but capped partitions aren't particularly relevant to this article, so we don't mention them further herein.
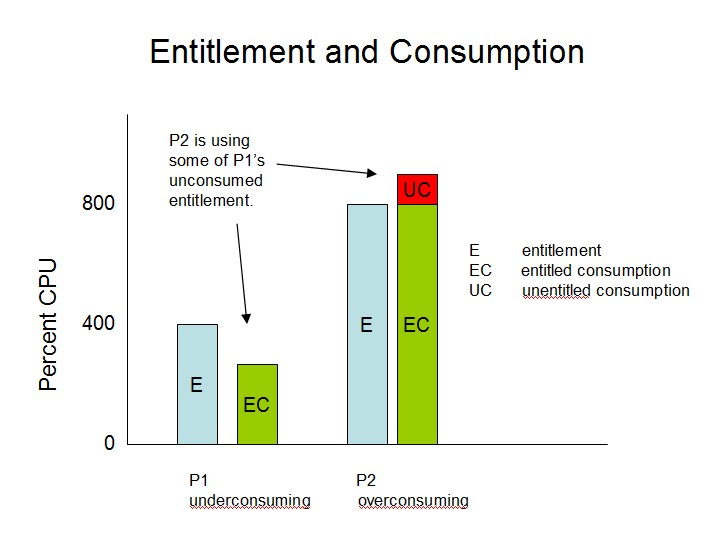
It follows that depending on the CPU consumption habits of the individual partitions, PR/SM will sometimes let a partition consume CPU power beyond its entitlement. Returning to the previous example, if P1 is entitled to 400% but is only 225% busy at the moment, the remaining 175% of P1's entitlement constitutes unused entitled CPU power, sometimes also called unconsumed entitlement or CPU slack or CPU white space, that is available to partitions wanting to consume beyond their entitlements.
Continuing the example, if when P1 were consuming only 225% P2 wanted to run 900% busy, PR/SM would allow it by letting P2 consume all of its entitled 800% plus letting it consume 100% of the 175% unused entitled power. In this situation we say that P2 is overconsuming and that its consumption of 900% is composed of entitled consumption of 800% plus unentitled consumption of 100%. See the figure below.
|
When P1's activity level increases, PR/SM compensates first by letting P1 use CPU power that no partition is using and second by appropriately throttling the overconsuming partition P2. PR/SM does this because of the basic rule about entitlement, namely, that every partition is allowed to consume its entitlement whenever it likes.
The unused entitled power available to partitions wishing to overconsume is simply the total CPU power available minus the entitled power being consumed. As long as there is enough unused entitled power available to satisfy all overconsuming partitions, the overconsumers can consume as much power as they want. When unused entitled power becomes constrained -- that is, when there is more desire to overconsume than there is unused entitled power to dispense -- overconsumers compete for the unused entitled power according to their weights.
For simplicity of phrasing, we usually call unused entitled power unentitled power, though strictly speaking the English meaning of these two phrases is slightly different.
Logical CPUs as Consumers of CPU Power
A partition's ability to consume CPU power is related to more than just the partition's entitlement. Because CPU power is actually consumed by logical CPUs, the number of logical CPUs provided for a partition also helps determine how much CPU power a partition can consume.
The number of logical CPUs provided for a partition is an absolute upper bound on the amount of CPU power a partition can consume. For example, a 7-way partition can never run more than 700% busy, period. When all seven logical engines are each 100% busy, the partition's consumption simply cannot go any higher. Each logical CPU in the partition is maximally busy.
When a logical partition is configured with more logical CPUs than are necessary to consume its entitlement, the partition is capable of overconsuming. For example, if a partition has entitlement 625% but is a logical 10-way, the partition is equipped to consume 1000% even though its entitlement is somewhat less. Again, though, keep in mind that PR/SM will let a partition consume beyond its entitlement only when other partitions are not consuming their entitlements. A few moments ago we introduced the phrase unentitled consumption to describe power consumed beyond entitlement.
Generally speaking, configuring a logical partition with fewer logical CPUs than are required to consume its entitlement constitutes a system management faux pas. A partition with 735% entitlement being configured as a logical 3-way would be an example of such a misstep.
Horizontal-Mode and Vertical-Mode Partitions
IBM recognizes that it is in a partition's interest for PR/SM to dispatch the partition's logical CPUs on physical CPUs in a way that lets the logical CPUs take good advantage of physical memory cache. For this reason, starting with the IBM System z10 IBM introduced a PR/SM enhancement which created the notion of a vertical-mode partition.
Horizontal Partitions
To explain vertical mode, it will help if we first explain the historical mode of operation, called horizontal mode. In a horizontal-mode (usually just called "horizontal") partition, PR/SM manages the partition's logical CPUs according to these simple paradigms:
-
PR/SM distributes a horizontal
partition's entitlement equally over all
of the partition's varied-on logical CPUs. For example, if
the partition is a 10-way with entitlement 630%, each logical
CPU will run with an entitlement of 63%. This means that when
all partitions are using their entitlements, each of the ten
logical CPUs of this partition will be allowed to run to only
63% busy, assuming of course that all ten are trying to run
as busy as possible.
It's important at this point to clarify what we mean above when we say that PR/SM allows those logical CPUs to run to only 63% busy. We do not mean that PR/SM forces those logical CPUs to load wait PSWs the remaining 37% of the time. Rather, we mean that PR/SM simply does not give those logical CPUs any more run time on physical CPUs, even though those logical CPUs are ready to run another instruction. The operating system in the partition will notice that it never voluntarily loads a wait PSW on those logical CPUs and yet CPU time used advances at only 63% of the rate that wall clock time advances. This notion, called involuntary wait or suspend time, shows up on system performance reports in various places.
- PR/SM makes no particular affinity assurances to a horizontal partition about whether a given logical CPU will run over and over on the same physical CPU.
Because of these two factors, a horizontal partition is at risk in a number of ways. First, if its workload is not parallelizable, the partition might be unable to use its entitlement, because it cannot run on enough logical CPUs to do so. Second, the partition's exploitation of memory cache might be nonoptimal, because PR/SM makes no particular assurance to the partition about how still its logical CPUs will be. Third, the partition's logical CPUs are at risk for experiencing cache pollution from other partitions' logical CPUs, for the very same reason. All of this introduces unnecessary cache inefficiency.
Vertical Partitions
To correct these factors, starting with IBM System z10 PR/SM implements the notion of a vertical partition. In a vertical partition, PR/SM manages the logical partition's CPUs according to a new heuristic:
-
First, PR/SM distributes a vertical
partition's entitlement unequally
over its logical CPUs.
The distribution is done in such a
way that the entitlement is packed or concentrated
onto a reasonably small -- usually close to
minimally small -- subset
of the partition's logical CPUs. In a vertical partition,
according to their entitlements
the logical CPUs are called
vertical-high (Vh) CPUs,
vertical-medium (Vm) CPUs, and
vertical-low (Vl) CPUs respectively,
and the entitlements are
distributed like this:
- A Vh is entitled to run to 100% busy.
- A Vm could have any entitlement in the range (0%,100%], depending on the partition's total entitlement and the number of logical CPUs over which the entitlement was distributed. Further, if the partition has total entitlement of at least 50%, each Vm logical CPU present in the partition will have entitlement of at least 50%.
- A Vl is entitled to nothing.
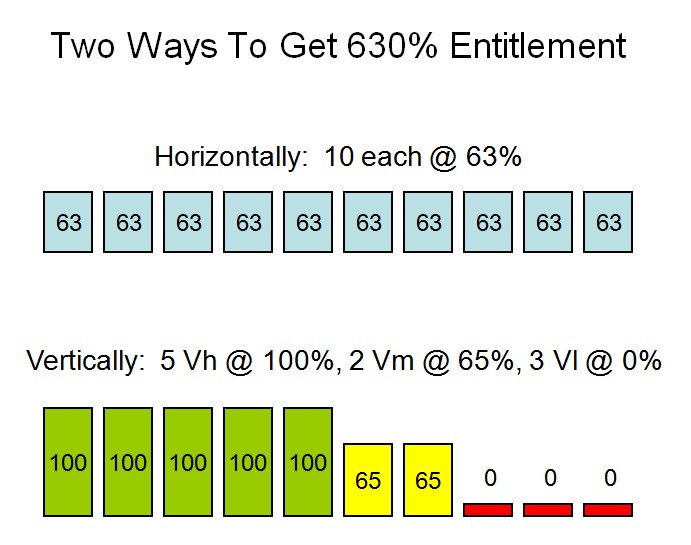
Returning to our logical 10-way partition entitled to 630%, in vertical mode the entitlement would be concentrated so that five logical CPUs were entitled to 100%, two logical CPUs to 65%, and the remaining three to nothing. We would usually refer to this as the partition "having five highs, two mediums, and three lows". See the figure below.
Sometimes we use the word polarity to describe whether a logical CPU is horizontal or vertical. For example, we might say that a Vh has vertical polarity and 100% entitlement.
It's important to remember that the foregoing discussion is about entitlement, not about actual consumption. If there is plenty of unentitled CPU power available on the CEC, a Vm or a Vl can certainly run to 100% busy. Our 10-way partition could certainly run to 1000% busy if there were enough unentitled power available. In such a case, its total CPU consumption would be stated as 630% entitled and 370% unentitled, for a total of 1000%.
-
Further, for a vertical partition
PR/SM makes affinity assurances
about the locations
in the physical machine where the partition's logical CPUs
will be dispatched, like this:
- A Vh will always be dispatched on the same physical CPU. Further, other logical CPUs will be dispatched on that physical CPU only if the Vh is not 100% busy and then only if PR/SM is cornered into needing that physical CPU's power.
- A Vm has affinity to, but will not necessarily always be dispatched on, the same physical CPU. Notice that because its entitlement is somewhat less than 100%, the Vm can expect to share its physical CPU with other logical CPUs, especially if the CEC is very busy.
- A Vl has an even lighter affinity assurance than a Vm has, mostly because the Vl runs on entirely unentitled power and so more topological movement can be expected.
-
Even further, when it activates a vertical
partition, PR/SM
attempts to place the partition's logical CPUs, especially
its Vh CPUs,
close
to one another in the physical machine. For example, if
the partition were a logical 8-way, PR/SM might try to
place the partition's logical CPUs on two chips located
within the same book.
-
Further, PR/SM offers the operating system running in the
partition two very important APIs for understanding the
vertical mode landscape.
-
First, there exists
an API the operating system can use to query the
dispatch affinities of all of its logical CPUs.
This set of data together is called the
partition topology.
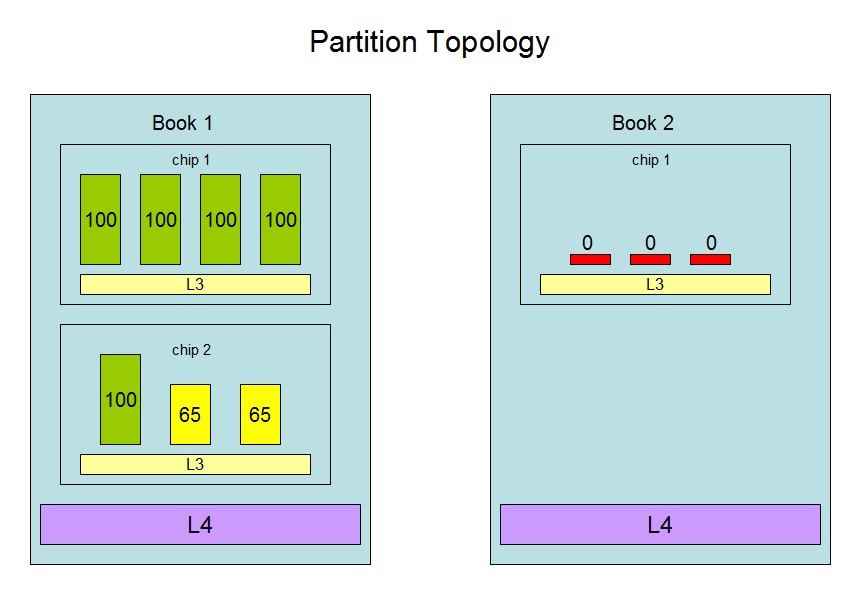
Returning to our 10-way logical partition with entitlement 630%,
the partition's topology might look like this:
- Logical CPU 0 is a Vh with affinity to book 1, chip 1.
- Logical CPU 1 is a Vh with affinity to book 1, chip 1.
- Logical CPU 2 is a Vh with affinity to book 1, chip 1.
- Logical CPU 3 is a Vh with affinity to book 1, chip 1.
- Logical CPU 4 is a Vh with affinity to book 1, chip 2.
- Logical CPU 5 is a Vm at 65% with affinity to book 1, chip 2.
- Logical CPU 6 is a Vm at 65% with affinity to book 1, chip 2.
- Logical CPU 7 is a Vl at 0% with affinity to book 2, chip 1.
- Logical CPU 8 is a Vl at 0% with affinity to book 2, chip 1.
- Logical CPU 9 is a Vl at 0% with affinity to book 2, chip 1.
See the figure below.
- Second, PR/SM also offers the operating system a very low overhead query interface it can use to determine whether something about the partition's topology has changed and so the operating system ought to reissue the partition topology query.
-
First, there exists
an API the operating system can use to query the
dispatch affinities of all of its logical CPUs.
This set of data together is called the
partition topology.
Returning to our 10-way logical partition with entitlement 630%,
the partition's topology might look like this:
-
Last, PR/SM offers the operating system an API it can call to
collect partition weight and CPU consumption information
about all of the
partitions on the CEC. The operating system uses the API
like this:
- The operating system first issues the query.
- The operating system then uses the gathered weights to compute all partitions' entitlements.
- The operating system then uses the calculated entitlements and the gathered consumption data to calculate the amount of entitled power being consumed and to identify the overconsuming partitions.
- From this calculation the operating system then calculates the total amount of unentitled CPU power available and what its own share of that unentitled power might be, if indeed it wanted to overconsume.
Knowing the amount of unentitled CPU power available helps the operating system to discern the amount of work it should expect to get out of its Vm and Vl logical CPUs. For example, if no unentitled power is available, dispatching work on Vl CPUs is pointless. Or, if there is 325% of unentitled power available, and if based on our own weight and the overconsumers' weights and consumptions it appears our partition might be able to get 190% of that, and if we have two Vms at 70% entitlement and one Vl, we could reasonably expect to run our Vms and Vl all to 100% busy if we wanted, because (30% + 30% + 100%) = 160% < 190%.
This API is fully functional for the partition only if the CEC administrator has enabled "Global Performance Data", sometimes also called "Performance Data Control", for the partition in its activation profile on the SE.
For a lot more information about machine topology, horizontal and vertical partitions, and related topics, see the description of the Store System Information (STSI) instruction in Chapter 4, "Control Instructions", of z/Architecture Principles of Operation, available from ibm.com.
System z Operating Systems: Best Practices in Partitions
Given all of the opportunity offered by vertical mode, an operating system running in a System z partition will generally want to behave according to the following heuristics as regards the use of its logical CPUs and the dispatch of its executable units of work (tasks, virtual CPUs, threads, processes, whatever):
-
Ask PR/SM to
switch the partition to vertical mode. This helps PR/SM not to move the
partition's logical CPUs and lets PR/SM concentrate the partition's
entitlement onto a nearly minimally sized
set of logical CPUs that are placed nearby
to one another in the physical computing machine.
-
Sense the partition topology. Having this knowledge lets the operating
system make smart dispatch decisions about its own executable contexts.
-
Try not to move dispatchable units from one logical CPU
to another. Instead, run a given dispatchable unit on the same logical CPU
over and over. Further, if it does become
necessary to move a dispatchable unit,
try to move it to a logical CPU that is close by in the topology,
rather than to one that is far away.
-
Try to run related dispatchable units close to one another in the
partition topology.
For example, if a virtual server is a virtual 2-way, try to run
the two virtual CPUs on logical CPUs that PR/SM has placed onto
the same chip, rather than running them on two separate books.
-
Sense the availability of unentitled CPU power. Having this knowledge
lets the operating system make smart decisions about when to use
its low-entitlement logical CPUs.
- Use low-entitlement logical CPUs only when it appears the CEC has unentitled CPU power available to run them.
What Does z/VM Do With All of This?
The z/VM HiperDispatch enhancement exploits all of the aforementioned System z technology elements to try to run virtual servers in such a way that they will achieve better performance from the System z memory subsystem.
z/VM HiperDispatch, then, consists of enhancements along three major technology lines: use of vertical mode, running on unentitled processors only when appropriate, and dispatching virtual servers in a topologically aware way.
Use of Vertical Mode
One feature of z/VM HiperDispatch is that it is able to run the partition in vertical mode. Doing this lets PR/SM manage the partition's logical CPUs in a way that helps them to experience good cache performance, for all of the aforementioned reasons: reduced motion of logical CPUs, grouping of logical CPUs in the physical machine, and the like.
Whether the partition should be run horizontally or vertically is controlled by the system configuration file's SRM statement or the CP SET SRM command. The default behavior is that z/VM runs the partition in vertical mode. To use horizontal mode, set up the system configuration file to select horizontal mode or issue a CP SET SRM command.
When the partition is vertical, its logical CPUs will be some assortment of Vh, Vm, or Vl logical CPUs, according to the partition's total entitlement and the number of logical CPUs defined. The class E CP INDICATE LOAD command is enhanced to illustrate these things. The excerpt below illustrates the command's output.
New command CP QUERY PROCESSOR TOPOLOGY illustrates the partition's topology. Here is a specimen of its output. Notice that the output is container-major, that is, the output is grouped by topological affinity rather than simply being a list of CPUs. Nesting level 2 is book, and nesting level 1 is chip. So logical CPU 04 below is located in book 1, chip 3.
CP Monitor continues to emit the partition topology in the D1 R26 config record and the D5 R14 event record, just as it did for z/VM 6.2. These two monitor records disclose both the logical CPUs' entitlements -- Vh, Vm, or Vl -- and their affinities in the physical machine.
Perfkit now reports partition topology in a few different places. The PROCLOG report is superseded by the PRCLOG report, which discloses logical CPU polarity and entitlement along with interesting data carried forward from the old PROCLOG. The new TOPOLOG and PUORGLOG reports show partition topology as a function of time. Various other Perfkit reports also mention partition topology when appropriate.
The system configuration file's SRM statement and the CP SET SRM command both offer the system administrator a means to instruct z/VM to run the partition in horizontal mode. This safety valve is provided for workloads which for one reason or another seem not to do well when running vertically.
Controlling the Partition's MP Level
In z/VM 6.2, all varied-on logical CPUs tried equally to run the system's workload. For example, in an 8-way IFL partition, the eight IFLs all tried to run the ambient work. Some of this work they ran because the dispatcher queued it to them. Other work they ran because they "stole" it from other processors' work queues.
z/VM 6.3 introduces the notion of parked logical CPUs. A varied-on logical CPU is said to be parked when at the moment it simply is not participating in the running of the system's work. z/VM can park or unpark a logical CPU at a moment's notice. In other words, parking is a much lighter weight operation than VARYing on or off the logical CPU. Being parked or unparked is a property of whether z/VM is using the logical CPU to do work, not a CPU state as perceived by PR/SM or the System z hardware.
z/VM now routinely parks or unparks logical CPUs so as to adapt the partition's MP level to the computing conditions. Factors z/VM considers include the availability of unentitled power and the amount of z/VM system overhead present. Below we describe the two main MP-level management strategies z/VM uses.
Running As Widely as Available Power Suggests
Absent extenuating circumstances, z/VM generally runs with only enough logical CPUs unparked to consume the CPU power it forecasts PR/SM would let it consume if it wanted. For example, if z/VM were to forecast that for the near future PR/SM would probably let it run to only 830% busy, z/VM would run with only nine logical CPUs unparked. This strategy lets z/VM run prepared to consume the forecast power without incurring unnecessary MP effect.
z/VM uses a statistical, probabilistic method to make its power forecasts. The method works like this:
- Every few moments -- on the order of a couple of seconds -- z/VM issues a query to PR/SM to gather partition weight and consumption information.
- Using this data, z/VM calculates how PR/SM would have changed how it distributed CPU power to the partitions if the z/VM system itself had exhibited infinite demand for power while the other partitions didn't change their appetites for power.
- z/VM's calculated answer for its own partition is precisely the total power it would have been able to get if it had exhibited infinite demand.
- Subtracting its own entitlement leaves z/VM with a quantity called the excess power fraction or XPF. XPF expresses how much unentitled power the z/VM system would have been able to get if it had wanted it.
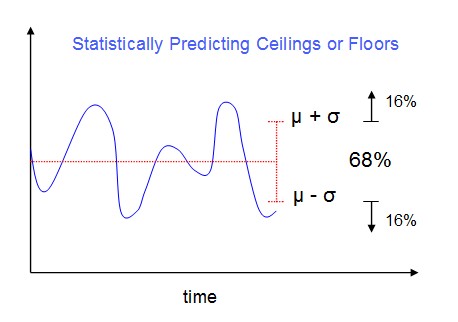
- z/VM keeps a sample history on XPF and uses that sample history to project a likely floor or minimum on what XPF will likely be for the next interval. The projection is formed by calculating the mean and standard deviation of the XPF sample history and then using those values to calculate a likely floor of XPF for the very near future. This calculated likely floor is called XPF' (say "XPF-prime").
- z/VM then unparks enough logical CPUs to be prepared to consume all of its entitlement E plus the forecast excess power fraction XPF'.
Calculation of the likely floor is done using the mean, the standard deviation, and knowledge of the area coefficients for the normal distribution probability density function. The figure below illustrates the basic idea. The blue signal is time-varying but has a red mean in its recent past. Because of the properties of the normal distribution, values greater than one standard deviation above the mean are only 16% likely, as are values more than one standard deviation below the mean. By choosing the correct coefficient for the standard deviation, we can project such values as a 90%-confident ceiling or an 80%-confident floor. The coefficents are well known and are tabulated in any number of reference materials.
|
The system programmer can set how aggressively z/VM will attempt to use unentitled power. In other words, he can control the percent-confidence z/VM uses when it projects the XPF floor XPF'. This control is implemented in the EXCESSUSE clause of the CP SET SRM command and the system configuration file's SRM statement. The system programmer is offered "high", "medium", and "low" aggression settings which correspond to percent-confidence values known to the z/VM Control Program. High aggression corresponds to z/VM using a lower percent confidence and therefore predicting a higher floor and therefore showing increased tendency to unpark Vls. Low aggression works in reverse; XPF floors are projected with very high confidence, which makes them low in magnitude, and unparking of unentitled logical CPUs is done correspondingly conservatively.
In the absence of any other factors, z/VM system administrators will generally find that from one interval to the next, z/VM unparks logical CPUs in a fashion that is just right for consuming E+XPF', that is, the forecast total CPU power that will be available to the partition in the next interval, if the partition wants it. When XPF' is very small, the system administrator will see only the entitled logical CPUs unparked. When XPF' is large, the system administrator will probably see all logical CPUs routinely unparked.
Backing Away from Available Power So As To Avoid Overhead
Sometimes a workload running on N logical CPUs incurs significant system overhead just because N is too large. CPU time gets spent on spinning on locks instead of on doing real work. Seeing very high T/V together with low average utilization per logical CPU is a good sign that this is happening.
z/VM HiperDispatch contains logic to sense these excessive overhead situations and to exploit its parking abilities to try to repair them. The objective here is to park some powered logical CPUs so as to dispose of unnecessary locking overhead and thereby make the workload run better.
z/VM parks itself down to fewer logical CPUs than it would need to consume the forecast power when:
- It appears that z/VM Control Program CPU overhead, usually caused by excessive lock spinning, is large, and
- It also appears that the workload could be satisfied by fewer logical CPUs than would be needed to consume the power forecast.
The technique works like this:
- Every few moments -- on the order of a couple of seconds -- z/VM issues a query to PR/SM to gather partition weight and consumption information. This is the very same query as mentioned previously; the single query sources both algorithms.
- Using this data, z/VM computes its aggregate CPU utilization for the last interval. Call this value U.
- Using the same statistical method as described previously, z/VM projects a utilization ceiling U' for the next interval.
- Using CPU time accumulators it maintains on its own, z/VM triages U into two buckets. The first bucket, labelled v, is CPU time spent running guests -- we sometimes call this virtual time or guest time. The second bucket, labelled c, is CPU time spent running in the z/VM Control Program for whatever reason. The ratio (v+c)/v, called T/V ratio, is an indicator of z/VM system overhead. A value of 1 indicates no overhead at all; the higher the T/V value, the more overhead.
- Using the same statistical method as described previously, z/VM projects a T/V ceiling T' for the next interval.
- If T' is sufficiently large, and if U' looks like it could be contained within fewer logical CPUs than PR/SM would happily power, z/VM parks not only all of the unpowered logical CPUs, but it even parks some of the powered ones, to try to concentrate the workload onto fewer logical CPUs and thereby reduce overhead.
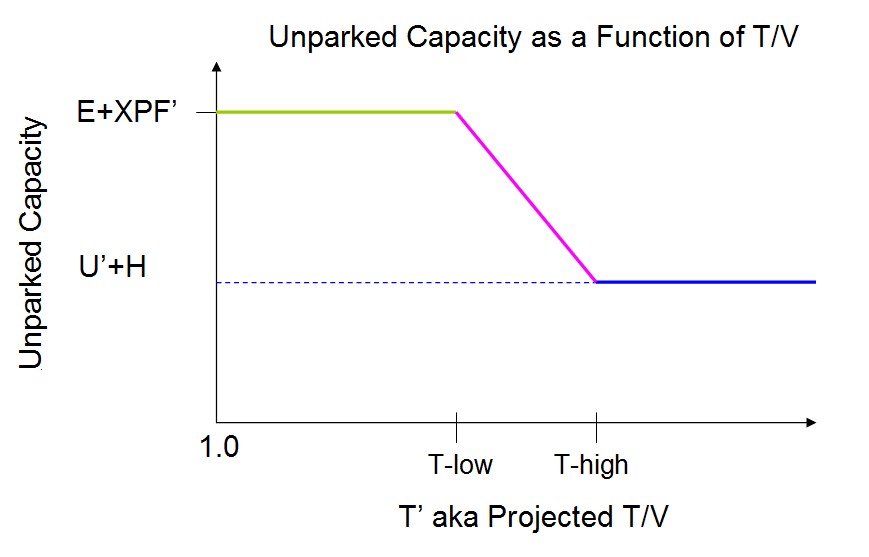
- At its most extreme, z/VM will park itself down to only the number of logical CPUs needed to contain U' plus a system-administrator-specified headroom value H set via the system configuration file's SRM CPUPAD clause or the CP SET SRM CPUPAD command.
The influence of T' on unparked capacity is unfelt below a lower bound T-low and is completely felt above an upper bound T-high, like this:
|
The effect of all of this is that as long as T' is sufficiently low, z/VM unparks fairly liberally, that is, it keeps unparked the number of logical CPUs needed to consume anticipated available power E+XPF', regardless of actual CPU utilization in the partition. However, as T' increases, z/VM parks more aggressively, paying more and more attention to truly needed power U'+H and less and less attention to forecast available power E+XPF'. This strategy lets the workload take advantage of all available parallelism and cache when serialization overhead is not troublesome while reducing the MP level when it appears serialization overhead seems to be causing excessive CPU consumption.
The T-low and T-high thresholds mentioned are not settable by customer externals. Rather, they are constants set in the z/VM Control Program. To arrive at their final values, many different values were tried over a large variety of Apache-based workloads.
One side effect of this T'-based parking strategy is that z/VM systems that are basically idle -- no users doing any work -- tend to park right down to bare minimums. This is because the v component of T/V ratio is extremely small, that is, almost all of the CPU time consumed is being used by the z/VM Control Program itself. This situation causes T' to rise to very high levels and the system therefore parks very aggressively. As soon as users begin doing sizeable work, T' returns to sensible levels and the system tends to unpark to E+XPF' for as long as T/V ratio is not unduly high.
A Few Notes About Parked Logical CPUs
In deciding which logical CPUs to park, z/VM tries to park topological outliers. For example, if the system is parking some of its Vl logical CPUs, it will tend to park the ones that are not physically nearby the Vh and Vm logical CPUs. The same outlier selection technique applies to parking entitled logical CPUs. For example, if it becomes necessary to park a Vm logical CPU, z/VM will try to park one that is topologically distant from, rather than topologically nearby, the Vh logical CPUs.
The CP QUERY PROCESSORS command has been enhanced to display the state of each logical CPU. In the excerpt below we see a substantial number of parked logical CPUs. We caution the reader, though, that a logical CPU can move between parked and unparked states fairly rapidly and so the output of this command could be stale very shortly after it is written to the console.
New event record D5 R16 conveys the park algorithm's outcome every time a new park/unpark decision is made. The event record conveys U, U', XPF, XPF', H, T, T', and a host of other information needed to understand z/VM's decisions.
z/VM HiperDispatch parks processors only if the partition is running in vertical mode. In other words, when running in horizontal mode, z/VM does not park logical CPUs.
Virtual Server Dispatch
z/VM 6.2 and Earlier
In z/VM 6.2 and earlier, dispatching was done according to the following fairly simple heuristic:
-
Virtual CPUs, aka VMDBKs (pronounced "V-M-D blocks"),
that were ready to run were maintained in a single list
called the dispatch list. This dispatch list was
maintained in order by urgency. The VMDBK on the front
of the list was the one that was most "behind schedule", that
is, was the one
which most desperately needed a shot at some CPU time
in order to keep on track with respect to considerations
like scheduler share.
-
Associated with each logical CPU was a VMDBK containment structure called
a Processor-Local Dispatch Vector or PLDV. The PLDV is
nothing more than a data structure that can hold a queue of VMDBKs.
Capacity of a PLDV was finite at 14 entries or VMDBKs.
-
The PLDVs were chained together linearly. The chain would
often but not necessarily be found
in order by CPU address: LPU 0, then
LPU 1, and so on, up to the last LPU (highest CPU address), and then
back around to LPU 0.
-
The general notion of dispatching VMDBKs
was comprised of periodically filling the PLDVs with VMDBKs from the
front of the dispatch list
and then
letting the logical CPUs work off the VMDBKs queued into
their respective PLDVs.
The fill logic
tried to equalize the populations of the PLDVs, as follows:
- If the VMDBK's previous home PLDV is among the emptiest PLDVs, put the VMDBK back on its home, else
- Find any emptiest PLDV and put the VMDBK there.
-
Because of reshuffle's having dealt a given VMDBK
to a specific PLDV,
said given VMDBK would generally
experience a dispatch pattern of running on
the same logical CPU over and over and over,
until it was unrunnable, or
until it had accrued a certain amount of CPU time, or
until it was stolen, explained in a moment, or
until z/VM decided to run the reshuffle process again.
- Every 200 msec, z/VM would forcibly clean out all of the PLDVs and then run reshuffle again.
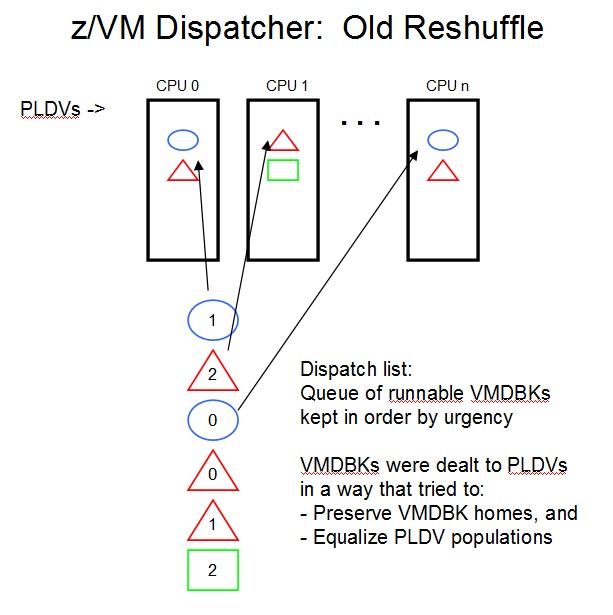
The figure below illustrates the reshuffle process. The sketch shows the PLDVs for the logical CPUs and also shows the dispatch list aka the queue of runnable VMDBKs. In the dispatch list, color and shape illustrate virtual server ownership; for example, the blue ovals are virtual CPUs belonging to one virtual server, the red triangles are for another virtual server, and so on. The figure illustrates that reshuffle dealt out the runnable VMDBKs in a way that tried to equilibrate the PLDV populations, returning a VMDBK to its previous home if that was consistent with trying to equilibrate the populations.
|
One thing to keep in mind about reshuffle is that although it can disturb VMDBK affinity, it runs only occasionally compared to the typical 5 msec minor time slice. A long-computable VMDBK can generally expect that in between those moments when reshuffle might give it a new home PLDV, the VMDBK will generally run on the same logical CPU over and over, provided it is not stolen. Measurements have shown that on some workloads reshuffle is much better at maintaining CPU affinity than one might have guessed from its deal-out nature.
When its own PLDV became empty, a logical CPU would try to find more work to do, as follows:
- If its own PLDV had been marked with a hint, called PLDV overflow, that there might be runnable, yet-unqueued VMDBKs in the dispatch list, it would cause a new reshuffle.
- Finding no such overflow hint in its PLDV, the logical CPU would begin trying to steal VMDBKs from other PLDVs. In stealing, the logical CPU would first check its own PLDV and then hunt the other PLDVs round-robin, following the PLDV chain. In other words, the steal logic paid no particular attention to partition topology.
- Finding no overflow and nothing to steal, the logical CPU would load an enabled wait PSW.
- If the logical CPU were ever awakened from the wait, it would start over: handle the work on its own PLDV, cause reshuffle if its own PLDV says overflow, else try to steal, and when there's nothing further, load an enabled wait.
From the above description it is clear that the former z/VM dispatcher left a few things to be desired. Its shortcomings were:
- A virtual CPU could tend to move within the topology over time.
- Virtual CPUs belonging to a given virtual server were not necessarily run on physically proximal CPUs.
- The load on PLDVs was determined by count of VMDBKs, not by VMDBKs' tendency to use CPU time.
- Steal did not account for topology.
z/VM 6.3 and Later
The z/VM HiperDispatch enhancement runs virtual servers in a manner that is better aware of partition topology. The notion of an urgency-ordered dispatch list remains, but the assignment of VMDBKs to DVs pays more attention to topology. Improvements fall along these lines:
- Reshuffle is improved to make it more topologically aware.
- Work stacking is improved to make it more topologically aware.
- Steal is improved to make it more topologically aware.
- A new needs-help trigger is introduced.
- A new work balancing algorithm, rebalance, is present as an alternative to reshuffle.
In the following sections we explore these changes.
Improvements in Reshuffle
Reshuffle continues to fill DVs using worst-fit (emptiest). This strategy provides lowest dispatch latency and best fairness with respect to satisfying CPU-time metering policies as expressed by virtual server settings such as CPU share.
In z/VM 6.3, reshuffle is enhanced in two key ways so as to improve its awareness of topology:
-
When it places a VMDBK, from
among the emptiest DVs reshuffle
chooses one of the DVs that is topologically closest to the
VMDBK's previous home DV. This helps to reduce topological
movement in the event z/VM cannot return the VMDBK to its
former home.
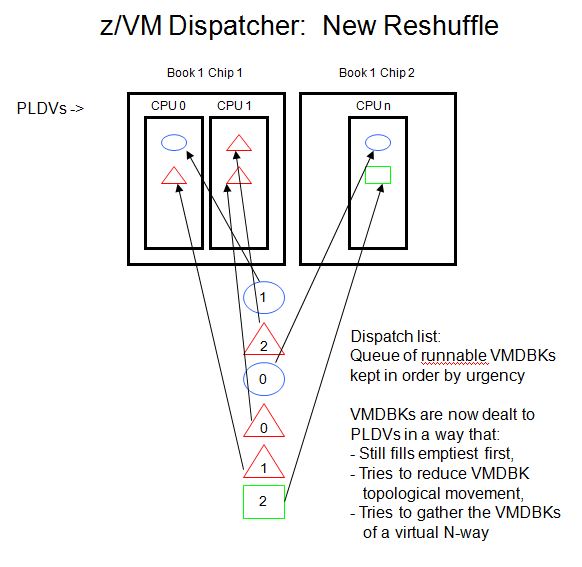
- When dealing out the VMDBKs of a virtual-MP guest, the preferred home DV of every VMDBK of the guest is taken to be the home assigned to the origin VMDBK by the previous reshuffle. This serves as a gathering force for the VMDBKs of a virtual-MP virtual server.
These two changes will help reshuffle to make topologically good choices as the opportunities for doing so present, without compromising its basic philosophy of spreading the runnable work over as many DVs as possible.
Reshuffle does these things whether the partition is horizontal or vertical.
The figure below illustrates the changes to reshuffle.
|
Improvements in Work Stacking
When the z/VM dispatcher stacks a VMDBK onto a PLDV whose CPU is not in wait-state, the stacking CPU finds a wait-state CPU and signals it to wake up. The signalled CPU wakes up, runs the dispatcher, and might eventually steal the stacked VMDBK.
In z/VM 6.2 and earlier, the dispatcher locates the wait-state CPU by finding the first CPU to its right (higher CPU number) that is in a wait state.
In the new stacking algorithm, only when running vertically, the dispatcher locates the wait-state CPU by looking topologically outward from the DV onto which it stacked the VMDBK. Thus if the dispatcher has a choice to awaken a same-chip CPU as opposed to a cross-book CPU, it will pick the topologically closer one.
Improvements in Steal
In z/VM 6.2 and earlier, logical CPUs having no work would visit the other PLDVs round-robin and steal any VMDBKs they could find. The effect of this was that the steal logic could very easily drag a VMDBK across a large topological boundary.
In the new steal, stealing is changed to be aware of topology. The sections below describe the changes.
New Steal: Visit Order
In z/VM 6.2 and earlier, a prowling logical CPU visited the other PLDVs by trolling round-robin to its right (increasing CPU number, wrapping to CPU 0).
In the new steal, the prowling logical CPU hunts topologically outward from its own DV, looking for work to steal. As soon as the logical CPU finds a stealable VMDBK, the logical CPU steals the VMDBK and runs it.
The prowl order is topologically guided whether the partition is running horizontally or vertically.
New Steal: Whether To Steal
In z/VM 6.2 and earlier, when a logical CPU visits a PLDV with intent to steal, if there is something there to take, the logical CPU takes it.
In the new steal, only when running vertically, when the logical CPU is visiting a DV with intent to steal, whether the logical CPU will in fact steal from that DV is decided as follows:
-
Depending on the topological distance between the visiting
CPU and the DV it is visiting, the dispatcher selects two
thresholds it will use in deciding whether to steal:
- A VMDBK delay threshold. A VMDBK which last ran on its home longer ago than the selected threshold will be eligible to be stolen.
- A DV busy-ness threshold. A DV whose CPU last awakened from wait longer ago than the selected threshold will be eligible to have VMDBKs stolen from it.
The threshold magnitudes increase with increasing topological distance. Further, within the smallest topological container supported by the machine, the thresholds are zero.
-
If the visited DV contains a VMDBK whose time since last
run on its home exceeds the selected delay threshold, the
VMDBK will be stolen.
- If the visited DV's CPU has been non-wait for longer than the selected busy-ness threshold, a VMDBK will be stolen from the DV.
The effect of this algorithm is that a logical CPU will steal from a DV only if the intensity of the need outweighs the topological distance over which the steal will take place. The farther the topological distance, the more dire the situation needs to be.
The thresholds mentioned are not settable by customer externals. Rather, they are constants set in the z/VM Control Program. To arrive at their final values, many different values were tried over a large variety of Apache-based workloads.
New CP Monitor record D5 R17 MRPRCRCD logs out the steal behavior of every logical CPU. For each logical CPU, the record conveys in-chip, cross-chip, and cross-book steal counts. This information lets the reduction program depict topologically aware steal.
DV Needs Help
In z/VM 6.2 and earlier, there was no notion of a logical CPU detecting that it was not keeping up with the work queued into its PLDV.
In z/VM 6.3, there definitely is such a notion. For each DV, the logical CPU associated with the DV stores into the DV the current TOD value every time the logical CPU exits a wait state. Thus the DV always bears a stamp of the last moment that its logical CPU came out of a wait.
Provided the DV's logical CPU is not in a wait, the value of this last-wait-exit TOD, when compared to the current TOD, can be thought of as a congestion metric or busy-ness metric for the DV. The amount of time that has passed since the most recent wait-exit occurred tells how long the DV's logical CPU has been continuously busy and therefore is a metric on how severely the DV needs help from outside logical CPUs.
About every minor time slice, each logical CPU uses its DV's last-wait-exit TOD to calculate how long it has been continuously running and then proceeds like this:
-
If the logical CPU has been running continuously for longer than
a fairly large my DV needs help from any available CPU threshold,
the logical CPU finds the topologically closest wait-state logical CPU
in the whole system
and uses Signal Processor (SIGP) to wake it up.
- If the logical CPU has been running continuously for longer than a moderately sized my DV needs help from within my book threshold, the logical CPU finds the topologically closest wait-state logical CPU in its own book and uses Signal Processor (SIGP) to wake it up.
In this way, each logical CPU of a DV calls for topologically appropriate help for its DV when it appears help is needed.
A New Work Balancer: Rebalance
A new algorithm called rebalance is an alternative to reshuffle. Rebalance is a numerically intensive, CPU-utilization-sensing algorithm that tries to balance the load on the DVs according to CPU utilization considerations.
Because of unequal logical CPU entitlement and because of time-varying unentitled power, the DVs of the system can each have distinct capacities to do work. For example, when no unentitled power is available, a Vm likely cannot do as much work as a Vh.
Rebalancing the work, then, consists of assigning virtual servers to DVs according to comparisons of virtual server CPU consumption against DV capacity.
In the following sections we explain various aspects of the rebalance algorithm.
Rebalance: Tracking Virtual CPU Utilization
z/VM uses the following iterative technique to track virtual servers' CPU consumption in a manner usable by rebalance:
- When a pass of rebalance begins, for every virtual CPU, z/VM calculates the amount of CPU time the virtual CPU has used since the last rebalance. Call this value g.
- Next, z/VM sums the g values for each virtual server, to obtain each virtual server's total CPU time used since last rebalance. Call this value G.
- Using the statistical method described earlier, for each virtual server z/VM computes a utilization ceiling projection G' for the next interval.
- z/VM then sorts the virtual servers according to their G' values, highest to lowest. Virtual servers whose projections G' are below a certain threshold are not sorted.
This sorted list of users is the input to the rebalance algorithm. In other words, each time it runs, rebalance fits virtual servers into DVs in order according to their projected next-interval CPU consumption, fitting the apparently heaviest virtual servers first.
Rebalance: Fitting Virtual Servers to DVs
The rebalance algorithm assigns virtual servers into DVs, deciding the assignments in order according to the virtual servers' projected next-interval utilization ceilings G', but assessing actual fit according to virtual server G or VMDBK g as required according to the context of the comparison. G and g are used for fit assessment because without exorbitant calculation they are the best predictor of next-interval usage.
Fitting a user into a DV does not mean actually queueing its VMDBKs into that DV. Rather all it means is assigning each virtual CPU a home DV. If and when the virtual CPU actually needs to run, z/VM will run it by inserting the VMDBK into its home DV and letting the associated logical CPU dequeue and run the VMDBK.
The general objective of rebalance is to try to fit virtual servers into DVs subject to the following admittedly conflicting criteria:
- Run related virtual CPUs close to one another within the topology;
- Try not to move virtual CPUs unnecessarily;
- Try to run the total workload over all of the unparked logical CPUs.
In running the workload in such a fashion, we intend to help virtual CPUs to build up useful context in close-in caches, help related virtual CPUs to build up mutually useful cache contents, help unrelated virtual CPUs not to disrupt each other's caches, and help the workload to use all cache space available to the partition.
Prior to assigning each user a home DV, z/VM first scales down all DVs' capacities according to the aggregate system utilization. This encourages rebalance to spread the system's total workload across all DVs instead of piling all of the work into some small subset of the system's DVs.
Then, starting with the projected heaviest virtual server and working down through the list, z/VM assigns virtual CPUs to home DVs, according to the following considerations:
- A virtual server's previous home DV is taken to be the previous home DV for the virtual's server's origin VMDBK, usually but not always its VCPU 0.
- If the virtual server's previous interval CPU consumption G fits into the remaining capacity of the virtual server's previous home DV, all of the virtual server's virtual CPUs are homed to that DV. Else,
- If we can find some other lowest-level container that is a sibling to the previous home DV (think "chip in the previous home book") that will entirely fit this virtual server, all of the virtual server's virtual CPUs are homed to that DV. Else,
- Find the lowest-level topology container where the virtual server will best-fit and put it there, splitting the VMDBKs into that container's DVs if needed.
- When the DVs run out of capacity, resort to round-robin for placing the rest of the VMDBKs.
Notice that at its first step this scheme nods to not moving a virtual server, but generally otherwise it prioritizes close grouping of the virtual server's VMDBKs over not moving them.
Notice that one of the effects of rebalance is that generally it can result in the logical CPUs of a partition exhibiting CPU utilizations unequal to one another. In other words, within a given CP Monitor interval, some logical CPUs in the partition might be quite busy while others are quiet. This behavior is quite different from z/VM 6.2, on which the logical CPUs' respective utilizations tended to equalize. z/VM 6.3's unequal utilizations are not a symptom of a malfunction.
Changed monitor records D4 R3 MRUSEACT and D4 R2 MRUSELOF log out the effect of rebalance on every virtual CPU. By analyzing the rebalance data in these records, a reduction program can display how a given pass of rebalance placed the users. Further, by focusing on one specific user's records, the reduction program can display how rebalance treated said user over time.
Experiments have shown us that rebalance is a good work distributor to use only when the workload meets all of the following criteria:
- There are not that many virtual servers logged on.
- The virtual servers' mean CPU utilizations reliably distinguish them from one another as regards their moment-to-moment CPU utilization habits.
- The ratio of VMDBKs to logical CPUs is not that large.
When all of those criteria are satisfied, rebalance makes very steady home-DV assignments and virtual servers experience little motion among logical CPUs.
Most z/VM customers' workloads don't fit those criteria, though. z/VM's strength is in its ability to overcommit: overcommit memory, overcommit processors, and overcommit I/O. In workload consolidation accounts where overcommitment is king, the numerically intensive efforts of rebalance probably will not pay off. As such, it is IBM's recommendation that customers turn on the rebalance function only if IBM directs them to do so. All other customers should run with reshuffle, which is the system's default.
What the Virtual Server Sees
z/VM does not set bit 11 in the STFL/STFLE response it provides to guests. This tells the guest that the configuration-topology facility is not available. This in turn tells the guest that neither STSI 15.1.x nor the PTF instruction is available.
Workloads Likely to Benefit from z/VM HiperDispatch
Workloads likely to benefit from deploying z/VM HiperDispatch are those for which:
- The workload would have experienced better performance if only z/VM had requested PR/SM to run the partition in vertical mode;
- The workload would have experienced better performance if only z/VM had dispatched it in a more topologically aware fashion;
- The z/VM Control Program would have experienced less contention in serialization if only it had run the aggregate workload on fewer logical CPUs.
Note that benefit doesn't necessarily mean improved transaction rate (ETR) or decreased transaction response time. Those metrics will improve only if cache performance or excessive serialization was the workload's bottleneck.
More specifically, these criteria will help to identify workloads most likely to benefit:
-
In general, the workloads most likely to see big benefit
from z/VM HiperDispatch are
CPU-constrained
workloads consisting of a few virtual-MP virtual
servers each using significant CPU time.
This is because of several factors.
- This is the kind of workload that will benefit from rebalance.
- The rebalance logic will tend to group those heavy users' virtual CPUs together in the partition topology while placing the virtual servers themselves apart from one another in the topology.
- Further, said placement will allow these heavy virtual CPUs to populate their respective close-in caches with useful memory contents.
- Also, those cache contents are likely to be useful by all of the virtual CPUs of a virtual server, because all of those virtual CPUs share the same memory.
- Finally, the far-apart placement of the virtual servers themselves lets them not disrupt each others' caches.
-
In general, workloads consisting of a very large number of
light-consuming, wait-prone
virtual CPUs will likely
see little to no benefit
from z/VM HiperDispatch.
For one, the workload is probably not CPU-constrained
anyway and so decreasing CPI probably will not help ETR.
But further,
no virtual CPU runs long enough
to build up anything durably useful in a cache, and by the
time it runs next, whatever it had built up is long
gone, so the likelihood of decreasing CPI is probably
small anyway.
-
If the workload's
memory footprint is very large compared to the amount of cache
available, once again, improving dispatch heuristics probably
will not help cache performance all that much. The cache
contents probably turn over too fast for dispatch heuristics
to have a big influence on CPI.
This is even more true if the workload is memory-overcommitted.
-
A workload running in a partition which has only one cache
locus is probably
less likely to see big benefit from z/VM
HiperDispatch than is
a workload running in a
partition that has lots of cache loci available. For
example, a small 2-way
partition with two Vm processors both
residing in the same chip
probably will not see the
big CPI improvements that one might expect to see
in a 32-way partition that spans eight
or ten chips on two books. In the smaller partition,
there is just not as much opportunity for z/VM HiperDispatch
to compartmentalize the workload as there is in the larger
partition.
-
A z/VM system running in a partition on a large, very
heavily utilized CEC consisting of a number of busy
partitions
might not see as much improvement from
z/VM HiperDispatch as it would if the other partitions
on the CEC did not exist or
were quiet. The cache is trying to do its
best for all partitions, and other partitions' memory
references compete with the z/VM partition's references
for cache capability. This is especially true within
a single book.
We sometimes use the phrase
LPAR interference to describe this phenomenon.
However,
if all of the operating systems in the partitions can
switch to vertical mode, less interference will probably
result.
-
Some workloads' cache performance is bad because of
bad application
algorithms, not because of
bad dispatching. For example, if an
application's loop
steps through a matrix column-major but the matrix is stored in
memory row-major, changing the dispatching paradigm probably will
not help cache performance.
-
If System z CPU Measurement Facility (CPUMF)
data is showing large fractions of total CPI being spent
in cache miss CPI, z/VM HiperDispatch might help the workload.
In our
CPUMF article
we discuss how to use CPUMF to assess a z/VM workload.
- If CP Monitor data is showing large spin times on locks, especially on the scheduler lock SRMSLOCK, or if the system is showing large T/V but only moderate percent-busy on all of its logical CPUs, it might be worth trying z/VM HiperDispatch to see whether it will concentrate the workload onto fewer logical CPUs and thereby decrease spin behavior and consequently T/V.
It is important to remember that the customer might consider decreased CPU time per transaction to be a very valuable win even though his workload's ETR or transaction response time did not change. For example, if the CPU utilization reduction is large enough, the CEC might now be able to host another partition. Think carefully about all factors before deciding whether deploying z/VM HiperDispatch brought benefit to the customer.
One comfort with z/VM HiperDispatch is that generally speaking, the algorithms and techniques it uses to try to extract good performance from the memory subsystem aren't generally known to be harmful.
Note also that using vertical mode is the default way the system now operates. To force z/VM to use horizontal mode, use the CP SET SRM command or the system configuration file's SRM statement.
Assessing the Impact of z/VM HiperDispatch
The prime purpose of z/VM HiperDispatch is to help the workload to get good performance from the System z memory subsystem. To assess whether z/VM HiperDispatch is achieving its purpose, we need to have metrics to measure workload performance and to measure memory performance. Further, we need to use those metrics to compare a base case to a revised case, to see what change occurred. Last, we need to assure ourselves that in moving from the base case to the comparison case, the system was held constant except for introducing the z/VM HiperDispatch technology.
In a laboratory setting it is fairly simple to compare a base case to a comparison case, all factors held constant except for the one whose effect is sought. IBM routinely does this in its lab measurements. We run a prescribed workload, introduce the single change, run the prescribed workload again, and compare the two runs. This is a fairly sanitary way of doing things, and it yields generally good comparisons.
Further, the laboratory workloads IBM runs generally consist of some homogeneous workload that has a well-defined notion of transaction, and therefore an easily measured transaction rate. Because of this, it's fairly easy to compute meaningful success metrics, such as CPU time used per transaction performed, for every run of the experiment.
In a customer environment, many of these assurances about workload and measurement tend not to be present. For one, customer workloads tend to be quite heterogeneous; often there does not exist any specific definition of transaction, let alone a counted transaction rate. Some analysts will tend to use a system's aggregate virtual I/O rate as a synthetic transaction rate. This will generally work OK as an approximation as long as we know we have not changed the system's configuration from the base case to the comparison case.
As for measuring memory performance per se, there are a couple of different things we can do.
-
System z machines offer the CPU Measurement Facility
(CPUMF)
as a way to collect clock cycles per instruction (CPI)
data for the running workload.
Since z/VM 5.4, z/VM has been
able to collect the System z hardware's
CPUMF counters and
log them out to CP Monitor in D5 R13 MRPRCMFC sample
records.
Though z/VM Performance Toolkit does not
reduce or analyze the D5 R13 records, a customer wanting
his records analyzed can contact IBM for assistance
or can use the
CPUMF
informal software package.
Assuming the customer held his workload constant, he
could assess memory performance by looking at CPU-MF-derived
CPI numbers before and after, with success being indicated
by reduced cache miss component of CPI.
- CPU time used generally falls into two large buckets: time the instructions spend actually doing work, such as adding, multiplying, comparing, and the like, and time the instructions spend waiting for cache to deliver the needed memory contents. Thus we can roughly approximate the performance of the memory system by looking at CPU time used per unit of work done. Assuming we have made no changes to the configuration, so that in turn we can assume the number of instructions run per unit of work was held constant, we can generally go on to conclude that CPU time per unit of work decreased because cache miss time decreased, in other words, because memory performance improved. Any reasonable CPU time report, such as Perfkit's SYSSUMLG or PRCLOG, will serve for this, provided also an actual or synthetic transaction rate is available so that we can normalize the CPU consumption per transaction.
A second objective of z/VM HiperDispatch is to try to reduce z/VM Control Program serialization contention in cases where the Control Program can recognize the contention and seems to have at its disposal means to take corrective action. Generally measurements of system T/V and of CPU time per transaction will reveal whether the Control Program succeeded along these lines. More specifically, analysts can examine FCX265 LOCKLOG to see whether key system locks are experiencing reduced contention. Monitor record D0 R13 MRSYTSCP contains spin counts specific to the SRMSLOCK scheduler lock and could also be analyzed by hand to look for evidence of reduced serialization-related contention.
Ultimately, customer workload success measures such as transaction rate, CPU time used per transaction, and transaction response time are the most important measures of whether an implemented change turned out well.
Some Words About LPAR Interference
We mentioned LPAR interference earlier, but the topic is so important that it merits further discussion.
Consider a z/VM system that runs in a CEC whose other partitions are one day 550% busy but the next day 2550% busy. Our z/VM system is very likely to feel the performance effects of those other partitions' increased activity on the second day. This is true even when some or all of the CEC's partitions are defined as dedicated. As we said before, System z memory cache is a CEC-wide facility, and so the memory reference habits of one partition can definitely affect the memory performance experience of the others.
A partition's change in memory performance experience would show up in a couple of important ways. With CPUMF we could see that our z/VM system's logical CPUs were experiencing increased cache miss cycles per instruction on the second day. The increase in cache miss CPI would likely result in an increase in CPU time per transaction. This would probably emerge as an unexplained rise in CPU utilization as tallied in system performance reports. In an extreme case, ETR could even drop because the system became constrained for CPU.
One way to reduce LPAR interference is to make sure each partition on the CEC is running vertically. This helps PR/SM to compartmentalize the partitions' logical CPUs so as to reduce their executions' effects on one another. For quite some time now z/OS has offered HiperDispatch and vertical-mode operation. With the emergence of z/VM HiperDispatch, it becomes more easy to make sure all partitions are running vertically.
Another way to reduce LPAR interference is to avoid unnecessary concurrent intense activity in all partitions. If the CEC's aggregate workload can be scheduled in such a way that the partitions' respective peak times are staggered, this can tend to help the urgent partition's vital work not to be affected so much by noncritical work running in other partitions.
A third way to reduce LPAR interference is to make sure each partition is configured correctly for its workload and for the physical resource share of the CEC it truly deserves. Configuring too many logical CPUs for a partition can encourage the operating system in the partition to to run its work in too highly parallelized a fashion, especially if the partition runs horizontally. We can tell that the partition has too many logical CPUs for the workload if we very often see all of the logical CPUs just a little bit busy. Reducing logical CPU counts in these situations can help.
z/VM Performance Toolkit Highlights
As it developed z/VM HiperDispatch IBM identified the need for several new or changed Perfkit reports. In this short section we identify the highlights of the Perfkit changes relevant to z/VM HiperDispatch. For specifics of every Perfkit change made for z/VM 6.3, consult the Perfkit documentation.
CEC Physical Load
New report FCX302 PHYSLOG illustrates the physical CPU load on the CEC, by physical processor type, by time.
For each CPU type pool -- the physical IFLs, the physical CPs, and so on -- the report tabulates the three kinds of CPU time expended by the type pool:
- %LgclP: Percent-busy spent running the instructions of logical CPUs;
- %Ovrhd: Percent-busy spent running the instructions of PR/SM but directly induced by and therefore charged to logical CPUs;
- %LPmgt: Percent-busy spent running the instructions of PR/SM but not directly induced by and therefore not charged to logical CPUs.
(For more information about these, see our CPU time article.)
Because the ratios of those three kinds of time are an important measure of system overhead, the report introduces some new columns that z/VM performance analysts might not recognize at first but will immediately understand as soon as they are explained:
-
LpuT/L is just (%LgclP+%Ovrhd)/%LgclP,
in other words,
total CPU time charged to logical CPUs
divided by
CPU time actually used by logical CPUs running
their own instructions.
This is basically the "per-user T/V" concept from
z/VM,
extended to the notion of logical CPUs.
PR/SM sometimes runs its own instructions but charges those
instructions' CPU time to the logical CPU that caused them.
LpuT/L expresses that overhead time as a ratio, just as
z/VM uses per-user T/V to express Control Program CPU
time that was charged to a user because the user induced it.
- TypeT/L is just (%LgclP+%Ovrhd+%LPmgt)/%LgclP, in other words, total CPU time used in the type divided by CPU time actually used by the type's logical CPUs running their own instructions. This is basically the "system-wide T/V" concept from z/VM, extended to the notion of logical CPUs. Time spent in PR/SM is either chargeable to logical PUs or is unchargeable time PR/SM used for its own purposes. The sum of those three kinds of time, divided by time actually used by logicals, yields TypeT/L, which is a good expression of overall PR/SM overhead.
The main reason for looking at this report is to find out whether a CPU type pool is completely busy. There previously was no easy way to determine whether the CEC were experiencing a CPU constraint.
Another reason to look at this report is to get a feel for the amount of PR/SM overhead present. If the amount seems large, consider tuning the configurations of the partitions, such as by removing unnecessary logical CPUs.
Partition Configuration and Entitlement
New report FCX306 LSHARACT illustrates the weights and entitlements of the partitions on the CEC. The excerpt below illustrates LSHARACT.
Interesting columns on the new report are:
-
The Entlment column expresses
the partition's entitlement.
-
The Excess column is CPU utilization beyond entitlement.
- The LPU Conf expresses whether the partition is underconfigured u, correctly configured -, or overconfigured o with logical CPUs compared to its entitlement. For example, in the snippet below, for processor type CP, partition RCT1 has 20 logical CPs but entitlement of only 60.2%, so Perfkit classifies it as overconfigured.
The main reason for looking at the LSHARACT report is to find out whether partitions' entitlements, logical CPU counts, and CPU consumptions all seem to be in correct relation to one another. Kinds of exceptions to look for and correct include:
- If a partition is configured with too few logical CPUs
to consume its entitlement, we might consider reducing its
weight or adding logical CPUs.
- If a partition is configured with grossly more logical CPUs
than are required to consume its entitlement, we might consider
whether we have given it too little weight. We might perhaps
instead consider whether we have given it too many logical
CPUs, that is, whether we have inadvertently given it an
opportunity to consume far more CPU power than we intended.
- If a partition is often found to be consuming beyond its entitlement, we might ask why that is and whether we ought to make an entitlement adjustment.
z/VM HiperDispatch Settings
The FCX154 SYSSET report is enhanced to show the settings of several of the most important z/VM HiperDispatch controls, such as whether the partition is vertical, how aggressively z/VM is trying to use unentitled power, and the like. The changes are self-explanatory.
Partition Topology
New report FCX287 TOPOLOG shows a log of partition topology as a function of time. The report is container-major. The following excerpt illustrates the report. The excerpt below is from a z10 and so it reveals only book number.
New report FCX298 PUORGLOG also illustrates partition topology as a function of time. Unlike TOPOLOG, the PUORGLOG report is logical-CPU-major instead of container-major. For each CPU, its location is expressed as book:chip. The excerpt below is from a z10 and so it reveals only book number.
Studying the topology reports helps to reveal how PR/SM has placed the partition's logical CPUs in the physical machine. Because there is no knob available for adjusting the placement, some analysts might say the report isn't terribly useful. However, order of partition activation is known to influence partition placement, so if you believe a partition has received adverse placement, you can consider whether to activate the partitions in a different order the next time you start the CEC.
Parking Behavior
The FCX225 SYSSUMLG report is enhanced to show the number of processors that happened to be unparked at the close of every monitor sample interval.
The FCX239 PROCSUM report is enhanced to show the number of processors that happened to be unparked at the close of every monitor sample interval.
The new FCX299 PUCFGLOG shows the system's park/unpark behavior as a function of time. Below find an excerpt. For rendering reasons, we have split the report into the leftmost and rightmost columns.
This report is useful in helping to decide whether unparked capacity played a role in adverse system performance. For example, if response time problems were found to be correlated with parking behavior, a tuning action to reduce parking behavior, such as increasing CPUPAD or increasing entitlement, might be indicated.
Summary
The z/VM HiperDispatch enhancement is meant to help the workload to get good performance from the System z memory subsystem, especially from its caches. To achieve this, z/VM HiperDispatch runs the partition in vertical mode, dispatches virtual servers in a topologically aware way, and uses logical CPUs in accordance with availability of physical CPU power.
Workloads most likely to get benefit from z/VM HiperDispatch are those for which cache performance is most likely to influence total performance. Workloads having these traits usually involve a few CPU-heavy virtual servers for which isolating their execution from one another in the physical hardware will allow cache to adapt well to the respective servers' memory reference habits.
Measurement of z/VM HiperDispatch effect is best done using the System z CPU Measurement Facility. This is because the prime purpose of z/VM HiperDispatch is to improve cache miss CPI, and CPUMF reports comment directly on cache miss CPI. CPU utilization reports can indirectly illustrate cache miss CPI and thus are another way to measure the effect of z/VM HiperDispatch. CPU time consumption reports can be used, though, only if they are normalized by transaction rate.
z/VM Performance Toolkit includes many new or changed reports that help the performance analyst to understand the behavior of z/VM HiperDispatch. These reports illustrate physical CEC load, partition entitlements, key z/VM system settings, partition topology, logical CPU park/unpark behavior, and rebalance treatment of users, among other lesser items.