z/VM HiperDispatch
Abstract
The z/VM HiperDispatch enhancement exploits System z and PR/SM technologies to improve efficiency in use of CPU resource. The enhancement also changes z/VM's dispatching heuristics for guests, again, to help improve CPU efficiency. According to the characteristics of the workload, improvements in measured workloads varied from 0% up to 49% on ETR.
z/VM HiperDispatch also contains technology that can sense and correct for excessive MP level in its partition. According to the characteristics of the workload, this technology can even further improve efficiency in use of CPU, but how this affects ETR is a function of the traits of the workload.
Introduction
In z/VM 6.3 IBM introduced the z/VM HiperDispatch enhancement. With this enhancement z/VM now exploits System z and PR/SM technology meant to help a partition to run more efficiently. Also with this enhancement z/VM has changed the heuristics it uses for dispatching virtual servers, to help virtual servers to get better performance.
Our Understanding z/VM HiperDispatch article contains a functional description of the z/VM HiperDispatch enhancement. The article includes discussions of relevant System z and PR/SM concepts. The article also discusses workloads, measurements, and z/VM Performance Toolkit. The reader will probably find it helpful to refer to that article in parallel with reading this chapter of the report.
Method
To measure the effect of z/VM HiperDispatch, two suites of workloads were used.
The first suite consisted of workloads routinely used to check regression performance of z/VM. Generally speaking these workloads are either CMS-based or Linux-based and are not necessarily amenable to being improved by z/VM HiperDispatch. As cited in Summary of Key Findings, generally these workloads did not experience significant changes on z/VM 6.3 compared to z/VM 6.2.
The second suite of workloads consisted of tiles of Virtual Storage Exerciser virtual servers, crafted so that the workload would be amenable to being improved by z/VM HiperDispatch. These amenable workloads were run in an assortment of configurations, varying the makeup of a tile, the number of tiles, the N-way level of the partition, and the System z machine type. The suite was run in a dedicated partition while said partition was the only partition activated on the CEC. This assured that logical CPU motion would not take place and that interference from other partitions would not be a factor in a difference in results. The suite was also run in such a fashion that the topology of the partition would be the same for a given N-way for all of the various releases and configurations. This assured that a topology difference would not be a factor in a difference in results. Finally, the suite was run very memory-rich.
The writeup below presents select representatives from the second suite. Cases presented are chosen to illustrate various phenomena of interest.
Results and Discussion
It Needs Room to Work
When there are far more ready-to-run virtual CPUs than there are logical CPUs, z/VM HiperDispatch does not improve the workload's result. But as partition capacity increases for a given size of workload, z/VM HiperDispatch can have a positive effect on workload performance. In other words, if the workload fits the partition, z/VM HiperDispatch can make a difference.
To illustrate this several different families of measurements are presented.
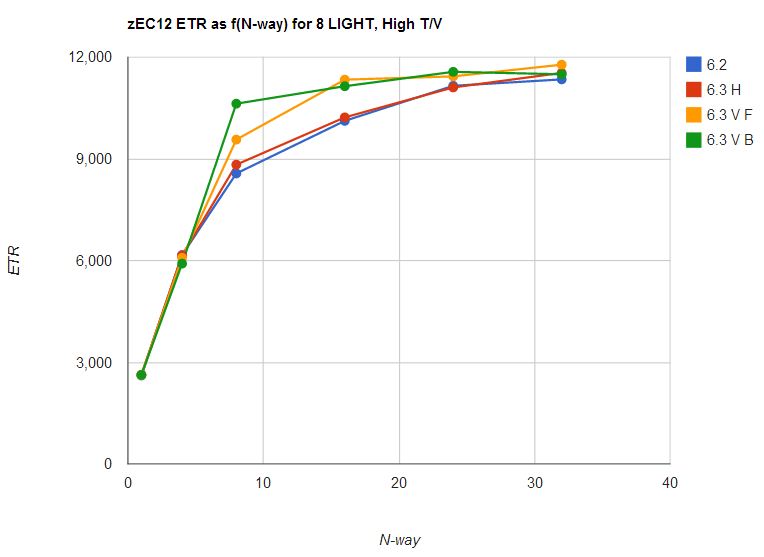
One family is eight light, high-T/V tiles. Each light tile consists of three virtual CPUs that together produce 81% busy. Thus running eight of them produces 24 virtual CPUs that together attempt to draw 648% chargeable CPU time. This workload runs with T/V that increases with increasing N. At N=8 the T/V is approximately 1.5.
Figure 1 illustrates the result for this workload in a variety of N-way configurations. z/VM 6.3 had little effect on this workload until N=8. At N=8, z/VM 6.2 had ETR 8,567, but z/VM 6.3 vertical with rebalance had an ETR of 10,625 for an increase of 24%. As illustrated on the chart, z/VM 6.3 run vertically did better on this workload than z/VM 6.2 at all higher N-way levels. This graph helps to illustrate that z/VM 6.3 run horizontally differs very little from z/VM 6.2.
| Figure 1. zEC12, 8 light tiles, high T/V, ETR as f(N-way), for N=1, 4, 8, 16, 24, and 32, for z/VM 6.2, z/VM 6.3 horizontal (H), z/VM 6.3 vertical reshuffle (V F), and z/VM 6.3 vertical rebalance (V B). |
|
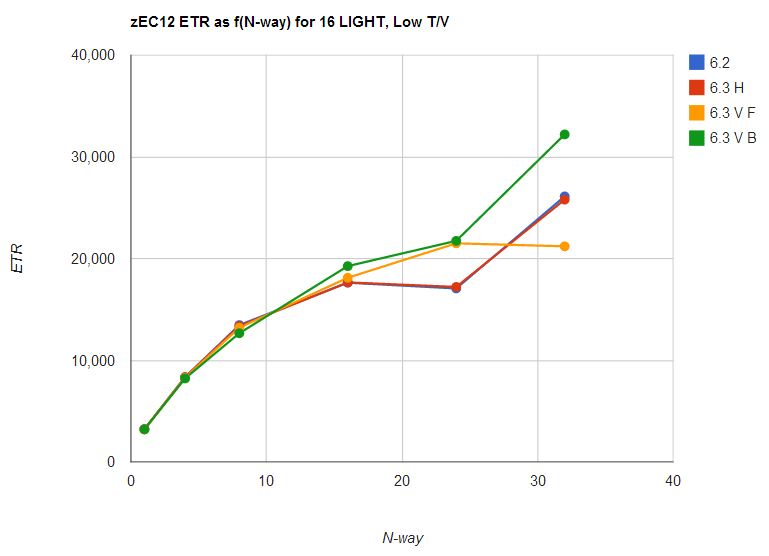
Another family is 16 light, low-T/V tiles. Each light tile consists of three virtual CPUs that together produce 81% busy. Thus running 16 of them produces 48 virtual CPUs that together attempt to draw 1296% chargeable CPU time. This workload runs with T/V of 1.00.
Figure 2 illustrates the result for this workload in a variety of N-way configurations. z/VM 6.3 had little effect on this workload until N=16. At N=16, z/VM 6.2 had ETR 17,628, but z/VM 6.3 vertical with rebalance had an ETR of 19,256 for an increase of 9%. At N=24 z/VM 6.3 vertical achieved an ETR of roughly 21,500, which was 26% better than the horizontal configurations' ETRs of roughly 17,100. This graph too helps to illustrate that z/VM 6.3 run horizontally differs very little from z/VM 6.2.
| Figure 2. zEC12, 16 light tiles, low T/V, ETR as f(N-way), for N=1, 4, 8, 16, 24, and 32, for z/VM 6.2, z/VM 6.3 horizontal (H), z/VM 6.3 vertical reshuffle (V F), and z/VM 6.3 vertical rebalance (V B). |
|
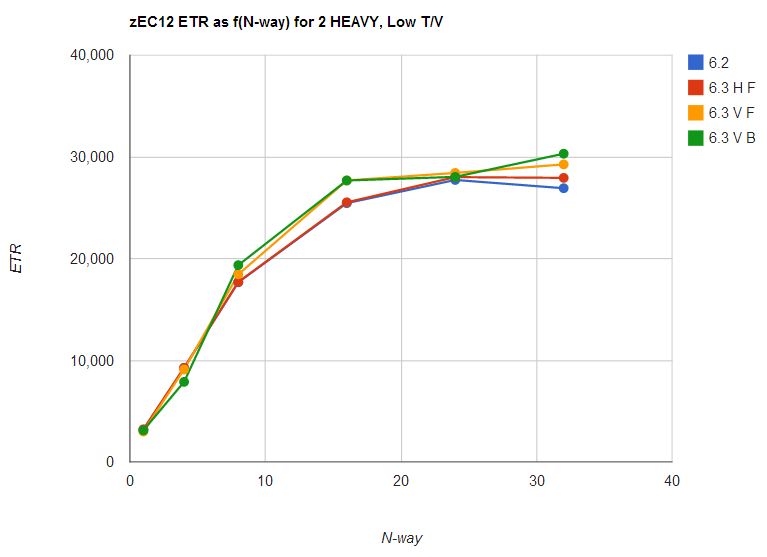
Another family is two heavy, low-T/V tiles. Each heavy tile consists of 13 virtual CPUs that together produce 540% busy. Thus running two of them produces 26 virtual CPUs that together attempt to draw 1080% chargeable CPU time. This workload runs with T/V of 1.00.
Figure 3 illustrates the result for this workload in a variety of N-way configurations. z/VM 6.3 had little effect on this workload until N=8. At N=16 the two horizontal configurations had ETR of 25,500 but the two vertical configurations had ETR of 27,700 or an increase of 8.7%.
| Figure 3. zEC12, 2 heavy tiles, low T/V, ETR as f(N-way), for N=1, 4, 8, 16, 24, and 32, for z/VM 6.2, z/VM 6.3 horizontal (H), z/VM 6.3 vertical reshuffle (V F), and z/VM 6.3 vertical rebalance (V B). |
|
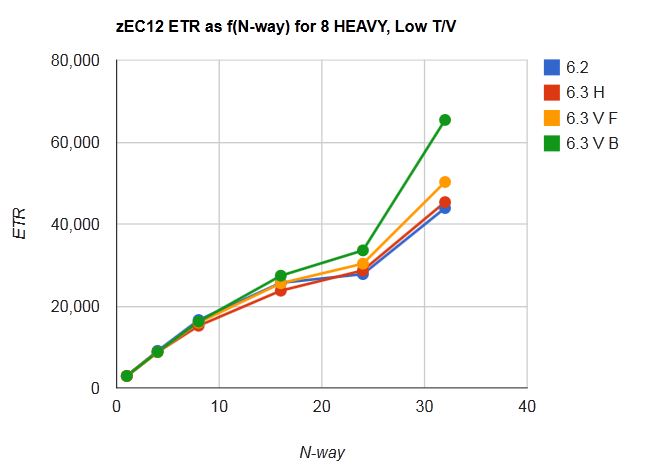
Another family is eight heavy, low-T/V tiles. Each heavy tile consists of 13 virtual CPUs that together produce 540% busy. Thus running eight of them produces 104 virtual CPUs that together attempt to draw 4320% chargeable CPU time. This workload runs with T/V of 1.00.
Figure 4 illustrates the result for this workload in a variety of N-way configurations. z/VM 6.3 had little effect on this workload until N=16. At N=16 z/VM 6.3 improved the workload by 7%. At N=24 z/VM 6.3 improved 21% over z/VM 6.2. At N=32 z/VM 6.3 improved 49% over z/VM 6.2.
| Figure 4. zEC12, 8 heavy tiles, low T/V, ETR as f(N-way), for N=1, 4, 8, 16, 24, and 32, for z/VM 6.2, z/VM 6.3 horizontal (H), z/VM 6.3 vertical reshuffle (V F), and z/VM 6.3 vertical rebalance (V B). |
|
Effect of T/V-Based Parking
The purpose of T/V-based parking is to remove MP effect from the system if it appears from T/V ratio that MP effect might be elevated.
To show the effect of T/V-based parking, IBM ran the eight light tiles, high-T/V workload on z10, at various N-way levels, on z/VM 6.2, and on z/VM 6.3 with T/V-based parking disabled, and on z/VM 6.3 with T/V-based parking strongly enabled, and on z/VM 6.3 with T/V-based parking mildly enabled.
This workload has the property that its ETR is achieved entirely in a guest CPU loop whose instruction count per transaction is extremely steady. In other words, ETR is governed entirely by factors within the CPU. Consequently, this workload serves to illustrate both the potential benefits and the possible hazards associated with T/V-based parking.
Table 1 presents the results. Comments follow.
| Table 1. Effect of CPUPAD on a High-T/V Workload. | |||||
| z/VM -> | 6.2 | 6.3 | 6.3 | 6.3 | |
| T/V-based parking -> | n/a | none | strong | weak | |
| N | CPUPAD -> | n/a | 6400% | 100% | 300% |
| 8 | Run ID | GF003930 | GF003935 | GF003940 | GF003945 |
| Unparked LPUs | 8.0 | 8.0 | 8.0 | 8.0 | |
| %Total | 766.7 | 774.6 | 775.0 | 776.4 | |
| %Guests | 549.6 | 553.8 | 553.3 | 554.4 | |
| %c-CP | 98.5 | 94.3 | 94.8 | 93.7 | |
| %nc-CP | 118.6 | 126.5 | 126.9 | 128.3 | |
| T/V ratio | 1.39 | 1.40 | 1.40 | 1.40 | |
| SRMSLOCK coll /sec | 220000 | 230000 | 231000 | 233000 | |
| SRMSLOCK spin usec /coll | 1.091 | 1.257 | 1.247 | 1.270 | |
| SRMSLOCK spin sec /sec | 0.240 | 0.289 | 0.288 | 0.296 | |
| Tx/sec | 2940 | 2899 | 2912 | 2942 | |
| %Total /tx | 0.2608 | 0.2672 | 0.2661 | 0.2639 | |
| %Guests /tx | 0.1869 | 0.1910 | 0.1900 | 0.1884 | |
| %c-CP /tx | 0.0335 | 0.0325 | 0.0326 | 0.0318 | |
| %nc-CP /tx | 0.0403 | 0.0436 | 0.0436 | 0.0436 | |
| SRMSLOCK coll /tx | 74.830 | 79.338 | 79.327 | 79.198 | |
| SRMSLOCK spin usec /tx | 81.6 | 99.7 | 98.9 | 100.6 | |
| 16 | Run ID | GF003931 | GF003936 | GF003941 | GF003946 |
| Unparked LPUs | 16.0 | 16.0 | 13.7 | 15.1 | |
| %Total | 1255.4 | 1327.5 | 1009.4 | 1084.7 | |
| %Guests | 560.1 | 563.5 | 563.7 | 566.8 | |
| %c-CP | 88.0 | 84.5 | 84.4 | 81.2 | |
| %nc-CP | 607.3 | 679.5 | 361.3 | 436.7 | |
| T/V ratio | 2.24 | 2.36 | 1.79 | 1.91 | |
| SRMSLOCK coll /sec | 282000 | 273000 | 356000 | 338000 | |
| SRMSLOCK spin usec /coll | 13.05 | 15.85 | 4.740 | 6.706 | |
| SRMSLOCK spin sec /sec | 3.68 | 4.33 | 1.69 | 2.27 | |
| Tx/sec | 3412 | 3621 | 2836 | 2981 | |
| %Total /tx | 0.3679 | 0.3666 | 0.3559 | 0.3639 | |
| %Guests /tx | 0.1642 | 0.1556 | 0.1988 | 0.1901 | |
| %c-CP /tx | 0.0258 | 0.0233 | 0.0298 | 0.0272 | |
| %nc-CP /tx | 0.1780 | 0.1877 | 0.1274 | 0.1465 | |
| SRMSLOCK coll /tx | 82.649 | 75.394 | 125.529 | 113.385 | |
| SRMSLOCK spin usec /tx | 1078 | 1194 | 595 | 760 | |
| Notes: z10, memory-rich. 8 light tiles, high T/V. z/VM 6.3 is vertical mode with reshuffle. %c-CP is chargeable CP CPU utilization, sometimes called "guest CP time". %nc-CP is nonchargeable CP CPU utilization, sometimes called "system time". | |||||
At N=8, because of the size of the workload and because of the T/V value achieved, T/V-based parking did not engage and had no effect. No engines are parked and the results do not significantly differ across the three z/VM 6.3 columns.
At N=16 the effect of T/V-based parking is seen. At strong T/V-based parking (CPUPAD 100%), compared to running with all engines unparked, nonchargeable CP CPU time was decreased by (679.5 - 361.3) or 3.18 engines' worth of power. The (4.33 - 1.69) = 2.64 engines' worth of drop in SRMSLOCK spin time accounts for the majority of the drop in nonchargeable CP CPU time. At weak T/V-based parking (CPUPAD 300%), the same two effects are seen but not as strongly as when T/V-based parking was more strict. These findings illustrate that discarding excessive MP level can increase efficiency in using CPU.
In this particular workload, though, the guests experienced decreased ETR as parking increased. Because guest path length per transaction is very steady in this workload, the increase in %Guests/tx with increased parking accounts for the drop in memory stride rate and implies that the guests experienced increasing CPI with increased parking. This makes sense because with increased parking the work was being handled on fewer L1s. If the System z CPU Measurement Facility could separate guest CPI from z/VM Control Program CPI, we would undoubtedly see a small rise in guest CPI to explain the increase in %Guests/tx.
This table demonstrates that T/V-based parking has both advantages and drawbacks. While it might indeed increase efficiency inside the z/VM Control Program, the impact on ETR will be governed by what gates the workload's throughput. When ETR is governed by some external factor, such as service time on I/O devices, T/V-based parking has the potential to improve CPU efficiency with no loss to ETR.
In other words, the table illustrates that customers must evaluate T/V-based parking using their own workloads and then decide the intensity with which to enable it.
Summary and Conclusions
IBM's experiments illustrate that z/VM HiperDispatch can help the performance of a workload when the relationship between workload size and partition size allows it.
In IBM's measurements, workloads having a high ratio of runnable virtual CPUs to logical CPUs did not show benefit. As the ratio decreased, z/VM 6.3 generally showed improvements compared to z/VM 6.2. The amount of improvement varies according to the relationship between the size of the workload and the size of the partition.
T/V-based parking has the potential to improve efficiency of
use of CPU time, but how ETR is affected is a function of the
characteristics and constraining factors in the workload.