Dedicated OSA vs. VSWITCH
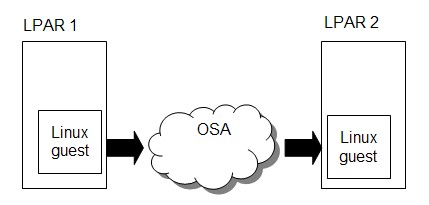
There are several connectivity options available for Linux guests running under z/VM. Two of them are direct connection to OSA and virtual switch. There are advantages to each choice. This section will show a comparison of key measurement points and list some of the reasons for choosing one over the other.
The Application Workload Modeler (AWM) product was used to drive request-response (RR) and streaming (STR) workloads over OSA cards directly attached to the Linux guests and over a virtual switch. The RR workoad consisted of the client sending 200 bytes to the server and the server responding with 1000 bytes. This interaction was repeated for 200 seconds. The STR workload consisted of the client sending 20 bytes to the server and the server responding with 20MB. This sequence was repeated for 400 seconds.
These workloads were run for both link layer (Layer 2) and IP layer (Layer 3) transport modes. Both Linux and virtual switch require specific configuration options which determine whether Layer 2 or Layer 3 is in effect.
A complete set of runs, consisting of 3 trials for each case, for 1, 10 and 50 client-server pairs, was done with the maximum transmission unit (MTU) set to 1492 (for RR and STR) and 8992 (for STR only).
The measurements were done on a 2084-324 with 2 dedicated processors in each LPAR used. Connectivity between the two LPARs was over an OSA-Express2 1GbE card. The OSA level was 0016. The software used includes:
- z/VM 5.2.0
- TCP/IP 5.2.0
- Linux SuSe SLES8 kernel levels 2.4.21-251 with qeth module dated 20041104
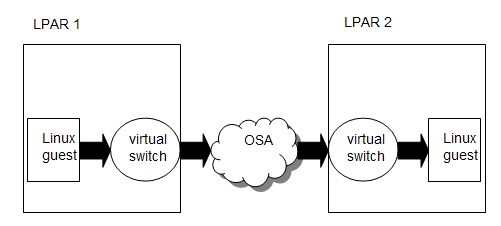
Figure 1. Virtual Switch Environment
|
|
The server Linux guest ran in LPAR 2 and the client Linux guest ran in LPAR 1. 1, 10 or 50 sessions ran in the Linux guest for each measurement. Each LPAR had 2GB of central storage and 2GB expanded storage. CP monitor data was captured for one LPAR (client side) during the measurement and reduced using Performance Toolkit for VM (Perfkit).
The following tables compare the average of 3 trials for each measurement between virtual switch and OSA for Layer3 and for Layer2. The % diff numbers shown are the percent increase (or decrease) comparing OSA to the virtual switch. For example, if the number is positive, OSA was that percent greater than virtual switch. Note that the workloads used for these measurements are atomic in nature.
In general, OSA directly connected to the Linux guest gets higher throughput and uses less CPU time than when a Linux guest is connected through a virtual switch. However, this must be balanced against advantages gained using the virtual switch, such as:
- ease of network design
- ability to share network resources (OSA card)
- management of the network including security and capabilites available to the z/VM guest on the LAN
- less storage required below z/VM's 2G line (prior to z/VM 5.2.0)
- layer 3 bridge
- less overhead than using a router stack
| Case | Layer3 | Layer3 | Layer3 | Layer2 | Layer2 | Layer2 |
| Number of clients | 01 | 10 | 50 | 01 | 10 | 50 |
| VSwitch | ||||||
| runid | vl4rn013 | vl4rn101 | vl4rn503 | vl5rn013 | vl5rn102 | vl5rn502 |
| trans/sec | 2127.32 | 13823.21 | 31914.04 | 2184.09 | 14335.22 | 32523.27 |
| Total CPU msec/trans | 0.065 | 0.043 | 0.034 | 0.063 | 0.043 | 0.034 |
| Emul CPU msec/trans | 0.026 | 0.022 | 0.020 | 0.025 | 0.022 | 0.020 |
| CP CPU msec/trans | 0.039 | 0.021 | 0.014 | 0.038 | 0.021 | 0.014 |
| OSA | ||||||
| runid | lorn0101 | lorn1001 | lorn5003 | lorn0101 | lorn1002 | lorn5003 |
| trans/sec | 2539.11 | 14341.54 | 31966.42 | 2568.81 | 14681.64 | 32793.54 |
| Total CPU msec/trans | 0.0559 | 0.0347 | 0.0245 | 0.0561 | 0.0347 | 0.0243 |
| Emul CPU msec/trans | 0.0244 | 0.0205 | 0.0187 | 0.0241 | 0.0204 | 0.0185 |
| CP CPU msec/trans | 0.0315 | 0.0142 | 0.0058 | 0.0320 | 0.0143 | 0.0058 |
| % diff | ||||||
| trans/sec | 19% | 4% | 0% | 18% | 2% | 1% |
| Total CPU msec/trans | -14% | -19% | -28% | -11% | -19% | -28% |
| Emul CPU msec/trans | -4% | -7% | -6% | -4% | -7% | -7% |
| CP CPU msec/trans | -21% | -32% | -59% | -16% | -32% | -59% |
| 2084-324; z/VM 5.2.0; TCP/IP 520; Linux SLES8 | ||||||
Throughput is higher for OSA and it takes less CPU time per transaction.
| Case | Layer3 | Layer3 | Layer3 | Layer2 | Layer2 | Layer2 |
| Number of clients | 01 | 10 | 50 | 01 | 10 | 50 |
| VSwitch | ||||||
| runid | vl4sn013 | vl4sn102 | vl4sn503 | vl5sn012 | vl5sn101 | vl5sn501 |
| MB/sec | 44.6 | 92.5 | 93.3 | 44.8 | 91.3 | 92.4 |
| Total CPU msec/MB | 7.13 | 6.98 | 6.95 | 6.97 | 6.78 | 6.80 |
| Emul CPU msec/MB | 3.27 | 3.37 | 3.39 | 3.35 | 3.43 | 3.44 |
| CP CPU msec/MB | 3.86 | 3.61 | 3.56 | 3.62 | 3.36 | 3.36 |
| OSA | ||||||
| runid | losn0102 | losn1002 | losn5001 | losn0101 | losn1001 | losn5001 |
| MB/sec | 54.5 | 112.0 | 112.0 | 54.6 | 112.0 | 112.0 |
| Total CPU msec/MB | 5.58 | 4.82 | 4.79 | 5.64 | 4.93 | 4.98 |
| Emul CPU msec/MB | 3.52 | 3.71 | 3.68 | 3.59 | 3.79 | 3.84 |
| CP CPU msec/MB | 2.06 | 1.11 | 1.11 | 2.05 | 1.14 | 1.14 |
| % diff | ||||||
| MB/sec | 22% | 21% | 20% | 22% | 23% | 21% |
| Total CPU msec/MB | -22% | -30% | -21% | -19% | -27% | -16% |
| Emul CPU msec/MB | 7% | 10% | 27% | 8% | 10% | 30% |
| CP CPU msec/MB | -47% | -69% | -68% | -43% | -66% | -65% |
| 2084-324; z/VM 5.2.0; TCP/IP 520; Linux SLES8 | ||||||
The same is true for the streaming case. Throughput is higher and CPU time per MB is less.
| Case | Layer3 | Layer3 | Layer3 | Layer2 | Layer2 | Layer2 |
| Number of clients | 01 | 10 | 50 | 01 | 10 | 50 |
| VSwitch | ||||||
| runid | vl4sj013 | vl4sj102 | vl4sj503 | vl5sj012 | vl5sj101 | vl5sj501 |
| MB/sec | 36.4 | 118.0 | 118.0 | 36.7 | 118.0 | 118.0 |
| Total CPU msec/MB | 4.18 | 4.24 | 4.56 | 3.92 | 4.10 | 4.37 |
| Emul CPU msec/MB | 1.54 | 1.75 | 1.85 | 1.53 | 1.75 | 1.80 |
| CP CPU msec/MB | 2.64 | 2.49 | 2.71 | 2.40 | 2.36 | 2.58 |
| OSA | ||||||
| runid | losj0102 | losj1002 | losj5001 | losn0102 | losn1001 | losn5001 |
| MB/sec | 64.7 | 118.0 | 118.0 | 67.3 | 118.0 | 118.0 |
| Total CPU msec/MB | 4.70 | 4.20 | 4.31 | 4.87 | 4.48 | 4.54 |
| Emul CPU msec/MB | 2.13 | 2.10 | 2.22 | 2.20 | 2.17 | 2.25 |
| CP CPU msec/MB | 2.57 | 2.10 | 2.09 | 2.68 | 2.31 | 2.29 |
| % diff | ||||||
| MB/sec | 78% | 0% | 0% | 83% | 0% | 0% |
| Total CPU msec/MB | 12% | -1% | -8% | 23% | 9% | 4% |
| Emul CPU msec/MB | 35% | 20% | 17% | 43% | 25% | 26% |
| CP CPU msec/MB | -1% | -16% | -25% | 10% | -3% | -11% |
| 2084-324; z/VM 5.2.0; TCP/IP 520; Linux SLES8 | ||||||
Except for the single client-server case, throughput is essentially the same for OSA and virtual switch when MTU is 8992. Overall, CPU time is higher for OSA. Emulation time increased for the Linux guest when connected directly to OSA, offsetting the higher CP time when going through a virtual switch. It should be noted that our throughput is limited by the OSA card when we reach 118 MB/sec.