Linux Connectivity Performance
Purpose
In this experiment we sought to compare and contrast the networking performance experienced by two Linux guests running on one instance of z/VM 4.2.0, communicating with one another over each of these communication technologies: 1
- Virtual CTC
- OSA Express Gigabit Ethernet, operating in Queued Direct I/O (QDIO) mode
- VM Guest LAN
- HiperSockets
We sought to measure the performance of these configurations under the pressure of three distinct kinds of networking workloads, with the following attendant performance metrics for each workload:
- We use the term request-response (RR) to describe data exchange like what usually happens in interactive environments -- that is, long-running transport connections with small amounts of data being exchanged in a conversational way. For this workload, "networking performance" means transactions per wall clock second and CPU time consumed per transaction.
- By connect-request-response (CRR) we mean the data exchange that usually happens with HTTP servers -- that is, a connection starts, a small amount of data flows in, a moderate amount flows out, and the connection then ends. Here, we're also interested in transactions per wall clock second and CPU time consumed per transaction.
- In a streaming get (STRG) transaction, the connection is persistent, just as in RR. However, the data sent in one direction is very small -- just a few bytes -- and the data sent in the other direction is very large -- 20 MB. This scenario illustrates the best-case rate at which the computing system can pump data across a communication link. In this environment, what interests us are megabytes per wall clock second and CPU time used per megabyte sent.
One environmental consideration that affects networking performance is the number of concurrent connections the two Linux guests are working between them. For example, efficiencies in interrupt handling might be experienced if the two guests have twenty, thirty, or fifty "file downloads" in progress between them simultaneously. We crafted our experiments so that we could assess the impact of the number of concurrent data streams on networking performance. We achieved concurrent data streams by running our benchmarking tool in multiple Linux processes simultaneously, with exactly one connection between each pair of processes. Because of this configuration, we call the number of concurrent data streams the "number of concurrent users", or more simply, just the "number of users".
One other parameter that is known to affect networking performance is a communication link's Maximum Transmission Unit size, or MTU size. This size, expressed in bytes, is the size of the largest frame the communication hardware will "put on the wire". Typical sizes range from 1,500 bytes to 56 KB. We configured our experiments so that we could assess the effect of MTU size on networking performance.
Hardware
2064-109, LPAR with two dedicated CPUs, 1 GB real, 2 GB XSTORE, LPAR dedicated to these experiments. This processor contained the microcode necessary to support HiperSockets. It was also equipped with an OSA Express Gigabit Ethernet card. The rest of the networking devices are virtualized by z/VM CP.
Software
z/VM 4.2.0, with APAR VM62938 ("the HiperSockets APAR") applied. One z/VM fix relevant to QDIO, VM63034, was also applied.
For Linux, we used an internal 2.4.7-level development driver. The qdio.o and qeth.o (HiperSockets and QDIO drivers) we used were the 2.4.7 drivers IBM made available on DeveloperWorks in early February 2002. The Linux virtual machines were 512 MB in size and were virtual uniprocessors.
To produce the network loads, we used an IBM internal tool that can induce RR, CRR, and STRG workloads for selected periods of time. The tool is able to record the transaction rates and counts it experiences during the run.
Method
We defined an experiment as a measurement run that uses a particular transaction type, communication link type, MTU size, and number of users.
For each experiment, we brought up two Linux guests, connecting them by one of the device types under study. Using ifconfig, we set the communication link's MTU size to the desired value. We then ran the network load tool, specifying the kind of workload to simulate, the number of users, and the number of seconds to run the workload. The tool runs the workload for at least the specified number of seconds, and perhaps a little longer if needed to get to the end of its sample.
To collect resource consumption information, we used before-and-after invocations of several CP QUERY commands. The network load tool produced log files that recorded the transaction rates and counts it experienced.
The following sections define the experiments we ran.
OSA Express Gigabit Ethernet in QDIO Mode:
- RR
- We defined one transaction to be 200 bytes sent from Linux A to Linux B, then 1000 bytes sent from B to A.
- We ran each experiment for 600 seconds.
- We used MTU sizes 1500 and 9000.
- We used 1, 10, 20, and 50 users.
- CRR
- We defined one transaction to be connecting from Linux A to Linux B, sending 64 bytes from A to B, sending 8192 bytes from B to A, then disconnecting.
- We ran each experiment for 600 seconds.
- We used MTU sizes 1500 and 9000.
- We used 1, 10, 20, and 50 users.
- STRG
- We defined one transaction to be sending 20 bytes from Linux A to Linux B, then sending 20 MB from B to A.
- We ran each experiment for 600 seconds.
- We used MTU sizes 1500 and 9000.
- We used 1, 10, 20, and 50 users.
HiperSockets and VM Guest LAN: Same as OSA Express Gigabit Ethernet, except we used MTU sizes 8192, 16384, 32768, and 57344 for all experiments.
Virtual CTC: Same as OSA Express Gigabit Ethernet, except we used MTU sizes 1500 and 8192 for the RR and CRR experiments, and we used MTU sizes 1500, 8192, and 32760 for the STRG experiment.
Comparisons
In this section we compare results across device types, using graphs and tables to illustrate the key findings.
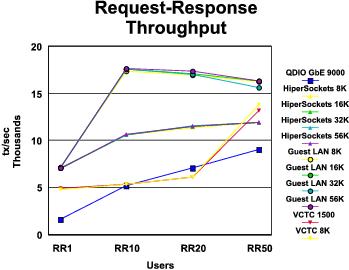
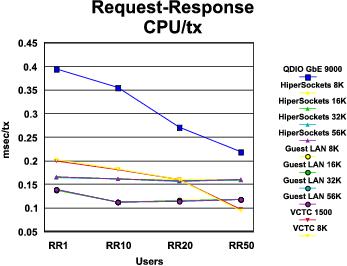
RR Performance Comparison: The graphs in Figure 1 and Figure 2 compare the results of our RR runs across all device types. A summary of key findings follows the illustrations.
 |
 |
Some comments on the graphs:
- Largely speaking, VM guest LAN showed the best transaction rate and lowest transaction cost across all MTU sizes and numbers of users. An exception was the VCTC result for RR50.
- MTU size is clearly not a factor in transaction rate or transaction cost. This makes sense because the transaction sizes we are using are smaller than the smallest MTU size we measured.
Table 1 gives more information on the best RR
results achieved on each device type.
Table 1. Maximum Throughput: Request-Response
Device type MTU size Number of clients Run ID | QDIO GBE 9000 50 NMGBR950 | HIPER 57344 50 NMHIR550 | GUEST 57344 10 NMGLR510 | vCTC 8192 50 NMVCR850 |
|---|---|---|---|---|
MB/sec trans/sec response time (msec) elapsed time (sec) | 10.39 9077.29 0.01 632.00 | 13.65 11926.76 0.00 631.00 | 20.19 17645.51 0.00 603.00 | 15.81 13812.07 0.00 625.00 |
total_LPAR_util virtual_LPAR_util CP_LPAR_util | 96.76 45.62 51.14 | 93.34 45.83 47.50 | 98.27 60.33 37.94 | 64.00 46.65 17.35 |
client_tot_LPAR_util client_virt_LPAR_util client_cp_LPAR_util | 48.40 23.16 25.24 | 47.10 23.37 23.73 | 48.98 30.11 18.87 | 31.77 23.69 8.08 |
server_tot_LPAR_util server_virt_LPAR_util server_cp_LPAR_util | 48.36 22.46 25.90 | 46.24 22.47 23.77 | 49.29 30.22 19.07 | 32.23 22.96 9.27 |
total_cpu_msec/trans total_vcpu_msec/trans total_ccpu_msec/trans | 0.22 0.10 0.12 | 0.16 0.08 0.08 | 0.11 0.07 0.04 | 0.09 0.07 0.03 |
client_cpu_msec/trans client_vcpu_msec/trans client_ccpu_msec/trans | 0.11 0.05 0.06 | 0.08 0.04 0.04 | 0.06 0.03 0.02 | 0.05 0.03 0.01 |
server_cpu_msec/trans server_vcpu_msec/trans server_ccpu_msec/trans | 0.11 0.05 0.06 | 0.08 0.04 0.04 | 0.06 0.03 0.02 | 0.05 0.03 0.01 |
| Note: 2064-109; z/VM 4.2.0 with 64-bit CP; Linux 2.4.7. Utilization numbers are percentages of the LPAR. | ||||
Some comments on the table:
- Total LPAR utilization for the Gigabit Ethernet, HiperSockets, and VM guest LAN devices is about what we expected. However, the virtual CTC case is much lower than we expected.
- Virtual CTC was cheapest in CPU time per transaction, both in virtual time and CP time, the margin in CP time per transaction being particularly notable.
- The completely virtualized devices tended to use less CP CPU time per transaction than the real devices.
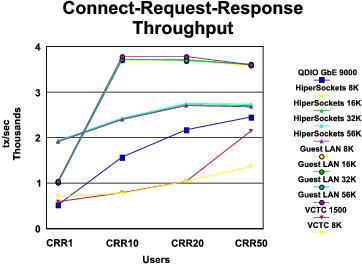
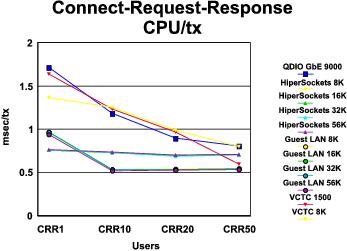
CRR Performance Comparison: The graphs in Figure 3 and Figure 4 compare the results of our CRR runs across all device types. A summary of key findings follows the illustrations.
 |
 |
Some comments on the graphs:
- VM guest LAN showed the best transaction rate and lowest transaction cost, across all MTU sizes, except for the one-user case.
- MTU size is clearly not a factor in transaction rate or transaction cost.
Table 2 gives more information on the best CRR
results achieved on each device type.
Table 2. Maximum Throughput: Connect-Request-Response
Device type MTU size Number of clients runid | QDIO GBE 9000 50 NMGBC950 | HIPER 32768 20 NMHIC320 | GUEST 57344 20 NMGLC520 | vCTC 1500 50 NMVCC150 |
|---|---|---|---|---|
MB/sec trans/sec response time (msec) elapsed time (sec) | 19.35 2457.53 0.02 631.00 | 21.67 2751.77 0.01 614.00 | 29.84 3789.82 0.01 608.00 | 16.94 2151.78 0.02 637.00 |
total_LPAR_util virtual_LPAR_util CP_LPAR_util | 97.08 47.81 49.27 | 94.48 43.76 50.73 | 99.06 59.58 39.48 | 62.07 42.92 19.14 |
client_tot_LPAR_util client_virt_LPAR_util client_CP_LPAR_util | 48.52 23.76 24.77 | 45.61 21.70 23.91 | 49.59 28.80 20.80 | 30.02 21.21 8.82 |
server_tot_LPAR_util server_virt_LPAR_util server_CP_LPAR_util | 48.56 24.06 24.50 | 48.87 22.06 26.82 | 49.47 30.79 18.68 | 32.04 21.72 10.32 |
total_cpu_msec/trans total_vcpu_msec/trans total_ccpu_msec/trans | 0.81 0.40 0.41 | 0.69 0.32 0.37 | 0.53 0.32 0.21 | 0.60 0.41 0.18 |
client_cpu_msec/trans client_vcpu_msec/trans client_ccpu_msec/trans | 0.40 0.20 0.21 | 0.33 0.16 0.18 | 0.26 0.15 0.11 | 0.29 0.20 0.08 |
server_cpu_msec/trans server_vcpu_msec/trans server_ccpu_msec/trans | 0.40 0.20 0.20 | 0.36 0.16 0.20 | 0.26 0.16 0.10 | 0.31 0.21 0.10 |
| Note: 2064-109; z/VM 4.2.0 with 64-bit CP; Linux 2.4.7. Utilization numbers are percentages of the LPAR. | ||||
Some comments on the table:
- Once again, total LPAR utilization for the Gigabit Ethernet, HiperSockets, and VM guest LAN devices is about what we expected. However, the virtual CTC case is much lower than we expected.
- Once again, the completely virtualized devices tended to use less CP CPU time per transaction than the real devices.
STRG Performance Comparison: The graphs in Figure 5 and Figure 6 compare the results of our STRG runs across all device types. A summary of key findings follows the illustrations.
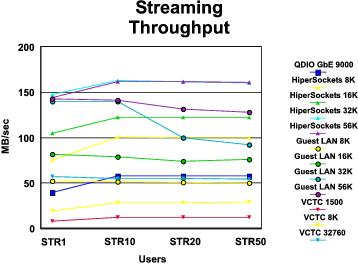 |
Figure 6. STRG CPU Consumption
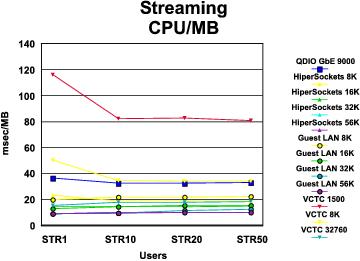 |
Some comments on the graphs:
- Every device type except VM guest LAN sustained its data rate as number of users increased.
- MTU size is clearly a factor here. Every device type "did better" (higher data rate and lower cost per MB) with a larger MTU size than with a smaller one.
- HiperSockets with large MTU (32 KB or greater) showed the best data rate. Guest LAN showed the lowest cost per MB, but its data rate was not as good.
Table 3 gives more information on the best STRG
results achieved on each device type.
Table 3. Maximum Throughput: Streaming
Device type MTU size Number of clients runid | QDIO GBE 9000 50 NMGBS950 | HIPER 32768 10 NMHIS310 | GUEST 57344 1 NMGLS501 | vCTC 32760 1 NMVCS301 |
|---|---|---|---|---|
MB/sec trans/sec response time (msec) elapsed time (sec) | 58.07 2.90 17.25 632.00 | 163.08 8.15 1.23 604.00 | 142.61 7.13 0.14 601.00 | 57.13 2.86 0.35 602.00 |
total_LPAR_util virtual_LPAR_util CP_LPAR_util | 93.57 41.00 52.57 | 81.57 50.05 31.51 | 64.57 46.17 18.40 | 44.07 24.37 19.70 |
client_tot_LPAR_util client_virt_LPAR_util client_CP_LPAR_util | 44.80 18.49 26.31 | 32.31 19.25 13.06 | 22.99 18.86 4.13 | 16.37 10.37 6.00 |
server_tot_LPAR_util server_virt_LPAR_util server_CP_LPAR_util | 48.77 22.51 26.26 | 49.26 30.80 18.45 | 41.58 27.31 14.27 | 27.70 14.00 13.70 |
total_cpu_msec/trans total_vcpu_msec/trans total_ccpu_msec/trans | 660.74 289.50 371.25 | 200.68 123.15 77.53 | 181.35 129.68 51.67 | 309.39 171.08 138.31 |
client_cpu_msec/trans client_vcpu_msec/trans client_ccpu_msec/trans | 316.38 130.58 185.80 | 79.49 47.36 32.13 | 64.57 52.98 11.59 | 114.93 72.79 42.15 |
server_cpu_msec/trans server_vcpu_msec/trans server_ccpu_msec/trans | 344.36 158.92 185.44 | 121.19 75.79 45.40 | 116.78 76.70 40.08 | 194.46 98.29 96.17 |
| Note: 2064-109; z/VM 4.2.0 with 64-bit CP; Linux 2.4.7. Utilization numbers are percentages of the LPAR. | ||||
Some comments on the table:
- The HiperSockets, VM guest LAN, and virtual CTC runs did not utilize the LPAR as much as we expected. For the HiperSockets case, the reason appears to be that the server Linux was loaded to capacity (notice its total LPAR utilization).
Other Observations
This section's tables record our observations for each device type. Along with each table we present a brief summary of the key findings it illustrates.
Table 4. Throughput and CPU Time: QDIO GbE
MTU Size | 1500 | 9000 |
|---|---|---|
Throughput (tx/sec) |
|
|
RR, 1 user RR, 10 users RR, 20 users RR, 50 users | 1661.09 5060.78 6905.31 9055.97 | 1667.89 5204.89 7088.82 9077.29 |
CRR, 1 user CRR, 10 users CRR, 20 users CRR, 50 users | 355.70 1062.42 1495.99 2105.42 | 522.23 1580.37 2169.64 2457.53 |
Throughput (MB/sec) |
|
|
STRG, 1 user STRG, 10 users STRG, 20 users STRG, 50 users | 25.40 35.76 35.25 37.18 | 39.35 57.61 57.75 58.07 |
CPU time (msec/tx) |
|
|
RR, 1 user RR, 10 users RR, 20 users RR, 50 users | 0.41 0.37 0.28 0.22 | 0.39 0.36 0.27 0.22 |
CRR, 1 user CRR, 10 users CRR, 20 users CRR, 50 users | 2.34 1.77 1.29 0.95 | 1.72 1.19 0.90 0.81 |
CPU time (msec/MB) |
|
|
STRG, 1 user STRG, 10 users STRG, 20 users STRG, 50 users | 66.24 52.09 53.46 51.79 | 36.75 32.70 32.81 33.04 |
| Note: 2064-109; z/VM 4.2.0 with 64-bit CP; Linux 2.4.7 | ||
Referring to Table 4, we see:
- The Gigabit Ethernet card gave its best RR performance for the largest number of users we measured. This is expected, because the operating systems' interactions with the adapter carry traffic for multiple users simultaneously, and the cost of these interactions is generally fixed.
- We also see that the card's best CRR performance was obtained for the largest number of users we measured. The same reasoning holds. Note also that the card's CRR performance improved under the influence of a larger MTU size. We did not expect this. We can only speculate that there is something about starting a TCP connection that benefits from an MTU size greater than 1500 bytes.
- We saw that the card's STRG performance peaked quickly, somewhere between 1 and 10 users, and stayed comparatively flat beyond that. Once again, the larger MTU size gives benefit, and this is to be expected.
Table 5. Throughput and CPU Time: Hipersockets
MTU Size | 8192 | 16384 | 32768 | 57344 |
|---|---|---|---|---|
Throughput (tx/sec) |
|
|
|
|
RR, 1 user RR, 10 users RR, 20 users RR, 50 users | 7064.64 10611.77 11350.74 11941.14 | 7050.26 10623.43 11510.30 11922.86 | 7108.46 10625.03 11579.20 11917.49 | 7040.16 10637.53 11502.21 11926.76 |
CRR, 1 user CRR, 10 users CRR, 20 users CRR, 50 users | 1933.65 2419.15 2705.89 2698.36 | 1926.13 2417.73 2716.80 2704.51 | 1937.76 2430.55 2751.77 2736.67 | 1912.99 2400.68 2705.35 2681.10 |
Throughput (MB/sec) |
|
|
|
|
STRG, 1 user STRG, 10 users STRG, 20 users STRG, 50 users | 75.31 100.54 100.28 100.18 | 105.01 122.31 122.36 122.55 | 147.88 163.08 161.75 160.67 | 144.16 161.63 161.93 160.78 |
CPU time (msec/tx) |
|
|
|
|
RR, 1 user RR, 10 users RR, 20 users RR, 50 users | 0.17 0.16 0.16 0.16 | 0.17 0.16 0.16 0.16 | 0.17 0.16 0.16 0.16 | 0.17 0.16 0.16 0.16 |
CRR, 1 user CRR, 10 users CRR, 20 users CRR, 50 users | 0.76 0.73 0.70 0.71 | 0.76 0.73 0.70 0.71 | 0.76 0.73 0.69 0.70 | 0.77 0.74 0.70 0.71 |
CPU time (msec/MB) |
|
|
|
|
STRG, 1 user STRG, 10 users STRG, 20 users STRG, 50 users | 23.11 18.84 18.93 19.11 | 14.46 14.71 14.73 14.80 | 9.16 10.03 10.12 10.24 | 9.23 10.09 10.10 10.23 |
| Note: 2064-109; z/VM 4.2.0 with 64-bit CP; Linux 2.4.7 | ||||
- RR transaction rate does not change with MTU, and it increases with number of users. This is to be expected. Notice also that the cost (CPU time) per transaction is flat with respect to MTU and number of users.
- The aforementioned trends for RR are present in the CRR results too.
- For STRG, data rate levels off somewhere between 1 and 10 users. Larger MTU size definitely helps data rate, except that beyond an MTU size of 32 KB, little if anything is gained. Number of users affects CPU per MB very little. MTU size helps CPU per MB quite a bit.
Table 6. Throughput and CPU Time: VM Guest LAN
MTU Size | 8192 | 16384 | 32768 | 57344 |
|---|---|---|---|---|
Throughput (tx/sec) |
|
|
|
|
RR, 1 user RR, 10 users RR, 20 users RR, 50 users | 7143.14 17383.95 16973.18 16260.21 | 7158.43 17616.71 17096.34 16317.72 | 7131.47 17587.34 17058.12 15657.67 | 7113.95 17645.51 17370.70 16361.98 |
CRR, 1 user CRR, 10 users CRR, 20 users CRR, 50 users | 1022.65 3696.07 3681.89 3584.21 | 1014.48 3706.91 3709.61 3605.35 | 1016.26 3720.78 3703.86 3612.12 | 1042.89 3779.70 3789.82 3605.05 |
Throughput (MB/sec) |
|
|
|
|
STRG, 1 user STRG, 10 users STRG, 20 users STRG, 50 users | 52.59 51.56 50.84 50.06 | 81.77 79.03 74.11 76.07 | 139.87 139.71 99.69 92.03 | 142.61 141.50 131.38 127.75 |
CPU time (msec/tx) |
|
|
|
|
RR, 1 user RR, 10 users RR, 20 users RR, 50 users | 0.14 0.11 0.12 0.12 | 0.14 0.11 0.11 0.12 | 0.14 0.11 0.12 0.12 | 0.14 0.11 0.11 0.12 |
CRR, 1 user CRR, 10 users CRR, 20 users CRR, 50 users | 0.96 0.54 0.54 0.55 | 0.97 0.53 0.54 0.54 | 0.97 0.53 0.54 0.54 | 0.94 0.52 0.53 0.54 |
CPU time (msec/MB) |
|
|
|
|
STRG, 1 user STRG, 10 users STRG, 20 users STRG, 50 users | 20.01 21.68 22.04 22.38 | 13.14 14.68 15.35 15.24 | 9.09 9.68 11.68 12.34 | 9.07 9.62 10.07 10.29 |
| Note: 2064-109; z/VM 4.2.0 with 64-bit CP; Linux 2.4.7 | ||||
- For RR, transaction rate is essentially invariant over MTU size. Adding users helps transaction rate, up to 10 users. We were disappointed to see the RR transaction rate start to roll off beyond 10 users. We were pleased to see that transaction cost was invariant over MTU size and stayed flat as number of users became large.
- For CRR, as in RR, MTU size had no effect. Transaction rate increased with number of users up to 10 but then started to roll off. Transaction cost initially decreased as number of users increased, but then stayed flat.
- In STRG, we saw that as users increased, data rate initially stayed flat but then rolled off significantly. Cost per MB increased slightly with number of users. This suggests that the software failed to fully utilize the LPAR when large numbers of users were involved, and in fact this is the case. We examined LPAR utilization for the guest LAN STRG runs and found that it peaked at around 55%. It is as if something unrelated to number of users stopped guest LAN from using any more of the LPAR's CPU resource. This phenomenon needs more study.
Table 7. Throughput and CPU Time: VCTC
MTU Size | 1500 | 8192 | 32760 |
|---|---|---|---|
Throughput (tx/sec) |
|
|
|
RR, 1 user RR, 10 users RR, 20 users RR, 50 users | 4901.00 5377.88 6132.52 13201.28 | 4817.30 5348.36 6130.99 13812.07 |
|
CRR, 1 user CRR, 10 users CRR, 20 users CRR, 50 users | 589.95 794.68 1038.32 2151.78 | 705.34 781.00 1040.23 1364.64 |
|
Throughput (MB/sec) |
|
|
|
STRG, 1 user STRG, 10 users STRG, 20 users STRG, 50 users | 8.26 12.10 12.03 12.42 | 18.99 28.25 28.76 29.21 | 57.13 54.85 54.78 54.64 |
CPU time (msec/tx) |
|
|
|
RR, 1 user RR, 10 users RR, 20 users RR, 50 users | 0.20 0.18 0.16 0.10 | 0.20 0.18 0.16 0.09 |
|
CRR, 1 user CRR, 10 users CRR, 20 users CRR, 50 users | 1.64 1.24 0.97 0.60 | 1.37 1.26 0.99 0.80 |
|
CPU time (msec/MB) |
|
|
|
STRG, 1 user STRG, 10 users STRG, 20 users STRG, 50 users | 116.35 82.52 82.77 80.74 | 50.33 34.72 34.38 34.12 | 15.47 17.78 17.91 18.18 |
| Note: 2064-109; z/VM 4.2.0 with 64-bit CP; Linux 2.4.7 | |||
- RR performance was not a function of MTU size, as we expected.
- CRR performance was not a function of MTU size either, except for the 50-user, MTU-8192 case, which we are unable to explain.
- STRG performance flattens out somewhere between 1 and 10 users.
Recommendations
For all but streaming workloads, use VM guest LAN. It shows the highest transaction rates and the lowest CPU cost per transaction. It also happens to be the easiest to configure.
For streaming workloads, if HiperSockets hardware is available, use it. No matter which technology you select, though, use the highest MTU size you can.
Footnotes:
- 1
- For results of similar measurements on z/VM TCP/IP, refer to HiperSockets and VM Guest LAN Support. to .