ISFC Improvements
Abstract
In z/VM 6.2 IBM shipped improvements to the Inter-System Facility for Communication (ISFC). These improvements prepared ISFC to serve as the data conveyance for relocations of running guests.
Measurements of ISFC's capabilities for guest relocation traffic studied its ability to fill a FICON chpid's fiber with data and its ability to ramp up as the hardware configuration of the logical link expanded. These measurements generally showed that ISFC uses FICON chpids fully and scales correctly with increasing logical link capacity.
Because ISFC is also the data conveyance for APPC/VM, IBM also studied z/VM 6.2's handling of APPC/VM traffic compared back to z/VM 6.1, on logical link configurations z/VM 6.1 can support. This regression study showed that z/VM 6.2 experiences data rate changes in the range of -6% to +78%, with most cases showing substantial improvement. CPU utilization per message moved changed little.
Though IBM did little in z/VM 6.2 to let APPC/VM traffic exploit multi-CTC logical links, APPC/VM workloads did show modest gains in such configurations.
Introduction
In z/VM 6.2 IBM extended the Inter-System Facility for Communication (ISFC) so that it would have the data carrying capacity needed to support guest relocations. The most visible enhancement is that a logical link can now be composed of multiple CTCs. IBM also made many internal improvements to ISFC, to let it scale to the capacities required by guest relocations.
Though performing and measuring actual guest relocations is the ultimate test, we found it appropriate also to devise experiments to measure ISFC alone. Such experiments would let us assess certain basic ISFC success criteria, such as whether ISFC could fully use a maximally configured logical link, without wondering whether execution traits of guest relocations were partially responsible for the results observed. A second and more practical concern was that devising means to measure ISFC alone let us run experiments more flexibly, more simply, and with more precise control than we could have if we had had only guest relocations at our disposal as a measurement tool.
Because ISFC was so heavily revised, we also found it appropriate to run measurements to check performance for APPC/VM workloads. Our main experiment for APPC/VM was to check that a one-CTC logical link could carry as much traffic as the previous z/VM release. Our second experiment was to study the scaling behavior of APPC/VM traffic as we added hardware to the logical link. Because we made very few changes in the APPC/VM-specific portions of ISFC, and because we had no requirement to improve APPC/VM performance in z/VM 6.2, we ran this second experiment mostly out of curiosity.
This report chapter describes the findings of all of these measurements. The chapter also offers some insight into the inner workings of ISFC and provides some guidance on ISFC logical link capacity estimation.
Background
Early in the development of z/VM 6.2, IBM did some very simple measurements to help us to understand the characteristics of FICON CTC devices. These experiments' results guided the ISFC design and taught us about the configuring and capacity of multi-CTC ISFC logical links. This section does not cite these simple measurements' specific results. Rather, it merely summarizes their teachings.
Placement of CTCs onto FICON Chpids
When we think about the relationship between FICON CTC devices and FICON CTC chpids, we realize there are several different ways we could place a set of CTCs onto a set of chpids. For example, we could place sixteen CTCs onto sixteen chpids, one CTC on each chpid. Or, we could place sixteen CTCs all onto one chpid.
In very early measurements of multi-CTC ISFC logical links, IBM tried various experiments to determine how many CTCs to put onto a chpid before performance on that chpid no longer improved, for data exchange patterns that imitated what tended to happen during guest relocations. Generally we found that for the FICON Express2 and FICON Express4 chpids we tried, putting more than four to five CTC devices onto a FICON chpid did not result in any more data moving through the logical link. In fact, with high numbers of CTCs on a chpid, performance rolled off.
Though we do not cite the measurement data here, our recommendation is that customers generally run no more than four CTCs on each chpid. This provides good utilization of the fiber capacity and stays well away from problematic configurations.
For this reason, for our own measurements we used no more than four CTCs per FICON chpid.
Traffic Scheduling and Collision Avoidance
A CTC device is a point-to-point communication link connecting two systems. Data can move in either direction, but in only one direction at a time: either side A writes and side B then hears an attention interrupt and reads, or vice-versa. A write collision is what happens when two systems both try to write into a CTC device at the same instant. Neither side's write succeeds. Both sides must recover from the I/O error and try again to write the transmission package. These collisions degrade logical link performance.
When the logical link consists of more than one CTC, ISFC uses a write scheduling algorithm designed to push data over the logical link in a fashion that balances the need to use as many CTCs as possible with the need to stay out of the way of a partner who is trying to accomplish the very same thing.
To achieve this, the two systems agree on a common enumeration scheme for the CTCs comprising the link. The agreed-upon scheme is for both sides to number the CTCs according to the real device numbers that are in use on the system whose name comes first in the alphabet. For example, if systems ALPHA and BETA are connected by three CTCs, the two systems would agree to use ALPHA's device numbers to place the CTCs into an order on which they agree, because ALPHA comes before BETA in the alphabet.
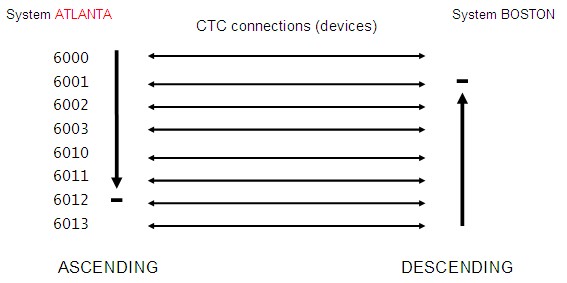
The write scheduling scheme uses the agreed-upon ordering to avoid collisions. When ALPHA needs a CTC for writing, it scans the logical link's device list lowest to highest, looking for one on which an I/O is not in progress. System BETA does similarly, but it scans highest to lowest. When there are enough CTCs to handle the traffic, this scheme will generally avoid collisions. Further, when traffic is asymmetric, this scheme allows the heavily transmitting partner to take control of the majority of the CTCs.
The write scheduling technique also contains provision for one side never to take complete control of all of the CTCs. Rather, the scan always stops short of using the whole device list, as follows:
| Number of CTCs in Logical Link | Write Scheduling Stop-Short Behavior |
|---|---|
| 1-8 CTCs | Scan stops 1 short |
| 9-16 CTCs | Scan stops 2 short |
The stop-short provision guarantees each side that the first one or two devices in its scan will never incur a write collision.
The figure below illustrates the write scheduling scheme for the case of two systems named ATLANTA and BOSTON connected by eight CTCs. The device numbers for ATLANTA are the relevant ones, because ATLANTA alphabetizes ahead of BOSTON. The ATLANTA side scans lowest to highest, while the BOSTON side scans highest to lowest. Each side stops one short.
|
Understanding the write scheduling scheme is important to understanding CTC device utilization statistics. For example, in a heavily asymmetric workload running over a sixteen-CTC link, we would expect to see only fourteen of the devices really busy, because the last two aren't scanned. Further, in going from eight to ten RDEVs, each side's scan gains only one in depth, because for 10 RDEVs we stop two short instead of one.
Understanding the write scheduling scheme is also important if one must build up a logical link out of an assortment of FICON chpid speeds. Generally, customers will want the logical link to exhibit symmetric performance, that is, the link works as well relocating guests from ALPHA to BETA as it does from BETA to ALPHA. Achieving this means paying close attention to how the CTC device numbers are placed onto chpids on the ALPHA side. When there are a number of fast chpids and one or two slow ones, placing the faster chpids on the extremes of ALPHA's list and the slower chpids in the middle of ALPHA's list will give best results. This arrangement gives both ALPHA and BETA a chance to use fast chpids first and then resort to the slower chpids only when the fast CTCs are all busy. For similar reasons, if there is only one fast chpid and the rest are slow ones, put the fast chpid into the middle of ALPHA's device number sequence.
Because understanding the write scheduling scheme is so important, and because the write scheduling scheme is intimately related to device numbers, the QUERY ISLINK command shows the device numbers in use on both the issuer's side and on the partner's side. Here is an example; notice that for each CTC, the Remote link device clause tells what the device number is on the other end of the link:
Once again, remember that the only device numbers that are important in understanding write scheduling are the device numbers in use on the system whose name comes first in the alphabet.
Estimating the Capacity of an ISFC Logical Link
When we do capacity planning for an ISFC logical link, we usually think about wanting to estimate how well the link will do in servicing guest relocations. Guest relocation workloads' data exchange habits are very asymmetric, that is, they heavily stream data from source system to destination system and have a very light acknowledgement stream flowing in the other direction. Thus it makes sense to talk about estimating the one-way capacity of the logical link.
Roughly speaking, our early experiments revealed that a good rule of thumb for estimating the maximum one-way data rate achievable on a FICON ExpressN CTC chpid at the size of messages tended to be exchanged in a guest relocation is roughly to take the chpid fiber speed in megabits (Mb) per second, divide by 10, and then multiply by about 0.85. The resultant number is in units of megabytes per second, or MB/s. For example, a FICON Express4 chpid's fiber runs at 4 gigabits per second, or 4 Gb/s. The chpid's estimated maximal data carrying capacity in one direction in MB/s will tend to be about (4096 / 10 * 0.85) or about 350 MB/sec. Using this rough estimating technique, we can build the following table:
| FICON Adapter Generation | Rough Estimate of One-Way Capacity in Guest Relocation Workloads |
|---|---|
| FICON Express | 87 MB/sec |
| FICON Express2 | 175 MB/sec |
| FICON Express4 | 350 MB/sec |
| FICON Express8 | 700 MB/sec |
To estimate the maximum one-way capacity of an ISFC logical link, we just add up the capacities of the chpids, prorating downward for chpids using fewer than four CTCs.
As we form our estimate of the link's one-way capacity, we must also keep in mind the stop-short property of the write scheduling algorithm. For example, a logical link composed of twelve CTC devices spread evenly over three equal-speed chpids will really have only ten CTCs or about 2-1/2 chpids' worth of capacity available to it for streaming a relocation to the other side. Estimates of logical link capacity must take this into account.
For our particular measurement configuration, this basic approach to logical link capacity estimation gives us the following table for the estimated one-way capacity of this measurement suite's particular ISFC logical link hardware:
| Our CTC RDEVs | Total Number of CTCs | Max Number of CTCs Used in Streaming | Distribution over Chpids | Estimated One-Way Capacity (MB/sec) |
|---|---|---|---|---|
| 6000 | 1 | Less than 1 | Less than 1/4 of an Express2 | 20 |
| 6000-6003 | 4 | 3 | 3/4 of an Express2 | 131 |
| 6000-6003, 6020-6023 |
8 | 7 | 7/4 of an Express2 | 306 |
| 6000-6003, 6020-6023, 6040-6041 |
10 | 8 | 8/4 of an Express2 | 350 |
| 6000-6003, 6020-6023, 6040-6043 |
12 | 10 | 8/4 of an Express2 2/4 of an Express4 |
525 |
| 6000-6003, 6020-6023, 6040-6043, 6060-6061 |
14 | 12 | 8/4 of an Express2 4/4 of an Express4 |
700 |
| 6000-6003, 6020-6023, 6040-6043, 6060-6063 |
16 | 14 | 8/4 of an Express2 6/4 of an Express4 |
875 |
Customers using other logical link configurations will be able to use this basic technique to build their own estimation tables.
It was our experience that our actual measurements tended to do better than these estimates.
Of course, a set of FICON CTCs acting together will be able to service workloads moving appreciable data in both directions. However, because LGR workloads are not particularly symmetric, we did not comprehensively study the behavior of an ISFC logical link when each of the two systems tries to put appreciable transmit load onto the link. We did run one set of workloads that evaluated a moderate intensity, symmetric data exchange scenario. We did this mostly to check that the two systems could exchange data without significantly interfering with one another.
Method
To measure ISFC's behavior, we used the ISFC workloads described in the appendix of this report. The appendix describes the CECs used, the partition configurations, and the FICON chpids used to connect the partitions. This basic hardware setup remained constant through all measurements.
The appendix also describes the choices we made for the numbers of concurrent connections, the sizes of messages exchanged, and the numbers of CTCs comprising the logical link. We varied these choices through their respective spectra as described in the appendix.
A given measurement consisted of a selected number of connections, exchanging messages of a selected size, using an ISFC logical link of a selected configuration. For example, an APPC/VM measurement might consist of 50 client-server pairs running the CDU/CDR tool, using server reply size of 5000 bytes, running over an ISFC logical link that used only the first four CTC devices of our configuration.
We ran each experiment for five minutes, with CP Monitor set to one-minute sample intervals. We collected MONWRITE data on each side.
When all measurements were complete, we reduced the MONWRITE data with a combination of Performance Toolkit for VM and some homegrown Rexx execs that analyzed Monitor records directly.
Metrics of primary interest were data rate, CPU time per unit of data moved, and CTC device-busy percentage.
For multi-CTC logical links, we were also interested in whether ISFC succeeded in avoiding simultaneous writes into the two ends of a given CTC device. This phenomenon, called a write collision, can debilitate the logical link. ISFC contains logic to schedule CTC writes in such a way that the two systems will avoid these collisions almost all of the time. We looked at measurements' collision data to make sure the write scheduling logic worked properly.
Results and Discussion
ISFC Transport Traffic
For convenience of presentation, we organized the result tables by message size, one table per message size. The set of runs done for a specific message size is called a suite. Each suite's table presents its results. The row indices are the number of CTCs in the logical link. The column indices are the number of concurrent conversations.
Within a given suite we expected, and generally found, the following traits:
- With a given number of client-server pairs, adding CTCs would generally increase data rate until it peaked, and beyond that, adding even more CTCs would not appreciably harm the workload in data rate nor in CPU utilization per message.
- With a given number of CTCs, adding client-server pairs would generally increase the data rate until a peak, and beyond that, adding even more client-server pairs would not increase data rate.
- High write-collision rates for the one-CTC cases.
- Reduced write-collision rates for the multi-CTC cases.
We also expected to see that the larger the messages, the better ISFC would do at filling the pipe. We expected this because we knew that in making its ISFC design choices, IBM tended to use schemes, algorithms, and data structures that would favor high-volume traffic consisting of fairly large messages.
For the largest messages, we expected and generally found that ISFC would keep the write CTCs nearly 100% busy and would fill the logical link to fiber capacity.
Small Messages
| HS 512/8192, 20%, 2048 |
2011-10-14 | Pairs | ||||||||||||||||||||||||||||||||||
| RDEVs | Metrics | 1 | 5 | 10 | 50 | 100 | ||||||||||||||||||||||||||||||
| 1 |
|
|
|
|
|
|
||||||||||||||||||||||||||||||
| 4 |
|
|
|
|
|
|
||||||||||||||||||||||||||||||
| 8 |
|
|
|
|
|
|
||||||||||||||||||||||||||||||
| 10 |
|
|
|
|
|
|
||||||||||||||||||||||||||||||
| 12 |
|
|
|
|
|
|
||||||||||||||||||||||||||||||
| 14 |
|
|
|
|
|
|
||||||||||||||||||||||||||||||
| 16 |
|
|
|
|
|
|
||||||||||||||||||||||||||||||
| Notes: z10, 2097-E56, mci 754, two dedicated partitions, client 3-way, server 12-way, both 43G/2G. Mixed FICON: 6000-6003 2 Gb/s, 6020-6023 2 Gb/s, 6040-6043 4 Gb/s, 6060-6063 4 Gb/s. LGC/LGS workload driver. W0A13 of 2011-10-13, stand-in for W0GOLDEN. Data rate includes traffic in both directions. | ||||||||||||||||||||||||||||||||||||
Medium Messages
| HM 8192/32768, 20%, 4096 |
2011-10-14 | Pairs | ||||||||||||||||||||||||||||||||||
| RDEVs | Metrics | 1 | 5 | 10 | 50 | 100 | ||||||||||||||||||||||||||||||
| 1 |
|
|
|
|
|
|
||||||||||||||||||||||||||||||
| 4 |
|
|
|
|
|
|
||||||||||||||||||||||||||||||
| 8 |
|
|
|
|
|
|
||||||||||||||||||||||||||||||
| 10 |
|
|
|
|
|
|
||||||||||||||||||||||||||||||
| 12 |
|
|
|
|
|
|
||||||||||||||||||||||||||||||
| 14 |
|
|
|
|
|
|
||||||||||||||||||||||||||||||
| 16 |
|
|
|
|
|
|
||||||||||||||||||||||||||||||
| Notes: z10, 2097-E56, mci 754, two dedicated partitions, client 3-way, server 12-way, both 43G/2G. Mixed FICON: 6000-6003 2 Gb/s, 6020-6023 2 Gb/s, 6040-6043 4 Gb/s, 6060-6063 4 Gb/s. LGC/LGS workload driver. W0A13 of 2011-10-13, stand-in for W0GOLDEN. Data rate includes traffic in both directions. | ||||||||||||||||||||||||||||||||||||
Large (LGR-sized) Messages
| HL 98304/122880, 20%, 8192 |
2011-10-14 | Pairs | ||||||||||||||||||||||||||||||||||
| RDEVs | Metrics | 1 | 5 | 10 | 50 | 100 | ||||||||||||||||||||||||||||||
| 1 |
|
|
|
|
|
|
||||||||||||||||||||||||||||||
| 4 |
|
|
|
|
|
|
||||||||||||||||||||||||||||||
| 8 |
|
|
|
|
|
|
||||||||||||||||||||||||||||||
| 10 |
|
|
|
|
|
|
||||||||||||||||||||||||||||||
| 12 |
|
|
|
|
|
|
||||||||||||||||||||||||||||||
| 14 |
|
|
|
|
|
|
||||||||||||||||||||||||||||||
| 16 |
|
|
|
|
|
|
||||||||||||||||||||||||||||||
| Notes: z10, 2097-E56, mci 754, two dedicated partitions, client 3-way, server 12-way, both 43G/2G. Mixed FICON: 6000-6003 2 Gb/s, 6020-6023 2 Gb/s, 6040-6043 4 Gb/s, 6060-6063 4 Gb/s. LGC/LGS workload driver. W0A13 of 2011-10-13, stand-in for W0GOLDEN. Data rate includes traffic in both directions. | ||||||||||||||||||||||||||||||||||||
Symmetric 32 KB Traffic
| HY 32768/32768, 20%, 32768 |
2011-10-14 | Pairs | ||||||||||||||||||||||||||||||||||
| RDEVs | Metrics | 1 | 5 | 10 | 50 | 100 | ||||||||||||||||||||||||||||||
| 1 |
|
|
|
|
|
|
||||||||||||||||||||||||||||||
| 4 |
|
|
|
|
|
|
||||||||||||||||||||||||||||||
| 8 |
|
|
|
|
|
|
||||||||||||||||||||||||||||||
| 10 |
|
|
|
|
|
|
||||||||||||||||||||||||||||||
| 12 |
|
|
|
|
|
|
||||||||||||||||||||||||||||||
| 14 |
|
|
|
|
|
|
||||||||||||||||||||||||||||||
| 16 |
|
|
|
|
|
|
||||||||||||||||||||||||||||||
| Notes: z10, 2097-E56, mci 754, two dedicated partitions, client 3-way, server 12-way, both 43G/2G. Mixed FICON: 6000-6003 2 Gb/s, 6020-6023 2 Gb/s, 6040-6043 4 Gb/s, 6060-6063 4 Gb/s. LGC/LGS workload driver. W0A13 of 2011-10-13, stand-in for W0GOLDEN. Data rate includes traffic in both directions. | ||||||||||||||||||||||||||||||||||||
One Measurement In Detail
So as to illustrate what really happens on an ISFC logical link, let's take a look at one experiment in more detail.
The experiment we will choose is H001709C. This is a large-message experiment using 50 concurrent conversations and 12 CTCs in the logical link. Devices 6000-6003 and 6020-6023 are FICON Express2. Devices 6040-6043 are FICON Express4. Devices 6060-6063 are in the IOCDS but are unused in this particular experiment.
Here's a massaged excerpt from the Performance Toolkit FCX108 DEVICE report, showing the device utilization on the client side. It's evident that the client is keeping ten CTCs busy in pushing the traffic to the server. This is consistent with the CTC write scheduling algorithm. It's also evident that devices 6040-6043 are on a faster chpid. Finally, we see that the server is using device 6043 to send the comparatively light acknowledgement traffic back to the client. Device 6042 is very seldom used, and from our knowledge of the write scheduling algorithm, we know it carries only acknowledgement traffic.
A homegrown tool predating Performance Toolkit for VM's ISFLACT report shows us a good view of the logical link performance from the client side. The tool uses the D9 R4 MRISFNOD logical link activity records to report on logical link statistics. The tool output excerpt below shows all of the following:
- The client's transmission-pending queue is not severely deep.
- No write collisions are happening.
- The link is carrying about 660 MB/sec to the server.
- Each client-to-server link package, written with one SSCH, carries about seven API messages totalling about 829,000 bytes.
- The link is carrying about 46 MB/sec to the client.
- Each server-to-client link package, also written with one SSCH, carries about 25 API messages totalling about 205,000 bytes.
APPC/VM Regression
For these measurements our objective was to compare z/VM 6.2 to z/VM 6.1, using an ISFC logical link of one CTC, with a variety of message sizes and client-server pairs. We measured server replies per second and CPU utilization per reply. The tables below show the results.
Generally z/VM 6.2 showed substantial improvements in server replies per second. A few anomalies were observed. Generally z/VM 6.2 showed small percentage gains in CPU consumption per message moved. These gains are not alarming because the CDU/CDR suite spends almost no CPU time in the guests. In customer environments, guest CPU time will be substantial and so small changes in CP CPU time will likely be negligible.
Runs 60* are z/VM 6.1 driver 61TOP908, which is z/VM 6.1 plus all corrective service as of September 8, 2010.
Runs W0* are z/VM 6.2 driver W0A13, which is z/VM 6.2 as of October 13, 2011.
| Reply size 1 | |||
| Pairs | Run name | Msgs/sec | %CPU/Msg |
| 1 | 6000899S | 1113.84 | 0.0040 |
| 1 | W000934S | 1421.68 | 0.0039 |
| - | Delta | 307.84 | -0.0001 |
| - | PctDelta | 27.64 | -2.50 |
| 5 | 6000906S | 2347.28 | 0.0029 |
| 5 | W000941S | 3342.56 | 0.0031 |
| - | Delta | 995.28 | 0.0002 |
| - | PctDelta | 42.40 | 6.90 |
| 10 | 6000913S | 4305.60 | 0.0026 |
| 10 | W000948S | 6066.32 | 0.0027 |
| - | Delta | 1760.72 | 0.0001 |
| - | PctDelta | 40.89 | 3.85 |
| 50 | 6000920S | 8557.12 | 0.0024 |
| 50 | W000955S | 11596.0 | 0.0025 |
| - | Delta | 3038.88 | 0.0001 |
| - | PctDelta | 35.51 | 4.17 |
| 100 | 6000927S | 8344.96 | 0.0024 |
| 100 | W000962S | 12771.2 | 0.0025 |
| - | Delta | 4426.24 | 0.0001 |
| - | PctDelta | 53.04 | 4.17 |
| Notes: z10, 2097-E56, mci 754, two partitions, one 3-way and one 12-way, both 43G/2G. One FICON CTC on a 2 Gb/s chpid. CDR/CDU workload driver. 61TOP908 of 2010-09-08. W0A13 of 2011-10-13, stand-in for W0GOLDEN. Message rate is replies sent from server to client. Statistics collected on server side. | |||
| Reply size 1000 | |||
| Pairs | Run name | Msgs/sec | %CPU/Msg |
| 1 | 6000900S | 1110.72 | 0.0040 |
| 1 | W000935S | 1398.80 | 0.0040 |
| - | Delta | 288.08 | 0 |
| - | PctDelta | 25.94 | 0.00 |
| 5 | 6000907S | 2322.32 | 0.0029 |
| 5 | W000942S | 3149.12 | 0.0032 |
| - | Delta | 826.80 | 0.0003 |
| - | PctDelta | 35.60 | 10.34 |
| 10 | 6000914S | 4308.72 | 0.0026 |
| 10 | W000949S | 5676.32 | 0.0028 |
| - | Delta | 1367.60 | 0.0002 |
| - | PctDelta | 31.74 | 7.69 |
| 50 | 6000921S | 8426.08 | 0.0024 |
| 50 | W000956S | 8410.48 | 0.0026 |
| - | Delta | -15.60 | 0.0002 |
| - | PctDelta | -0.19 | 8.33 |
| 100 | 6000928S | 8309.60 | 0.0024 |
| 100 | W000963S | 8712.08 | 0.0026 |
| - | Delta | 402.48 | 0.0002 |
| - | PctDelta | 4.84 | 8.33 |
| Notes: z10, 2097-E56, mci 754, two partitions, one 3-way and one 12-way, both 43G/2G. One FICON CTC on a 2 Gb/s chpid. CDR/CDU workload driver. 61TOP908 of 2010-09-08. W0A13 of 2011-10-13, stand-in for W0GOLDEN. Message rate is replies sent from server to client. Statistics collected on server side. | |||
| Reply size 5000 | |||
| Pairs | Run name | Msgs/sec | %CPU/Msg |
| 1 | 6000901S | 1025.232 | 0.0043 |
| 1 | W000936S | 1294.80 | 0.0043 |
| - | Delta | 269.568 | 0 |
| - | PctDelta | 26.29 | 0.00 |
| 5 | 6000908S | 2110.16 | 0.0032 |
| 5 | W000943S | 2422.16 | 0.0035 |
| - | Delta | 312.00 | 0.0003 |
| - | PctDelta | 14.79 | 9.38 |
| 10 | 6000915S | 3546.40 | 0.0029 |
| 10 | W000950S | 4291.04 | 0.0031 |
| - | Delta | 744.64 | 0.0002 |
| - | PctDelta | 21.00 | 6.90 |
| 50 | 6000922S | 5315.44 | 0.0028 |
| 50 | W000957S | 6494.80 | 0.0029 |
| - | Delta | 1179.36 | 0.0001 |
| - | PctDelta | 22.19 | 3.57 |
| 100 | 6000929S | 5441.28 | 0.0028 |
| 100 | W000964S | 5150.08 | 0.0032 |
| - | Delta | -291.20 | 0.0004 |
| - | PctDelta | -5.35 | 14.29 |
| Notes: z10, 2097-E56, mci 754, two partitions, one 3-way and one 12-way, both 43G/2G. One FICON CTC on a 2 Gb/s chpid. CDR/CDU workload driver. 61TOP908 of 2010-09-08. W0A13 of 2011-10-13, stand-in for W0GOLDEN. Statistics collected on server side. | |||
| Reply size 10000 | |||
| Pairs | Run name | Msgs/sec | %CPU/Msg |
| 1 | 6000902S | 973.128 | 0.0045 |
| 1 | W000937S | 1214.72 | 0.0049 |
| - | Delta | 241.592 | 0.0004 |
| - | PctDelta | 24.83 | 8.89 |
| 5 | 6000909S | 1901.12 | 0.0036 |
| 5 | W000944S | 2280.72 | 0.0039 |
| - | Delta | 379.60 | 0.0003 |
| - | PctDelta | 19.97 | 8.33 |
| 10 | 6000916S | 3176.16 | 0.0033 |
| 10 | W000951S | 3895.84 | 0.0033 |
| - | Delta | 719.68 | 0 |
| - | PctDelta | 22.66 | 0.00 |
| 50 | 6000923S | 2714.40 | 0.0034 |
| 50 | W000958S | 3255.20 | 0.0034 |
| - | Delta | 540.80 | 0 |
| - | PctDelta | 19.92 | 0.00 |
| 100 | 6000930S | 3548.48 | 0.0042 |
| 100 | W000965S | 3947.84 | 0.0042 |
| - | Delta | 399.36 | 0 |
| - | PctDelta | 11.25 | 0.00 |
| Notes: z10, 2097-E56, mci 754, two partitions, one 3-way and one 12-way, both 43G/2G. One FICON CTC on a 2 Gb/s chpid. CDR/CDU workload driver. 61TOP908 of 2010-09-08. W0A13 of 2011-10-13, stand-in for W0GOLDEN. Message rate is replies sent from server to client. Statistics collected on server side. | |||
| Reply size 50000 | |||
| Pairs | Run name | Msgs/sec | %CPU/Msg |
| 1 | 6000903S | 559.936 | 0.0086 |
| 1 | W000938S | 524.576 | 0.0092 |
| - | Delta | -35.360 | 0.0006 |
| - | PctDelta | -6.32 | 6.98 |
| 5 | 6000910S | 843.232 | 0.0076 |
| 5 | W000945S | 1023.464 | 0.0070 |
| - | Delta | 180.232 | -0.0006 |
| - | PctDelta | 21.37 | -7.89 |
| 10 | 6000917S | 996.216 | 0.0072 |
| 10 | W000952S | 1491.36 | 0.0064 |
| - | Delta | 495.144 | -0.0008 |
| - | PctDelta | 49.70 | -11.11 |
| 50 | 6000924S | 694.304 | 0.0127 |
| 50 | W000959S | 1219.92 | 0.0125 |
| - | Delta | 525.616 | -0.0002 |
| - | PctDelta | 75.70 | -1.57 |
| 100 | 6000931S | 908.856 | 0.0141 |
| 100 | W000966S | 1536.08 | 0.0133 |
| - | Delta | 627.224 | -0.0008 |
| - | PctDelta | 69.01 | -5.67 |
| Notes: z10, 2097-E56, mci 754, two partitions, one 3-way and one 12-way, both 43G/2G. One FICON CTC on a 2 Gb/s chpid. CDR/CDU workload driver. W0A13 of 2011-10-13, stand-in for W0GOLDEN. Message rate is replies sent from server to client. Statistics collected on server side. | |||
| Reply size 100000 | |||
| Pairs | Run name | Msgs/sec | %CPU/Msg |
| 1 | 6000904S | 343.408 | 0.0140 |
| 1 | W000939S | 342.784 | 0.0140 |
| - | Delta | -0.624 | 0 |
| - | PctDelta | -0.18 | 0.00 |
| 5 | 6000911S | 495.768 | 0.0121 |
| 5 | W000946S | 674.336 | 0.0113 |
| - | Delta | 178.568 | -0.0008 |
| - | PctDelta | 36.02 | -6.61 |
| 10 | 6000918S | 308.880 | 0.0142 |
| 10 | W000953S | 386.360 | 0.0145 |
| - | Delta | 77.480 | 0.0003 |
| - | PctDelta | 25.08 | 2.11 |
| 50 | 6000925S | 402.480 | 0.0239 |
| 50 | W000960S | 678.184 | 0.0230 |
| - | Delta | 275.704 | -0.0009 |
| - | PctDelta | 68.50 | -3.77 |
| 100 | 6000932S | 497.328 | 0.0265 |
| 100 | W000967S | 862.056 | 0.0251 |
| - | Delta | 364.728 | -0.0014 |
| - | PctDelta | 73.34 | -5.28 |
| Notes: z10, 2097-E56, mci 754, two partitions, one 3-way and one 12-way, both 43G/2G. One FICON CTC on a 2 Gb/s chpid. CDR/CDU workload driver. 61TOP908 of 2010-09-08. W0A13 of 2011-10-13, stand-in for W0GOLDEN. Message rate is replies sent from server to client. Statistics collected on server side. | |||
| Reply size 1000000 | |||
| Pairs | Run name | Msgs/sec | %CPU/Msg |
| 1 | 6000905S | 39.936 | 0.1202 |
| 1 | W000940S | 40.248 | 0.1193 |
| - | Delta | 0.312 | -0.0009 |
| - | PctDelta | 0.78 | -0.75 |
| 5 | 6000912S | 55.328 | 0.1084 |
| 5 | W000947S | 84.344 | 0.0948 |
| - | Delta | 29.016 | -0.0136 |
| - | PctDelta | 52.44 | -12.55 |
| 10 | 6000919S | 28.184 | 0.1703 |
| 10 | W000954S | 42.848 | 0.1494 |
| - | Delta | 14.664 | -0.0209 |
| - | PctDelta | 52.03 | -12.27 |
| 50 | 6000926S | 46.904 | 0.2558 |
| 50 | W000961S | 77.584 | 0.2526 |
| - | Delta | 30.680 | -0.0032 |
| - | PctDelta | 65.41 | -1.25 |
| 100 | 6000933S | 55.744 | 0.2727 |
| 100 | W000968S | 99.216 | 0.2661 |
| - | Delta | 43.472 | -0.0066 |
| - | PctDelta | 77.99 | -2.42 |
| Notes: z10, 2097-E56, mci 754, two partitions, one 3-way and one 12-way, both 43G/2G. One FICON CTC on a 2 Gb/s chpid. CDR/CDU workload driver. 61TOP908 of 2010-09-08. W0A13 of 2011-10-13, stand-in for W0GOLDEN. Message rate is replies sent from server to client. Statistics collected on server side. | |||
APPC/VM Scaling
When IBM improved ISFC for z/VM 6.2, its objective was to create a data transport service suitable for use in relocating guests. Low-level ISFC drivers were rewritten to pack messages well, to use multiple CTCs, and the like. Further, new higher layers of ISFC were created so as to offer a new data exchange API to other parts of the Control Program.
As part of the ISFC effort, IBM made little to no effort to improve APPC/VM performance per se. For example, locking and serialization limits known to exist in the APPC/VM-specific portions of ISFC were not relieved.
Because of this, IBM expected some APPC/VM scaling for multi-CTC logical links, but the behavior was expected to be modest at best. Mostly out of curiosity, we ran the CDU/CDR workloads on a variety of multi-CTC logical links, to see what would happen.
We found APPC/VM traffic did scale, but not as well as ISFC Transport traffic did. For example, the largest-configuration APPC/VM measurement, W001054C, achieved [ (1000000 * 199.78) / 1024 / 1024 ] = 190 MB/sec in reply messages from server to client over our sixteen-RDEV setup. By contrast, the largest-configuration ISFC Transport measurement, H001750C, achieved 964 MB/sec client-to-server (not tabulated) on the very same logical link.
The tables below capture the results.
| Reply size 1 | Pairs | |||
| RDEVs | Metrics | 1 | 50 | 100 |
| 1 | Run Msgs/sec %CPU/msg RDEV util |
W000995C 1414.0 0.0040 60.00 |
W000999C 11356.2 0.0021 48.00 |
W001003C 12615.2 0.0022 46.00 |
| 4 | Run Msgs/sec %CPU/msg RDEV util |
W001007C 1412.0 0.0037 60.00 |
W001011C 28890.0 0.0019 127.00 |
W001015C 45905.6 0.0019 158.00 |
| 8 | Run Msgs/sec %CPU/msg RDEV util |
W001019C 1413.0 0.0037 45.00 |
W001023C 29160.0 0.0019 114.00 |
W001027C 45697.6 0.0019 122.00 |
| 12 | Run Msgs/sec %CPU/msg RDEV util |
W001031C 1458.5 0.0038 46.00 |
W001035C 30655.8 0.0019 120.00 |
W001039C 42130.4 0.0019 121.00 |
| 16 | Run Msgs/sec %CPU/msg RDEV util |
W001043C 1435.0 0.0045 45.00 |
W001047C 30078.0 0.0021 118.00 |
W001051C 41787.2 0.0019 119.00 |
| Notes: z10, 2097-E56, mci 754, two partitions, one 3-way and one 12-way, both 43G/2G. FICON CTCs as in appendix. CDR/CDU workload driver. W0A13 of 2011-10-13, stand-in for W0GOLDEN. Message rate is replies sent from server to client. Statistics from client side. | ||||
| Reply size 10000 | Pairs | |||
| RDEVs | Metrics | 1 | 50 | 100 |
| 1 | Run Msgs/sec %CPU/msg RDEV util |
W000998C 40.485 0.1383 47.00 |
W001002C 74.790 0.1872 46.00 |
W001006C 97.760 0.1800 55.00 |
| 4 | Run Msgs/sec %CPU/msg RDEV util |
W001010C 40.285 0.1390 66.00 |
W001014C 92.178 0.2300 109.00 |
W001018C 156.416 0.2276 204.00 |
| 8 | Run Msgs/sec %CPU/msg RDEV util |
W001022C 40.985 0.1464 67.00 |
W001026C 91.638 0.2357 120.00 |
W001030C 162.968 0.2454 216.00 |
| 12 | Run Msgs/sec %CPU/msg RDEV util |
W001034C 46.185 0.1386 54.00 |
W001038C 119.286 0.2247 84.00 |
W001042C 195.000 0.2338 156.00 |
| 16 | Run Msgs/sec %CPU/msg RDEV util |
W001046C 45.565 0.1492 54.00 |
W001050C 121.608 0.2270 83.00 |
W001054C 199.784 0.2483 160.00 |
| Notes: z10, 2097-E56, mci 754, two partitions, one 3-way and one 12-way, both 43G/2G. FICON CTCs as in appendix. CDR/CDU workload driver. W0A13 of 2011-10-13, stand-in for W0GOLDEN. Message rate is replies sent from server to client. Statistics from client side. | ||||
| Reply size 100000 | Pairs | |||
| RDEVs | Metrics | 1 | 50 | 100 |
| 1 | Run Msgs/sec %CPU/msg RDEV util |
W000997C 342.70 0.0163 49.00 |
W001001C 698.76 0.0166 47.00 |
W001005C 860.184 0.0167 62.00 |
| 4 | Run Msgs/sec %CPU/msg RDEV util |
W001009C 342.75 0.0163 66.00 |
W001013C 957.42 0.0188 108.00 |
W001017C 1466.40 0.0199 195.00 |
| 8 | Run Msgs/sec %CPU/msg RDEV util |
W001021C 348.50 0.0161 50.00 |
W001025C 971.46 0.0202 122.00 |
W001029C 1607.84 0.0214 219.00 |
| 12 | Run Msgs/sec %CPU/msg RDEV util |
W001033C 386.80 0.0165 54.00 |
W001037C 1084.32 0.0196 77.00 |
W001041C 1806.48 0.0210 146.00 |
| 16 | Run Msgs/sec %CPU/msg RDEV util |
W001045C 379.65 0.0179 54.00 |
W001049C 1085.94 0.0195 76.00 |
W001053C 1799.20 0.0205 142.00 |
| Notes: z10, 2097-E56, mci 754, two partitions, one 3-way and one 12-way, both 43G/2G. FICON CTCs as in appendix. CDR/CDU workload driver. W0A13 of 2011-10-13, stand-in for W0GOLDEN. Message rate is replies sent from server to client. Statistics from client side. | ||||
| Reply size 1000000 | Pairs | |||
| RDEVs | Metrics | 1 | 50 | 100 |
| 1 | Run Msgs/sec %CPU/msg RDEV util |
W000998C 40.485 0.1383 47.00 |
W001002C 74.790 0.1872 46.00 |
W001006C 97.760 0.1800 55.00 |
| 4 | Run Msgs/sec %CPU/msg RDEV util |
W001010C 40.285 0.1390 66.00 |
W001014C 92.178 0.2300 109.00 |
W001018C 156.416 0.2276 204.00 |
| 8 | Run Msgs/sec %CPU/msg RDEV util |
W001022C 40.985 0.1464 67.00 |
W001026C 91.638 0.2357 120.00 |
W001030C 162.968 0.2454 216.00 |
| 12 | Run Msgs/sec %CPU/msg RDEV util |
W001034C 46.185 0.1386 54.00 |
W001038C 119.286 0.2247 84.00 |
W001042C 195.000 0.2338 156.00 |
| 16 | Run Msgs/sec %CPU/msg RDEV util |
W001046C 45.565 0.1492 54.00 |
W001050C 121.608 0.2270 83.00 |
W001054C 199.784 0.2483 160.00 |
| Notes: z10, 2097-E56, mci 754, two partitions, one 3-way and one 12-way, both 43G/2G. FICON CTCs as in appendix. CDR/CDU workload driver. W0A13 of 2011-10-13, stand-in for W0GOLDEN. Message rate is replies sent from server to client. Statistics from client side. | ||||
Why APPC/VM Traffic Doesn't Scale
The reason APPC/VM traffic achieves only modest gains on a multi-CTC logical link is fairly easy to see if we look at an FCX108 DEVICE excerpt from the server side. Run W001054C was the largest APPC/VM scaling measurement we tried: server replies 1000000 bytes long, 100 client-server pairs, and a sixteen-CTC logical link. Here is the FCX108 DEVICE excerpt from the server's MONWRITE data. The server, the sender of the large messages in this experiment, is later in the alphabet, so it starts its CTC scan from the bottom of the list and works upward.
The server is making use of more than one CTC, but it is not nearly making use of all of the CTCs. This is not much of a surprise. The APPC/VM protocol layer of ISFC is known to be heavily serialized.
Contrast the APPC/VM device utilization picture with the one from large ISFC Transport workload H001750C. Remember that in the ISFC Transport workload, the client, the sender of the large messages, is earlier in the alphabet, so it starts its scan from the top and works downward.
This comparison clearly shows the payoff in having built the ISFC Transport API not to serialize. The client side is doing a good job of keeping its fourteen transmit CTCs significantly busy.
Summary and Conclusions
For traffic using the new ISFC Transport API with message sizes approximating those used in relocations, ISFC fully uses FICON fiber capacity and scales correctly as FICON chpids are added to the logical link.
For APPC/VM regression traffic, z/VM 6.2 offers improvement in data rate compared to z/VM 6.1. Message rate increases of as high as 78% were observed.
APPC/VM traffic can flow over a multi-CTC logical link, but rates
compared to a single-CTC link are only modestly better.