Memory Management: VMRM-CMM and CMMA
Abstract
VMRM-CMM and CMMA are two different approaches to enhancing the management of memory in a z/VM system by the exchange of information between one or more Linux guests and CP. Performance improvements were observed when VMRM-CMM, CMMA, or the combination of VMRM-CMM and CMMA were enabled on the system. At lower memory over-commitment ratios, all three algorithms provided similar benefits. For the workload and configuration used in this study, CMMA provided the most benefit at higher memory over-commitment ratios.
Introduction
This section evaluates the performance effects of two different approaches to enhancing the management of memory on a z/VM system. The two approaches are VM Resource Manager Cooperative Memory Management (VMRM-CMM, the Linux side of which is called "Cooperative Memory Management" also referred to as "CMM1") and Collaborative Memory Management Assist (CMMA, the Linux side of which is called "Collaborative Memory Management" also referred to as "CMM2"). VMRM-CMM uses a ballooning technique implemented in Linux. When VMRM detects a system-wide memory constraint, it notifies the participating Linux guests to release page frames. Linux releases the page frames by issuing the Diagnose X'10' function call. CMMA uses a page status technique. Page status is maintained by each participating Linux guest by using the new Extract and Set Storage Attributes (ESSA) instruction. When CP detects a system constraint, CP reclaims page frames based on this page status and without guest intervention.This report evaluates memory management based on an HTTP-serving workload. Another evaluation of VMRM-CMM and CMMA is based on Linux guests running a database server using a transaction processing (OLTP) workload in a z/VM environment. That report is found at z/VM Large Memory - Linux on System z.
Memory Management Overview
The z/VM system maps the guests' virtual memory into the real memory of the System z machine. If there are not enough real memory frames to contain all the required active guests' virtual memory pages, the active guests' virtual pages are moved to expanded storage (xstor). Once xstor becomes full, the guests' pages are migrated from xstor to DASD paging space. As the number of servers increases in a z/VM system, memory management overhead increases due to increased paging.
VMRM-CMM
VMRM-CMM can be used to help manage total system memory constraint in a z/VM system. Based on several variables obtained from the System and Storage domain CP monitor data, VMRM detects when there is such constraint and requests the Linux guests to reduce use of virtual memory. The guests can then take appropriate action to reduce their memory utilization in order to relieve this constraint on the system. When the system constraint goes away, VMRM notifies those guests that more memory can now be used. For more information, see VMRM-CMM.
CMMA
z/VM 5.3 adds support for the processor CMMA on the IBM System z9 ( z9 EC and z9 BC) processors. The ESSA instruction was introduced with the z9. CP and Linux share page status of all 4KB pages of guest memory. Using the ESSA instruction, Linux marks each page as:
- Stable (S): page has essential content the guest cannot recreate
- Unused (U): no useful content and any access to the page will cause an addressing exception
- Volatile (V): page has useful content. CP can discard the page anytime. The guest gets a discard fault on access for discarded pages
-
Potentially Volatile (P): same as Volatile (V) but CP needs to check
the dirty bit
- dirty - CP handles the page like a stable page
- not dirty - CP handles the page like a volatile page
If the processor does not support the ESSA instruction, CP will intercept the call and simulate the instruction on behalf of the processor. This technique optimizes the use of guest memory and host memory in the following ways:
- CP can preferentially steal unused, volatile, and not dirty potentially volatile pages, thus reducing paging.
- CP recognizes clean disk cache pages, the contents of which Linux is able to reconstruct, allowing CP to bypass paging out the data contents when reclaiming the backing frames for these pages. If Linux or its application subsequently tries to refer to the discarded page, Linux is notified that the page has been discarded and can reread the contents from disk or otherwise reconstruct them.
- When a Linux application releases memory, the Linux kernel marks those pages for removal. If a memory constraint occurs, CP can select those pages for removal at a higher priority or reclaim the page frames without the overhead of paging out their data content to xstor or DASD.
- The guest further benefits from the hardware Host Page-Management Assist (HPMA), which was announced in the Hardware Announcement dated July 27, 2005. HPMA support is also available on z990/z890. In conjunction with CMMA, HPMA allows the machine to supply fresh backing page frames for guest memory when the guest reuses a previously discarded page, eliminating the need for the z/VM hypervisor to intercept and resolve these host page faults.
Method
A full set of measurements was completed to evaluate the following memory management algorithms: physical partitioning, non-CMM, VMRM-CMM, CMMA, and VMRM-CMM + CMMA. The non-CMM measurements were used as the base measurements. VMRM-CMM and CMMA were evaluated separately. Then the combination of VMRM-CMM and CMMA was evaluated to observe whether there was synergy between the two.
The most basic type of improved memory management is physical partitioning where one takes the total real memory and divides it equally among the servers by changing the virtual machine sizes. In this scenario, memory is not overcommitted and thus represents the performance upper limit for the other memory management algorithms. Though we used this configuration to set performance goals, it is normally not practical in customer environments. This technique cannot be used for a large number of servers because the virtual machine size becomes less than the functional requirements of the Linux system. This technique also does not allow for temporary memory growth if the workload is in need of it.
The Apache workload was used for this evaluation. The following table contains a set of infrastructure items that remain constant for all the standard measurements of the Apache workload.
Apache workload parameters for standard
measurements in
this section
| System Model | 2094-719 |
| Processors | 4 |
| System Memory | 6G |
| Total CP xstor | 2G |
| PAGE slots | 10378K |
| MDC | ON (default) |
| Client virtual machines | 2 |
| Client connections per server | 1 |
| Number of 1M HTML files | 1200 |
| Think time (avg delay/std. dev.) | 620/50 (msec) |
| Server virtual memory | 1G |
| Servers virtual memory for Physical Partitioning | 6G/# of servers |
| 768M |
| 384M |
| 192M |
| Client virtual memory | 1G |
| Server virtual processors | 1 |
| Client virtual processors | 1 |
For each memory management algorithm, the number of servers was varied from 8 to 64. For the non-CMM measurements, the number of servers was varied from 8 to 32. For the physical partitioning measurements, the number of servers was varied from 8 to 32. Above 32 servers, the servers would not boot due to insufficient virtual memory (see above discussion).
This configuration was specifically designed to give VMRM-CMM and CMMA the most opportunity. That is, with a large number of Linux read-only file cache pages, a high VM paging rate, the presence of minidisk cache (MDC), and CPU not 100% utilized, the VMRM-CMM and the CMMA algorithms should improve the performance. In this configuration, memory contention was the only limiting factor for the 16, 24, and 32 server non-CMM measurements. The maximum memory over-commitment ratio measured was 11. Memory over-commitment ratio is calculated by dividing the total virtual memory for all virtual guests (clients and servers) by the real memory. In this configuration, a total of 64 servers defined at 1G of virtual memory, plus two clients defined at 1G of virtual memory is divided by 6G of real memory.
Processor Equipment and Software Environment
All standard measurements were completed on the z9, which has processor support for the ESSA instruction.
Earliest Recommended Software Level
| z/VM | Novell SUSE | Red Hat | |
| VMRM-CMM | z/VM 5.2 plus APAR VM64085 | SLES9 SP3 (see VMRM-CMM for recommended patches | RHEL4.7 |
| CMMA | z/VM 5.3 plus APAR VM64265 and APAR VM64297 | SLES10 SP1 update kernel 2.6.16.53-0.18 | Not Available |
For CMMA, it is not recommended to run earlier versions of VM or Linux. Therefore, for all the measurements completed in this report, we used the levels required for CMMA.
General Measurement Setup and Data Collection
Each measurement was primed unless stated otherwise. A primed run is when the Apache HTTP files are pre-referenced so that they are in the Linux file cache and/or MDC before the measurement begins. The two client guests were configured to not participate in the memory management algorithms. For each measurement, monitor data, Performance Toolkit for VM (Perfkit) data, and hardware instrumentation data were collected.
VMRM-CMM Measurement Setup Details
To enable VMRM-CMM, a VMRM configuration file containing the appropriate NOTIFY MEMORY statement was created on the A-disk of the VMRMSVM userid. Monitoring was started before each measurement with the following command:
-
IRMSERV VMRM CONFIG A
where VMRM CONFIG A is the name of the configuration file.
In the Linux server, the current number of pages released by Linux to CP can be found with the following command in Linux:
-
cat /proc/sys/vm/cmm_pages
For more instructions on how to enable VMRM-CMM for both VM and Linux, see VMRM-CMM.
CMMA Measurement Setup Details
For the standard measurements, where CMMA processor support existed, by default the z/VM software is enabled for CMMA. The Linux support for CMMA was activated at boot time by using the following option in the Linux parm file:
-
cmma=on (default is cmma=off)
Memory assist was specifically set OFF for the clients by issuing the following command from the client guests before boot time:
-
CP SET MEMASSIST OFF
For more information on the CP SET MEMASSIST command, see z/VM V5R3.0 CP Commands and Utilities Reference.
To ensure CMMA is active both on VM and Linux, a query command can be issued from a guest. See the above z/VM V5R3.0 CP Commands and Utilities Reference for more information.
-
CP Q MEMASSIST
For relevant documentation on Linux on System z, refer to the latest Device Drivers, Features, and Commands manual on the "October 2005 stream" page.
Results and Discussion
For each cooperative memory management algorithm, the number of servers was varied with each measurement. Figure 1 shows the Transaction Rate versus the Number of Servers for non-CMM and physical partitioning measurements.
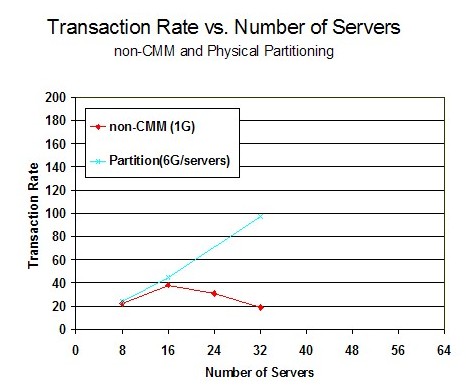
For the non-CMM measurements, the best results were achieved at 16 servers and then decreased as additional servers were added. At 16 servers, the memory over-commitment ratio is 3. This demonstrated the opportunity for any type of cooperative management algorithm. Perfkit data showed that with non-CMM, very few pages were allocated to MDC because the servers were large enough to hold the HTTP files in the Linux cache. As the number of servers increased, paging to DASD increased and the DASD avoid rate was very low.
For the physical partitioning measurements, the transaction rate increased as the number of servers increased but measurements could not be completed beyond 32 servers because the virtual machine size became less than the functional requirements of the Linux system. Perfkit data showed that a large number of pages were allocated for MDC and the MDC hit ratio was high. The virtual machine size was small enough that not all the HTTP files could fit into the Linux file cache. Thus, for all the Linux servers, the files remained in the MDC.
Figure 2 shows the Transaction Rate versus the Number of Servers for all five memory management algorithms.
Figure 2. Transaction Rate vs. Number of Servers:
All five Algorithms: Processor z9, 6G real memory
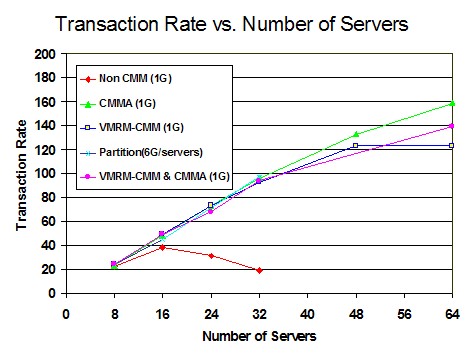
VMRM-CMM, CMMA, and VMRM-CMM + CMMA scaled to 32 servers just as did physical partitioning, thus, demonstrating the expected degree of improvement. All four algorithms had equal improvement because they were limited by the think time in the clients.
For CMMA, the number of servers was varied from 8 to 64 and throughput continued to increase as the number of servers increased. CMMA provided the best results as it scaled to 64 servers. Perfkit data showed that with CMMA, the majority of MDC pages were in expanded storage, not in real memory. As CP was stealing volatile pages from the Linux cache of each server, the HTTP files would no longer fit into the Linux cache. In addition, CP does not write volatile pages to xstor, thus there is more opportunity to use xstor for MDC. This combined action caused most of the HTTP files to be stored in MDC for all the Linux servers. In the Special Studies section, CMMA 64-server measurements were completed to understand how it would scale as the system was more memory constrained without additional servers.
For VMRM-CMM, the number of servers was varied from 8 to 64 and the throughput continued to increase as the number of servers increased. Results were nearly identical to CMMA except for the 64-server measurement. With 64 servers, VMRM log data showed that the SHRINK requests were much larger than what would be easily handled by the Linux server and thus the amount of processor time per transaction in Linux greatly increased between the 48-server and the 64-server measurement. Perfkit data showed that with VMRM-CMM, MDC was allocated more space than with CMMA measurements and more space than was actually needed for a good hit ratio. More than 60% of the MDC allocated space was in real memory and less than 40% was in xstor. In this scenario, capping MDC may improve performance.
For VMRM-CMM + CMMA, the number of servers was varied from 8 to 64 and the throughput continued to increase as the number of servers increased. The throughput results were nearly identical to VMRM-CMM and CMMA except for the 64-server measurement where it was between the VMRM-CMM and CMMA results. With 64 servers, the VMRM SHRINK requests were sometimes larger than what could be easily handled by the Linux server and thus the amount of processor time per transaction in Linux increased between the 32-server and the 64-server measurements. This was similar to VMRM-CMM measurements but a lower percentage, probably because CMMA stealing was also reducing the memory over-commitment. The volatile steal rate was very low in this measurement compared to the CMMA measurement. This was expected because the VMRM-CMM activity had already eliminated most of the pages that would have been marked volatile. The MDC allocated space looked more like the VMRM-CMM measurement than the CMMA measurement.
Figure 3 shows the Processor Utilization versus the Number of Servers.
Figure 3. Processor Utilization vs.
Number of Servers: Processor z9, 6G real memory
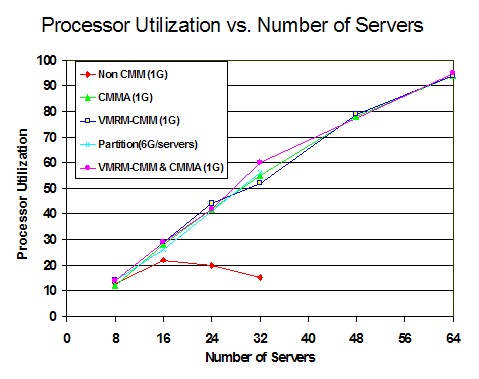
In the non-CMM run, processor utilization did not scale as more servers were added because the throughput was limited by DASD paging. For the other memory management algorithms, processor utilization scaled as the number of servers increased to 64. This chart also demonstrates that the workload was not CPU limited.
Figure 4 shows the Internal Throughput Rate (ITR) versus the Number of Servers.
Figure 4. ITR vs. Number of Servers:
Processor z9, 6G real memory
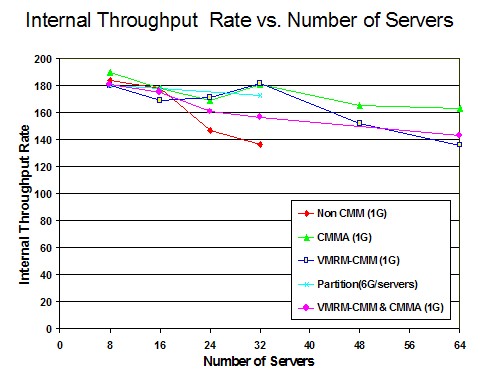
The non-CMM measurements showed that as the number of servers increased, the overhead of managing the memory increased. This graph also demonstrated the CPU efficiency of all the other memory management algorithms. At 64 servers, CMMA had the highest ITR, while VMRM-CMM had the lowest.
Figure 5 shows the Paging Space Utilization versus the Number of Servers.
Figure 5. Paging Space Utilization
vs. Number of Servers:
Processor z9, 6G real memory
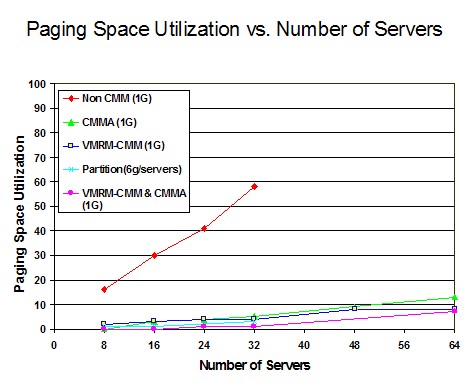
The non-CMM measurements showed that as the number of servers increased, the paging space utilization increased. In the measurements that included the memory management algorithms, paging space utilization was significantly reduced. In the case of VMRM-CMM and partitioning, this was due to the greatly reduced actual or effective server virtual storage size. In the case of CMMA, this was due to CP's preference for stealing volatile pages from the server guests, the contents of which do not need to be paged out.
Special Studies
This section of the report evaluates special memory management scenarios that were derived from the analysis above.
CMMA Scalability
Since CMMA scaled perfectly to 64 servers, a series of 64-server measurements in smaller real memory were completed to see how CMMA would be affected by more memory constraint. Three measurements were completed using the standard configuration at 64 servers and reducing the memory from 6G to 3G. Table 1 shows the transaction rates for the 4G and 3G measurements were not much lower than the 6G measurement. Thus, they provided nearly perfect scaling. The ITR remained nearly constant for all three measurements. This demonstrated CMMA memory management efficiency as the memory over-commitment ratio reached 22.
| System Memory (P) | 6G | 4G | 3G |
| Run ID | CMM2064 | CMM204G1 | CMM203G1 |
| Memory Over-commitment Ratio | 11 | 17 | 22 |
| Tx/sec (h) | 150.5 | 149.1 | 146.6 |
| ITR (h) | 162.5 | 169.6 | 161.0 |
A measurement at 2G of real memory was so memory constrained that AWM session timeouts occurred. The DASD paging devices became the limiting factor, causing a large drop in processor utilization. The heavy paging delay probably led to long AWM response times and thus the AWM session timeouts. It appeared that both VM and all 64 Linux servers were still running correctly at the end of the measurement.
Enablement Cost of CMMA
The CMMA enablement overhead was evaluated using a workload that ran at 100% processor utilization and caused no VM paging on a processor with the ESSA support (z9) and on a processor where the ESSA instruction needed to be simulated by CP (z990). This workload does not give an opportunity for a memory management algorithm to improve performance. The only changes from the standard workload were to increase system memory to 20G and reduce the AWM think time delay to zero. To disable CMMA for the whole system, the following command was issued:
-
CP MEMASSIST OFF ALL
Table 2 has a comparison of selected values for the CMMA enablement overhead measurements on a processor (z9) with the real ESSA instruction support. Transaction rate decreased by 1.8% because of the 1.7% increase in CPU usecs (microseconds) per transaction. The increased usecs per transaction was due to Linux CMMA support including use of the ESSA instruction. The ESSA instruction accounted for 40% of the overall increase in usecs per transaction.
Table 2. CMMA Enablement Cost on a Processor with ESSA Support
| CMMA Enable Flag | OFF | ON | ||
| Run ID | BASEDN0 | CMM2DU0 | Delta | Pct |
| Tx/sec (h) | 244.6 | 239.8 | -4.5 | -2.0 |
| ITR (h) | 255.6 | 251.2 | -4.4 | -1.7 |
| Total CPU usec/Tx (h) | 15651 | 15921 | 270 | 1.7 |
| CP CPU usec/Tx (h) | 5617 | 5672 | 55 | 1.0 |
| Emul CPU usecs/Tx (h) | 10034 | 10249 | 215 | 2.1 |
| Note: usec/Tx = microseconds/transaction | ||||
Table 3 has a comparison of selected values for the CMMA enablement overhead measurements on a processor where the ESSA instruction must be simulated by z/VM. Transaction rate decreased by 7.4% because of the 8.3% increase in CPU usecs (microseconds) per transaction. The increased usecs per transaction was due to Linux CMMA support including use of the ESSA instruction and the cost of z/VM to simulate the ESSA instruction. z/VM's simulation of the ESSA instruction accounts for 77% of the increased usecs per transaction and the Linux support accounts for the other 23% of the overall increase in usecs per transaction.
Table 3. CMMA Enablement Cost On Processor without ESSA support
| CMMA Enable Flag | OFF | ON | ||
| Run ID | BASETRX0 | CMM2SIM0 | Delta | Pct |
| Tx/sec (h) | 158.3 | 146.9 | -11.4 | -7.2 |
| ITR (h) | 164.4 | 151.8 | -12.6 | -7.7 |
| Total CPU usec/Tx (h) | 24335 | 26349 | 2014 | 8.3 |
| CP CPU usec/Tx (h) | 8654 | 10220 | 1566 | 18.1 |
| Emul CPU usec/Tx (h) | 15629 | 16129 | 448 | 2.9 |
| Note: usec/Tx = microseconds/transaction | ||||
Overall, for a non-paging, 100% CPU bound workload we found that the throughput does decrease with CMMA enabled. On a system where the ESSA instruction was executed on the processor, we observed the throughput to decrease by 1.8% when CMMA was enabled. On a system where the ESSA instruction was simulated by CP, we observed the throughput to decrease by 7.4% when CMMA was enabled. Thus, the overhead of running CMMA on a system where the processor does not support the ESSA instruction was more costly than on a system that has ESSA processor support.
CMMA with simulated ESSA versus VMRM-CMM
Two measurements on the z990 processor were completed to compare CMMA with simulated ESSA to VMRM-CMM. Using the standard configuration, two measurements were completed with 48 servers. Table 4 compares a 48-server simulated CMMA measurement to a 48-server VMRM-CMM measurement. The transaction rate for VMRM-CMM was 11.0% higher than the simulated version of CMMA. This is attributed to the ESSA instruction in CMMA being simulated by CP. CP microseconds per transaction was 26% higher than for VMRM-CMM.
Table 4. CMMA with simulated ESSA vs. VMRM-CMM
| CMM | CMMA with simulated ESSA | VMRM-CMM | |
| Run ID | CMM2T048 | CMM1T048 | Pct |
| Tx/sec (h) | 100.0 | 110.7 | 10.7 |
| ITR (h) | 103.7 | 116.7 | 12.5 |
| Total CPU usec/Tx (h) | 38586 | 34288 | -11.1 |
| CP CPU usec/Tx (h) | 15052 | 11154 | -25.9 |
| Virtual I/O Rate (p) | 8715 | 1258 | -85.6 |
| CMM2 ESSA Ops (z)* | 3170690 | 0 | -100 |
|
Note: usec/Tx = microseconds/transaction
* average per monitor interval (30 seconds) | |||
Summary and Conclusions
Conclusions
- All three algorithms provided benefit over the non-CMM workload.
- CMMA provided the most benefit for this workload where a large number of volatile pages existed in the Linux file cache.
- VMRM-CMM showed weakness at higher memory over-commitment ratios because the VMRM SHRINK value was larger than what was functionally required by the Linux guest.
- VMRM-CMM provided the most benefit for this workload on a processor that does not support the ESSA instruction.
- In a workload where the memory over-commitment ratio is not too high and a large number of stable or potentially volatile changed pages exist in the Linux cache, VMRM-CMM may provide more benefit than CMMA. This conclusion was derived from the z/VM Large Memory - Linux on System z study.
Characteristics of a good workload for VMRM-CMM and CMMA benefits
Depending on the Linux workload characteristics and the system configuration, VMRM-CMM and CMMA benefits will vary. Below are some characteristics to look for when determining if VMRM-CMM or CMMA may benefit your system.
- a high guest memory to real memory over-commitment ratio
- high VM paging rate
- not running 100% CPU busy
- memory contention is a limiting factor
- many Linux read-only file cache pages (check using cat /proc/meminfo )
- Linux files fit into MDC
Epilogue
Prior to z/VM 5.4 or APAR VM64439 for z/VM 5.2 and 5.3, VMRM had no lower bound beyond which it would refrain from asking Linux guests to give up memory. In some workloads, Linux guests that had already given up all the storage they could give used excessive CPU time trying to find even more storage to give up, leaving little CPU time available for useful work.With z/VM 5.4 or APAR VM64439, VMRM has been changed so that it will not ask a Linux guest to shrink below 64 MB. This was the minimum recommended virtual machine size for SuSE and RedHat at the time the work was done.
To see how VMRM-CMM with the safety net implementation compares to the other CMM algorithms studied above, a VMRM-CMM measurement with the safety net implementation was completed at 64 servers. See standard workload for specific system configuration settings.
Figure 6 shows the transaction rate versus the number of servers for five memory management algorithms including the new VMRM-CMM measurement with the safety net defined at 64 MB.
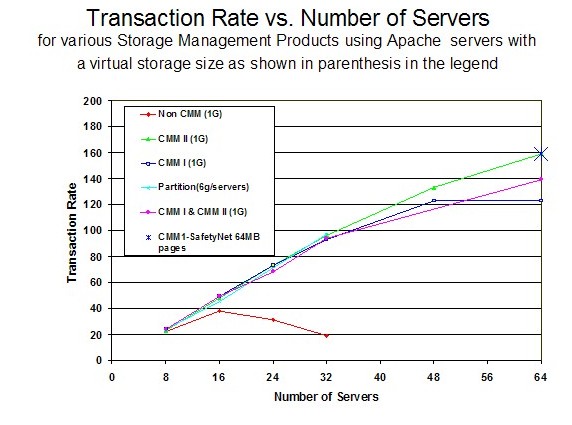 |
Compared to the VMRM-CMM without the safety net, the transaction rate for VMRM-CMM with the safety net increased by 29% and equalled the CMMA (aka CMM II) transaction rate. Thus, the safety net reduced the amount of CPU time Linux used to search for storage.