24-Way Support
Prior to z/VM 5.1.0, the VM Control Program (CP) supported up to 16 processor engines for a single z/VM image. With z/VM 5.1.0, CP can support up to 24 processors per image in a zSeries LPAR configuration.
This section summarizes the results of a performance evaluation that was done to verify that z/VM 5.1.0 can support an LPAR configuration with up to 24 CPUs with a suitable workload. This was accomplished using a Linux webserving workload that was driven to fully utilize the processing capacity of the LPAR in which it was running, resulting in a CPU-intensive workload. The measurements captured included the external throughput rate (ETR), CP CPU time per transaction (CP Msec/Tx), and time spent spinning, to wait on CP locks.
All performance measurements were done on a z990 system. A 2084-C24 system was used to conduct experiments in an LPAR configured with 6.5GB of central storage and 0.5GB of expanded storage. 1
The LPAR processor configuration was varied for the evaluation. The hardware configuration included shared processors and processor capping for all measurements. The 16-way measurement was used as the baseline for comparison as this was the previous maximum number of supported CPUs in an LPAR with z/VM. The comparison measurements were conducted with the LPAR configured with shared processors as an 18-way, 20-way, 22-way, and 24-way. Processor capping was active at a processing capacity of 4.235 processors for all measurements in order to hold the system capacity constant.
Processor capping creates a maximum limit for system processing power allocated to an LPAR. Using a workload that fully utilizes the maximum processing power for the LPAR allows the system load to remain constant at the LPAR processing capacity. Then, any effects that are measured as the number of processors (or n-way) is varied can be attributed to the n-way changes (since the processing capacity of the LPAR remains constant).
The software configuration for this experiment used a z/VM 4.4.0 system. However, 24-way support is provided with z/VM 5.1.0; all functional testing for up to 24 CPUs was performed using z/VM 5.1.0.
The application workload consisted of:
- 100 Linux guest virtual machines performing HTTP web serving (these servers were constantly busy serving web pages).
- 2 Linux guest virtual machines acting as clients constantly sending requests for web pages (with zero think time) to the 100 Linux guest webservers.
An internal version of Application Workload Modeler (AWM) was used to drive the application workload measurement for each n-way configuration. Hardware instrumentation data, CP monitor data, and Performance Toolkit data were collected for each measurement.
The application workload used for this experiment kept the webservers constantly busy serving web pages, which enabled full utilization of the LPAR processing power. Because of this, the External Throughput Rate (ETR) and Internal Throughput Rate (ITR) are essentially the same for this experiment.
Figure 1 shows the ETR and ITR as the number of processors is increased.
Figure 1. Large N-Way Software Effects on ETR & ITR
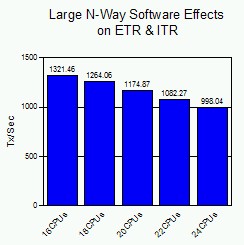 |
When system efficiency is not affected by n-way changes, the expected result is that the ETR and ITR remain constant as the number of processors increases. Even though the number of available CPUs is being increased, processor capping holds the total processing power available to the LPAR constant. This chart illustrates that there is a decrease in the transaction rate which indicates a decrease in system efficiency as the number of processors increases.
In a typical customer production environment where processor capping is not normally enabled, the result would be an increase in the transaction rate as the n-way increases. However, the expected increase in the transaction rate would be somewhat less than linear, since the results of our experiment show that there is a decrease in system efficiency with larger n-way configurations.
Figure 2 shows the effect of increasing the number of processors on CPU time per transaction for CP and emulation.
Figure 2. Large N-Way Software Effects on Msec/Tx
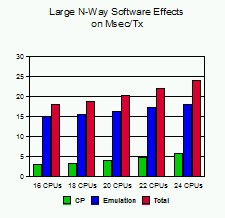 |
This chart shows measurements of CPU time per transaction for CP and the Linux guests (represented by emulation) as the n-way increases. Notice that both CP and emulation milliseconds per transaction (Msec/tx) increase with the number of processors. So, both CP and the Linux guests are contributing to decreased efficiency of the system.
The increase in emulation Msec/tx can be attributed to two primary causes. First, the Linux guest virtual MP client machines are spinning on locks within the Linux system. Second, these Linux guest client machines are generating Diagnose X'44's. Diagnose X'44's are generated to signal CP that the Linux machine is going to spin on an MP lock, allowing CP to consider dispatching another user. The diagnose rate and diagnoses per transaction data contained in Table 1 is almost all Diagnose X'44's.
Figure 3 shows the breakout of CP CPU Time per transaction (CP Msec/tx).
Figure 3. Breakout of CP Msec/Tx
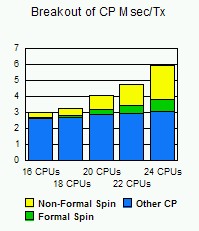 |
This chart shows the elements that make up the CP CPU Time per transaction bar from the previous chart. It is broken out into the following elements:
- Formal spin time is the time spent spinning waiting for CP locks that is captured in CP Monitor records.
- Non-formal spin time is time spent spinning waiting for CP locks that is not captured in CP Monitor records.
- Other CP is base CPU time (unrelated to MP lock contention).
Both the formal and non-formal spin time increase as the n-way increases. This is expected since lock contention will generally increase with more processors doing work and, as a result, competing for locks. Note that the non-formal spin time is much larger than the formal spin time and becomes more pronounced as the number of processors increases.
The rate of increase of the formal spin time is similar to the rate at which the non-formal spin time increases (as the size of the n-way is increased). This information can provide some insight regarding the amount of non-formal spin time that is incurred, since it is not captured in the monitor records.
Table 1 shows a summary of the data collected for
the 16-way, 18-way, 20-way, 22-way and 24-way measurements.
Table 1. Comparison of System Efficiency with Increasing N-Way
|
|
|
|
|
|
Tx/sec (n) ITR (h) | 1321.46 1321.99 | 1264.06 1264.57 | 1174.87 1175.34 | 1082.27 1082.81 | 998.04 998.54 |
Total Util/Proc (h) CP Util/Proc (h) Emul Util/Proc (h) | 99.96 16.80 83.17 | 99.96 17.35 82.62 | 99.96 20.01 79.95 | 99.95 21.63 78.32 | 99.95 24.80 75.15 |
Percent CP (h) | 16.8 | 17.4 | 20.0 | 21.6 | 24.8 |
Total msec/Tx (h) CP msec/Tx (h) Emul msec/Tx (h) | 18.155 3.050 15.104 | 18.979 3.293 15.686 | 20.419 4.088 16.331 | 22.165 4.797 17.367 | 24.034 5.963 18.070 |
Pct Spin Time (p) Sched Pct Spin Time (p) TRQ Pct Spin Time (p) | 5.721 4.854 0.827 | 6.041 5.178 0.798 | 7.826 6.901 0.874 | 7.414 6.522 0.848 | 6.733 5.928 0.754 |
Diagnose Rate (p) Diagnoses/Tx (p) | 25141 19.025 | 23847 18.865 | 22763 19.375 | 23885 22.069 | 23486 23.532 |
RATIOS |
|
|
|
|
|
Tx/sec (n) ITR (h) | 1.000 1.000 | 0.957 0.957 | 0.889 0.889 | 0.819 0.819 | 0.755 0.755 |
Total Util/Proc (h) CP Util/Proc (h) Emul Util/Proc (h) | 1.000 1.000 1.000 | 1.000 1.033 0.993 | 1.000 1.191 0.961 | 1.000 1.288 0.942 | 1.000 1.476 0.904 |
Percent CP (h) | 1.000 | 1.036 | 1.190 | 1.286 | 1.476 |
Total msec/Tx (h) CP msec/Tx (h) Emul msec/Tx (h) | 1.000 1.000 1.000 | 1.045 1.080 1.039 | 1.125 1.340 1.081 | 1.221 1.573 1.150 | 1.324 1.955 1.196 |
Pct Spin Time (p) Sched Pct Spin Time (p) TRQ Pct Spin Time (p) | 1.000 1.000 1.000 | 1.056 1.067 0.965 | 1.368 1.422 1.057 | 1.296 1.344 1.025 | 1.177 1.221 0.912 |
Diagnose Rate (p) Diagnoses/Tx (p) | 1.000 1.000 | 0.949 0.992 | 0.905 1.018 | 0.950 1.160 | 0.934 1.237 |
| Note: These measurements were done on a z990 machine in a non-paging environment with processor capping in effect to maintain processing capacity constant. The workload consisted of 100 zLinux guests performing Apache web serving. (h) = hardware instrumentation, (p) = Performance Toolkit | |||||
While the workload used for this evaluation resulted in a gradual decrease in system efficiency as the number of processors increased from 16 to 24 CPUs, the specific workload will have a significant effect on the efficiency with which z/VM can employ large numbers of processor engines.
As a general trend (not a conclusion from this evaluation), when z/VM is running in LPAR configurations with large numbers of CPUs, VM overhead will be lower for workloads with fewer, more CPU-intensive guests than for workloads with many, lightly loaded guests. Some workloads (such as CMS workloads) require master processor serialization. Workloads of this type will not be able to fully utilize large numbers of CPUs because of the bottleneck caused by the master processor serialization requirement. Also, application workloads that use virtual machines that are not capable of using multiple processors, such as DB2, SFS, and security managers (such as RACF), may be limited by one of those virtual machines before being able to fully utilize a large n-way configuration.
This evaluation focused on analyzing the effects of increasing the n-way configuration while holding processing power constant. In production environments, n-way increases will typically also result in processing capacity increases. Before exploiting large n-way configurations (more than 16 CPUs), the specific workload characteristics should be considered in terms of how it will perform with work dispatched across more CPUs as well as utilizing the larger processing capacity.
Footnotes:
- 1
- The breakout of central storage and expanded storage for this evaluation was arbitrary. Similar results are expected with other breakouts because the measurements were obtained in a non-paging environment.