Description of PTKGUI
Download count:
5 this month, 3169 altogether.
Downloads for PTKGUI :
VMARC archive: v-2063K
From Kris Buelens, IBM Belgium
The purpose of PTKGUI is to give access to the data in Performance Toolkit for VM Trend and Summary files. It uses the VM GUI Facility to have a modern look; as VM GUI does not support Graphics, GDDM is used to display the graphs in the 3270 session.
And, even when you don't have GDDM REXX, you can use PTKGUI's interactive formula tailoring function (described in PTKGVARS HELPCMS). It makes it easy to look at the fields in a Summary file record, test a calculation, etc. When happy with the result, the REXX and CMS Pipelines statements to retrieve a given performance variable from PTK's Summary files can be saved in a file. Then you can include that code in your own execs and more easily extract the data you want from PTK's Summary files.
The base design was oriented towards ease of use: a simple mouse click
should display a graphic of various performance data. With one mouse click
it is possible to display the same graph, but for another day or the same
graph but for another DASD/user ...
As author, I have problems saying "PTKGUI is very useful, and is
very easy to produce graphs of PTK's performance data" but I
think I can honestly say it.
In general, almost anything that PTK can print in a report can also be plotted by PTKGUI. Stronger: PTK cannot produce a time based listing with for example %busy of a specific DASD or the IO-rate of a given user. PTKGUI can give you such graphics.
I still have my own list of wanted improvements, but, if you have special wishes, please let me know by sending me an e-mail. Especially: if you cannot use PTKGUI, let me know why.
Before you start, be sure to read the PTKGUI README file.
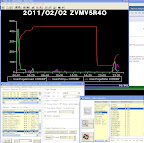
To give you an idea of what PTKGUI can display, here some 'clickable' screenshots:

|
|

| ||
| Page rate of the system and user CCRPIBK, between 00:00 and 12:00 | DB2 pages used, %CPU and Page rate | Processor busy of processors 1, 2, and 3 |
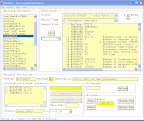
And here two screenshots of PTKGUI's Variable Tailoring function
|

| |
| The definition of PctCpuTot: (userTime + systemTime) / ElapsedTime | The definition of UserCPUwait, for user VSEPROD. |
Version 1.0.a Highlights Jul 2011
- In rare occasions, PTKGUI's Summary files can contain duplicate records.
I don't know yet if PTK itselfs creates them twice, or if my PTKGCOLL
EXEC somehow saves them twice.
If you have a summmary file with such doubles, and one plots something for 3 or more users/disks/xxxx one gotFPLSPX1091E Operator expected; found + FPLMSG004I ... Issued from stage 5 of pipeline 10 name "AddedPipe1" FPLMSG001I ... Running "SPECS h: 1.2 . m: 3.2 . PRINT h*60+m 1"or, when using plastic pipes:PIPSPV1038E Not a decimal number: 1E. PIPMSG004I ... Issued from stage 8 of pipeline 10 name "AddedPipe1". PIPMSG001I ... Running "SPECS h: 1.2 . m: 3.2 . PRINT h*60+m 1"The new code bypasses this problem. - The copyright & about pictures in the package were backlevel.
Version 1.0 Highlights Jun 2011
This is version 1.0 only, so not all I want is possible yet. Missing:- We do not yet support the use of PTK's Extended Trend files (by default named "nodeid FCXTREND")
- Channel data are not available either
- As opposed the VMPRF (for which I wrote PRFGUI), PTK keeps History files with much system wide information. I plan to support them too.
- Since a while, PTK delivers MACLIBs with record descriptions. I plan to use these instead of my own, extracted from PTK's PDF manual.